Смотри обучающее видео по маркету на YouTube
Как купить торгового робота или индикатор
Запусти робота на
виртуальном хостинге
виртуальном хостинге
Протестируй индикатор/робота перед покупкой
Хочешь зарабатывать в Маркете?
Как подать продукт, чтобы его покупали
Новые технические индикаторы для MetaTrader 5 - 46

Gold Reaper Scalper.
This is a simple indicator that will help you in scalping gold. It will eliminate the waiting for a setup which will give you more time to do other things. This indicator works best on 5 minute and 15 minute charts. Arrows will appear indicating direction of price. Use proper risk management when entering and exiting trades. Works best on GOLD.

Get the best out of your forex trading experience with our Superb Trend indicator! Our revolutionary technology helps you make smarter and more successful trades, no matter your skill level. With a simple and intuitive interface, you'll be able to analyze trends and make wiser decisions in no time. Stop gambling with your money; start leveraging our Superb Trend Indicator to outperform the market!
Trend Signals: Bullish trend will show as Green line. Bearish trend will show as Red line.
Supe
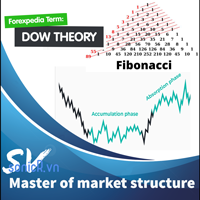
This indicator combine DOW theory with Fibonancy level to determine the structure of financial markets. It include resistance determine to provide an overview of the market. The Dow Theory is an approach to trading developed by Charles H. Dow, who, with Edward Jones and Charles Bergstresser, founded Dow Jones & Company, Inc. and developed the Dow Jones Industrial Average in 1896. In summarize, DOW theory is: + Technical framework that predicts the market is in an upward trend if one of its aver

Supply and demand zones are at the heart of supply and demand trading . These zones are areas that show liquidity at a specific price. The supply zone is also called the distribution zone, while the demand zone is called the accumulation zone. Our indicator automatically draw supply and demand zones in Metatrader 5. It give opportunity to understand trading zone and avoiding risk.

Critical Trading, Omni-Channel This indicator lets you create a unique channel from a base type and a range type. Channels are great for spotting over-extensions or the start of new trends. With an ever changing market it is important to create your own edge in the market that no one else has. Let Omni-Channel add to your unique trading strategy. Please contact criticaltrading@outlook.com for more info or advice on adding any other functionality.
FREE

Daily VWAP, continues for a period of hours (eg, 10 hours of history),
with color to indicate change of direction and bands to map good entry and exit points. The indicator was created to map the center of the market, and find good buying moments, trend analysis or market correction points are easily detected, allowing you to understand moments of exhaustion and buying and selling points Copyright (c) <year> <copyright holders> Permission is hereby granted, free of charge, to any person obtaini
Индикатор используется для торговых бумов и обвалов, является супердетективом трендов. Когда на рынке восходящий тренд, используйте сильный сигнал, чтобы поймать всплеск, когда на нисходящем тренде, используйте обычный сигнал, чтобы поймать больше всплесков.
Индикатор по своей природе является базовым ценовым действием с некоторой математической логикой. Используется только для ловли шипов.
Индикатор имеет следующий вывод
1. Сильный сигнал
2. Обычный сигнал
3. Оповещение по электронной поч

** All Symbols x All Time frames scan just by pressing scanner button ** *** Contact me to send you instruction and add you in "Swing scanner group" for sharing or seeing experiences with other users. Swing EA: https://www.mql5.com/en/market/product/124747 Introduction: Swing Scanner is the indicator designed to detect swings in the direction of the trend and possible reversal swings. The indicator studies several price and time vectors to track the aggregate trend direction and dete
Что такое двойная вершина и дно
Паттерны «двойная вершина и дно» — это графические паттерны, которые возникают, когда базовая инвестиция движется по образцу, аналогичному букве «W» (двойное дно) или «M» (двойная вершина). Анализ двойной вершины и основания используется в техническом анализе для объяснения движения ценной бумаги или других инвестиций и может использоваться как часть торговой стратегии для использования повторяющихся моделей.
Вы можете найти версию MT4 здесь
Индикатор показыв

Индикатор Price Action Finder Multi это индикатор точек входа, который ищет и отображает паттерны системы Price Action сразу на десятках торговых инструментов и на всех стандартных таймфреймах: (m1, m5, m15, m30, H1, H4, D1, Wk, Mn). Найденные паттерны индикатор помещает в таблицу в нижней части экрана. Кликая на названия паттерна в таблице вы можете перемещаться на график, где этот паттерн находится. Инструкция/Мануал ( Обязательно читайте перед приобретением ) | Версия для МТ4 Преимущества
1.
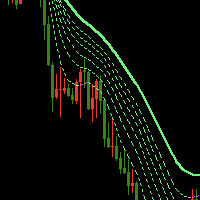
The Waterfall Trend Indicator MT5 uses line regression algorithm, using "Waterfall" in its name is in that it like waterfall when there is a strong down market trend. The indicator draws seven lines, one of which is sold line, others are dash line, the sold line is more stable. Indicator introduction The indicator can effectively filter price noise since it is calculated with line regression. It can be used to analyze market trend and design new expert that is based on trend. When the trend lin

This z-score indicator shows the correct z-score of an asset, as it uses the normalized price data for calculation, which is the only correct way. Z-score is only applicable for normal distributed data, therefore not the actual price is considered, but the normalised returns, which were assumed to follow a normal distribution. Returns are mean reverting and assumed to follow a normal distribution, therefore z-score calculation of returns is more reliable than z-score on price, as price is NOT m
This indicator builds upon the previously posted Nadaraya-Watson Estimator. Here we have created an envelope indicator based on kernel smoothing with integrated alerts from crosses between the price and envelope extremities. Unlike the Nadaraya-Watson Estimator, this indicator follows a contrarian methodology. Settings
Window Size: Determines the number of recent price observations to be used to fit the Nadaraya-Watson Estimator.
Bandwidth: Controls the degree of smoothness of the envelopes

Critical Trading, Currency Strength. Этот индикатор позволяет просматривать истинные изменения стоимости в 8 основных валютах, эта возможность имеет множество применений для простой и расширенной торговли на рынке Форекс. Нет необходимости переключаться на неточные сторонние приложения или веб-сайты. Это всего лишь несколько вариантов использования силы валюты. Прикрепите к графику, выберите метод времени (установленный период баров или начальную дату) и готово Чтобы получить дополнительную инфо

Sniper2 , It has points of lines, with colors that are showing you an entrance, that work as support and resistance! green dotted lines green shows entry for sale, the red dotted lines show a buy entry, pay attention to the supports that work as a break to catch long candles in a longer period of time. works for forex all pairs works for synthetic indices all pairs ! indicator on sale!

Sniper Clock Oscillator. It is an indicator where it meets the strategy from the crossing of the 50 line with a blue line and a red line. An alert is sent giving entry for purchase or sale! very effective and easy to use It is used in the synthetic index markets, ideal for volatility and jumps. It is used in the forex markets, in all currency pairs. It is used for scalping and intra daily. It serves to catch long trends at high temporalities too! Good profit!

Sniper rank, It has a gang programmed to hunt down perfect tickets. It has two lines that are used to hunt perfect pivots when the sails of the band come out, They work for all pairs of synthetic indices, perfect for volatility and jumps It also serves for marking forex, it operates in all pairs It is used for scalping and higher temporalities! Perfect Profit!!!!

Moving Level , Special indicator for hunting trends and scalping! programmed to use it in any temporality, It has the trend volume strategy by marking an arrow if it is long or short accompanied by the colors blue yellow and red when it marks the yellow line with the arrow pointing up and is accompanied by blue lines, it is an uptrend When it marks the down arrow with the yellow line and is accompanied by red lines, it is a downtrend. It is used in the synthetic index markets in all pairs, It is

the AK CAP toolbox free to use;
it includes the same indicators we use for our daily trading and we think the simpler the better. Lightweight indicator for use on all timeframes. that includes VWAP with vwap value indicator on top right. 3 EMA: FAST, MEDIUM, SLOW the candle timer to show how much time left in a candle.
colors and positions are fully customizable.
enjoy
FREE

A Simple Visual Indication of the Trading Sessions Times. This Indicator will help you Visualize the Trading sessions and take advantage of the session precise timing to trade at the open of each session where there might be more liquidity. This Indicator is FREE, So pls Dont forget to leave a 5 * stars Review, This Will help me create new Ideas and Indicators and Upload them to the Market. More Professional and useful Indicators and tools here: https://www.mql5.com/en/users/dubaiforexgroup/sel
FREE

The purpose of using Smart money index (SMI) or smart money flow index is to find out investors sentiment. The index was constructed by Don Hays and measures the market action. The indicator is based on intra-day price patterns. The beginning of the trading day is supposed to represent the trading by retail traders. The majority of retail traders overreact at the beginning of the trading day because of the overnight news and economic data. There is also a lot of buying on market orders and shor
FREE
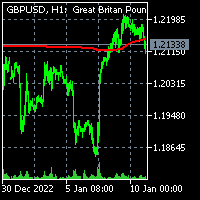
To get access to MT4 version please click here . - This is the exact conversion from TradingView: "Trend Regularity Adaptive Moving Average","TRAMA" By " LuxAlgo ". - This is a light-load processing and non-repaint indicator. - Buffer is available for the main line on chart. - You can message in private chat for further changes you need. Thanks for downloading

An Ultimate Tool for quick and efficient market analysis. Unique combination of solid indicators defining market direction for trend tracking and filtration designed for you to stay on the right side of the market.
Market Rider Tools gives you access to one of the most used from professional trades indicators on worldwide, which were not build in for MT4 and MT5 terminals . These are unique non-repainting indicators designed to be used on all time frames for all instruments classes: For

An Ultimate Tool for quick and efficient market analysis. Unique combination of solid indicators defining market direction for trend tracking and filtration designed for you to stay on the right side of the market.
Market Rider Oscillators gives you access to one of the most used from professional trades indicators on worldwide, which were not build in for MT4 and MT5 terminals . These are unique non-repainting oscillators designed to be used on all time frames for all instruments classe

Defining Range ( DR ) and Implied Defining Range ( IDR ) indicator Pro with added features from free version
Show DR and IDR ranges Sessions on the chart for RDR Regular defining range (New York Session)
ADR After defining range (Asian session) ODR Outside defining range (London Session)
Buttons on chart to enable / disable :
Show Imbalance ( IMB ) Show Volume Imbalance ( VIB ) Show Gap's between open and close
Show Standard Deviation ( SD )
Show last 3 Sessions or Back

Indicador Regressão Linear – Par de Ativos - INTRADAY Indicador é um oscilador que faz o plot do Resíduo resultado da regressão linear entre os dois ativos inseridos como input do indicador, representado pela fórmula: Y = aX + b + R Onde Y é o valor do ativo dependente, X é o valor do ativo independente, a é a inclinação da reta entre os dois ativos, b é a intersecção da reta e R é o resíduo. O resíduo representa a quantidade da variabilidade que Y que o modelo ajustado não consegue explicar. E
FREE

Indicador Regressão Linear – Par de Ativos Indicador é um oscilador que faz o plot do Resíduo resultado da regressão linear entre os dois ativos inseridos como input do indicador, representado pela fórmula: Y = aX + b + R Onde Y é o valor do ativo dependente, X é o valor do ativo independente, a é a inclinação da reta entre os dois ativos, b é a intersecção da reta e R é o resíduo. O resíduo representa a quantidade da variabilidade que Y que o modelo ajustado não consegue explicar. E os resíduos
FREE

The diamond top and bottom are reversal patterns. It represents a rally to a new high with a drop to a support level followed by a rally to make a new high and a quick decline, breaking the support level to make a higher low. The bounce from the higher low is then followed by a rally, but making a lower high instead. Once this behavior is identified, prices then break the trend line connecting the first and second lows and start to decline further. You can find MT4 version hier
Indicator shows
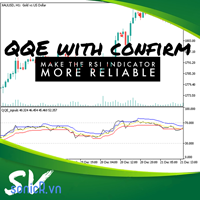
New QQE with confirm The relative strength index (RSI) is a technical indicator of momentum that measures the speed and change of price on a scale of 0 to 100, typically over the past 14 periods. Cause RSI measures the speed and change of price, trader normally use this indicator in two way: + Buy when oversold, sell when overbougth. + buy or sell when identifying divergence from rsi with price. In two way, it wrong when rsi in overbouth (for example) for long time or divergence. Even price ju

The problem with trading candlestick patterns becomes obvious, after some experience in live markets. Hypothetical branching of candlestick patterns, are not necessary for successful trading. As a Price action trader, my principle is to keep things simple and consistent. My focus is on buying and selling pressure, which is visible in market structure. Trade Management and discipline are my secondary core elements. This indicator detect 4 Simple but Effective Price action Patterns! Yellow = Insi
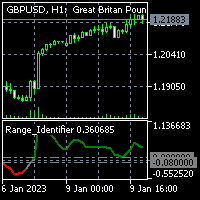
To get access to MT4 version please click here . - This is the exact conversion from TradingView: "Range Identifier" By "Mango2Juice". - All twelve averaging options are available: EMA, DEMA, TEMA, WMA, VWMA, SMA, SMMA, RMA, HMA, LSMA, Kijun, McGinley - This is a light-load processing and non-repaint indicator. - Buffer is available for the main line on chart and not for thresholds. - You can message in private chat for further changes you need.

This indicator labels swing highs and swing lows as well as the candle pattern that occurred at that precise point. The indicator can detect the following 6 candle patterns: hammer , inverse hammer , bullish engulfing , hanging man , shooting star and bearish engulfing .
The notations HH, HL, LH, and LL you can see on the labels are defined as follows:
HH : Higher high
HL : Higher low
LH : Lower high
LL : Lower low
Setting
Length: Sensitivity of the swing high/low detection,
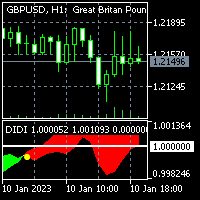
To get access to MT4 version please click here . - This is the exact conversion from TradingView: "Didi Index" by " everget ". - This is a popular version of DIDI index on tradingview. - This is a light-load processing and non-repaint indicator. - Buffer is available for the lines on chart and arrows on chart. - You can message in private chat for further changes you need. Thanks for downloading

Lets dabble a bit into Elliot Waves.
This is a simple indicator which tries to identify Wave 1 and 2 of Elliot Impulese Wave and then projects for Wave 3.
Ratios are taken from below link: https://elliottwave-forecast.com/elliott-wave-theory/ - Section 3.1 Impulse
Wave 2 is 50%, 61.8%, 76.4%, or 85.4% of wave 1 - used for identifying the pattern. Wave 3 is 161.8%, 200%, 261.8%, or 323.6% of wave 1-2 - used for setting the targets
Important input parameters
MaximumNumBars : To calculate

The Accumulation / Distribution is an indicator which was essentially designed to measure underlying supply and demand. It accomplishes this by trying to determine whether traders are actually accumulating (buying) or distributing (selling). This indicator should be more accurate than other default MT5 AD indicator for measuring buy/sell pressure by volume, identifying trend change through divergence and calculating Accumulation/Distribution (A/D) level. Application: - Buy/sell pressure: above

The Trend Snatcher is a multi-timeframe indicator that detects swings on the price market chart. Important levels, such as Supply and Demand levels, Trendline touches, reversal patterns, and others, can also be added as confluence when making trading decisions.
The indicator employs two lines that aim for the highest selling and lowest buying levels. When the two lines cross, a signal is generated.
All trading instruments are compatible, including currency pairs, synthetic indices, metals, c

## Профессионально работать с WAPV Full и иметь возможность отслеживать где деньги крупных игроков Представьте, что у вас в руках инструмент, который самостоятельно выполняет чтение основных Игроков рынка с указанием лучших торговых регионов на основе анализа цены и объема. WAPV Full — это законченный инструмент, на 100 % ориентированный на операционную деятельность Р. Вайкоффа. В дополнение к отображению рыночных движений в торговых волнах, он также отображает рынок, читая цену и объем. Профес

Fair Value Gap (FVG) Indicator Overview The Fair Value Gap (FVG) Indicator identifies inefficiencies in price action where an imbalance occurs due to aggressive buying or selling. These gaps are often created by institutional traders and smart money, leaving areas where price may later return to "fill" the imbalance before continuing its trend. Related Indicators & Tools: For MT5: Fair Value Gaps with Order Block Detector
Simple ICT Concepts Simple Smart Money Concepts
For MT4: Fair Value Gap
FREE

The volatility scanner indicator is a tool that helps traders identify and analyze volatility in all the market timeframes for the current chart. This way you can find potentially profitable trades on every timeframe for the current symbol.
What It Does? Scan all timeframes to find a volatility contraction. Color the button yellow if there is a volatility squeeze at that timeframe. Clicking on the button instantly changes timeframe.
How To Use It? Just put it on the chart and click on the yel

Better Period Separators For MetaTrader 5 The built-in period separators feature doesn’t allow users to specify the time period, so you can use this indicator to create more customizable period separators. On intraday charts, you could place period separators at a specific time, you could also place extra period separators at a specific time on Monday to mark the start of a week. On higher timeframe charts, this indicator works the same as the built-in period separators, On the daily chart, per
FREE
This is an indicator meant to catch trends as they are coming from a retracement .it can be used for any symbol . We can use this indicator to catch spikes or sculp for Boom , Crash ,Range Break . it offers a sell signal and buy signal and an exit signal which can also be used to enter price reversal if you see fit the indicator has a higher time frame filter system which can go up to 2 levels of time filtering which will give you more accurate signals based on the trend ,this feature can be tur
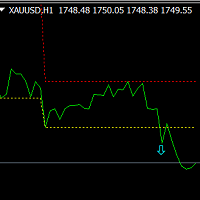
This is an MT4 indicator based on fluctuation statistics, which mainly includes two parts: one is display the fluctuation area, and the other is to display the signal at the same time if there is a signal generated.
Its main principle is to conduct data statistics based on the specified extreme value fluctuation radius, and draw the fluctuation area. If the breakthrough area is displayed, the signal in the same direction will be displayed. Advantage:
Suitable for all breeds. Applies to all cy

Percentile of Historical Volatility and Correlation Coefficient shows if the asset is cheap or expensive based on the volatility. It is used to determine a good entry point. It has two indicators built in: Historical Volatility is ranked percentile wise and its correlation to price action which gives an indication of the direction of a possible future move. Together the both indicators can give good entries and direction. Historical Volatility is a statistical measure of the dispersion of retu

Indicator for fast navigation through financial instruments. When you click on the button, you go to the chart of the financial instrument, the name of which was written on the button. In other words, the indicator opens or unfolds an existing chart window. For each chart, you can customize the name of the financial instrument, text color and background color; in total, you can customize symbols buttons that you trade often. The indicator can be installed on any charts for which you need to swit
FREE

Winner Oscillator. As it is called, it is an oscillator that consists of a heikin ashi candlestick strategy + an oscillator programmed to grab perfect rebounds as it looks good in the photo It is used for scalping and intraday. It works for all seasons! and also for all forex pairs and synthetic indices It works very well also in volatility, jumps, crash and boom!

Ice Up. It is an indicator where it fulfills the professional function of a zigzag together with support and resistance. Perfect for grabbing long and short trends. In the new version of Ice, it improves the pivots to %100. works for all seasons It works for forex and synthetic indices, and if the broker also has crypto. works for all forex pairs and synthetic indices.
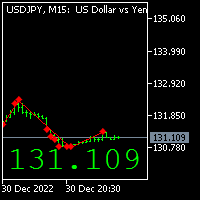
Market Price It has the indicator where it marks the current price where it is used to better visualize the price and according to the lime color, gray. magenta . where the lime marks the current price, gray brand without price change magenta marks the price ruling. works for all seasons for Forex and synthetic indices. All forex pairs and all synthetic index pairs.

Dragon Bolling. is an indicator programmed as enhanced bollinger bands It has an up, medium and down, to grab long cut and short, special for scalping works in all seasons in the forex markets and synthetic indices, in forex all the pairs in synthetic indices all pairs, but also designed to operate volatility and jumps! in m1 . m5 and m15, scalping to sign in h1 and h4 for lengths!

Ticks Candles Chart индикатор для построения еквиобъемных графиков для стратегии Оракул Для удобства выполнен в виде индикатора Период в тиках задается непосредственно на графике Тиковый график является отдельным окном Рекомендуется использовать периоды тиков от 50 и выше Работает только в реальном времени
Входные параметры Ticks_In_Bar - период в тиках по-умолчанию Counting_Bars - сколько бар тиковой истории строить (примерно) Custom_Symbol_Suffix - дополнительный суффикс для символа

ZigZag Ruby , Indicator 1 of 5 The ruby zigzag consists of a pivot strategy where he finishes giving a signal, the next pivot is easily grabbed, as seen in the photo It is used to hunt long trends in h1, h4 and d1 timeframes, ideal for scalping, works for forex markets, all pairs! works for synthetic index markets! all pairs ideal for volatilitys , jumps , crash y boom

Macd Ruby , ruby pack flag 2 It has the strategy of the crossing of moving averages, where is the first cross for the rise or for the downside, get into position It serves to catch long trends also in other temporalities, and to scalp at low times, works for forex markets all pairs It works for the synthetic indices markets all pairs! works great on volatility and jumps!

Trend Ruby, indicator 3 of the ruby pack. trend ruby has the strategy of breaking the structure or trend line How well do the lines mark and gives you the signal of breaking or following the trend? and bounce! works for any temporality, It is used for scalping and also intraday It works for the forex markets all the pairs, also for synthetic indices all pairs ideal for volatility and jumps! also crash and boom!

Channel Zone indicator 4 of the ruby pack channel zone has the strategy where the channel channel breaks for the green color gives a short signal where it breaks for the red channel gives a long signal, It is very simple and easy to use. ideal for holding long tendencies as seen in the photo ideal for intraday works for forex markets all pairs for synthetic index markets all pairs! and for all time periods.

Fibo Ruby indicator 5/5 pack ruby fibo ruby has the strategy of a programmed fibonacci to capture the bullish trend as bass player ideal for grabbing rebounds at the points of 23.6, 38.2, 50.0 and 61.8 It adapts to any temporality, be it for scalping or intraday. works for forex markets, all pairs It is used for synthetic index markets, all pairs great for boom and crash!
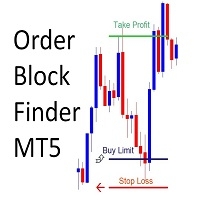
Order Block Finder
Sends Alerts – On MT5 To Your Phone To Your Email
Does not repaint .
Works on any Forex pair, any timeframe.
10 Activations allowed so you are free from limitations >> MT4 Version Here Spreads from 0.1pip RAW/ECN Accounts, click here . Check out my Waka Esque EA signal here: >> High Risk Settings or Medium Risk Settings .
What Is An Order Block? An Order Block (or Banker Candle, or Institutional Candle) is an opportunity to get very high risk to reward trades (o

The indicator ‘Probability Range Bands’ gives a prediction of the amount, how much the asset is moving from its current price. The range bands give probabilities, that the candle close will not exceed this certain price level. It is also called the expected move for the current candle close. This Indicator is based on statistical methods, probabilities and volatility. Asset price is assumed to follow a log-normal distribution. Therefore, log returns are used in this indicator to determine the

Black Card Pack indicators. Bars Black indicator 5/5 of the pack It has a strategy of breaking bars as the indicator is called, It is very easy to use, although you can see it in the photo when you break the ema bars down to get into position up is the same! It works for all temporalities, it is used to hunt big trends and scalp suitable for forex and synthetic indices works on all pairs of both!
Pack Black Card, Indicator 5/4 Channel black, It is an indicator that has the strategy of grabbing pivots on an already programmed channel. as seen in the photo is perfect for scalping taking it in timeframes of m30, m15, m5 and m1 to grab profit rebounds. Although it works for all temporalities, it is designed to make short films, works for forex markets and synthetic indices all the pairs are able to operate!

Black Card Pack indicator 5/3 Green power It has the high and low breakout strategy giving the signal with the red or green dot the red dot for short and the green dot for long , perfect for forex markets and synthetic index markets, works for all seasons It is used for scalping and intraday! Ideal for Crash and boom markets!! Volatilitys y jumps !! Micro y macro en forex !

Black Card Pack Indicator 5/2 Macd Divergence Black It has the strategy of the cross of emas and the different lines as well seen in the photo! works for all seasons works for forex markets and synthetic index markets ideal for volatility 75, volatility 100, volatility 25 and volatility 50 pairs for all jumpers! for forex works on all pairs! eur/usd , usd/jpy , eur/aud etc !

Black Card Pack indicator 5/1 point black It has the strategy of professional bollingers where each arrow gives you a different entry signal. It is used to operate in m1 and in d1 It is used for scalping and intraday, modified for forex markets ! suitable for all pairs modified for synthetic index markets suitable for all pairs! Ideal for volatility and jumps!

Package Yacht indicator 3/3 Fibo Yacht, has the fibonacci strategy but better hunting the rebounds / pivots. As seen in the photo, setbacks can be calculated at any time, works very well for synthetic indices, and forex too! It is designed for volatility and jump pairs. also works on crash and boom! the indicator is placed and it is already operated! Wolrd inversor.

Package Yacht indicator 2/3 Oscillator yacht, has the strategy of breakouts with the oscillator in the levels, 1.05, 0.50, 0.00, 050 and 1.05 are 5 levels where the volume no longer gives in the period of 1.05 on the lower side, the red candle begins to form, rising ay gives long signal, where it verifies it with 3 yellow, green and red dots, the same is for short when it breaks the green level, and breaks the line changing color starts entry works for forex markets and synthetic indices all tem

Pack Dragon. indicator 3/3 Dragon machine, has the perfected support and resistance strategy, indicates the floors and ceilings with the naked eye can be seen, giving signal to each circle pink giving entry to the rise and the green circle gives entry to the low wing, where the support of the green and red lines helps. Works for synthetic indices and forex all pairs, ideal for operating crash and boom. !

Pack Dragon, Indicator 2/3 Legend Moving It has the barrier pass strategy as well seen in the photo, where there is a dot on the yellow line, when there is a downtrend, there are red dots when it falls giving perfect entries in short, the same when the market is bullish, it marks another navy blue line, where it gives perfect entries over the green dots for long , It is available for all seasons and for markets of Forex and synthetic indices !
Pack Dragon , Indicator 3/1, Dragon signal It has the strategy of an oscillator programmed to grab supports and resistances to take advantage of every candle in the market, and it gives you to take your time and a simple analysis it is simple where you mark the green dots at the bottom gives you input for long And when it does not mark anything, it is giving you a short warning! works for all seasons for forex markets and synthetic indices !

Long & Short Based on Cointegration Statistical and Quantitative Long-Short (Pair Trading) approach for long and short positions. Your CPU will always be safe and stable when using Multiple Linear Regression if you have a reliable indicator. Based on the results of this indicator, you can execute a long and short or a long and long/short and short trade between two separate assets. It can show you a Highly informative dashboard based on Cointegration Search you determine, with all statistical d

This indicator shows OutsideBars (OB) and InsideBars(IB) in the chart in candle form.
The colors of the candles can be set individually. Also different colors for bearish and bullish IBs or OBs are possible.
In addition, the color of the wicks or Outlines can also be set.
OutsideBars and InsideBars often show good zones for support or resistance. See the Screenshot for some examples.

This indicator shows external bars ("Aussenstäbe") in the chart in candle form.
The colors of the candles can be set individually.
Also different colors for bearish and bullish bars are possible.
In addition, the color of the wicks or outlines is also adjustable.
Outside bars are mentioned e.g. by Michael Voigt in the book "Das große Buch der Markttechnik".
All other candles are inner bars.

Menora (All In One) Indicator.
This is the advanced and premium indicator for the Magic Trend, a free indicator. It has 3 output signals driven by different market conditions. This indicator has a double function of working as an indicator and utility at the same time.
Specifications
1] 3 output signals a) Slow Moving Average with color change - The MA has a non-repaint color change, which makes it perfect for entry signals. b) Fast Moving Average (the original Magic Trend line) - Gives a
FREE
MetaTrader Маркет - единственный магазин, где можно скачать демоверсию торгового робота и подвергнуть его проверке и даже оптимизации на исторических данных.
Прочитайте описание и отзывы других покупателей на заинтересовавший вас продукт, скачайте его прямо в терминал и узнайте, как протестировать торгового робота перед покупкой. Только у нас вы можете получить представление о программе, не заплатив за неё.
Вы упускаете торговые возможности:
- Бесплатные приложения для трейдинга
- 8 000+ сигналов для копирования
- Экономические новости для анализа финансовых рынков
Регистрация
Вход
Если у вас нет учетной записи, зарегистрируйтесь
Для авторизации и пользования сайтом MQL5.com необходимо разрешить использование файлов Сookie.
Пожалуйста, включите в вашем браузере данную настройку, иначе вы не сможете авторизоваться.