Смотри обучающее видео по маркету на YouTube
Как купить торгового робота или индикатор
Запусти робота на
виртуальном хостинге
виртуальном хостинге
Протестируй индикатор/робота перед покупкой
Хочешь зарабатывать в Маркете?
Как подать продукт, чтобы его покупали
Новые технические индикаторы для MetaTrader 5 - 21

Simple ATR (Average True Range) Channel to find your Stop Loss and/or Take Profit. Indicator allows to draw a second multiplier if you need different values for SL and TP. Leave the second multiplier to 0 if not used.
Settings + Length
+ Smoothing
+ Multiplier #1 (default 1.5)
+ Multiplier #2 (set to 0 if not used)
+ High price
+ Low price
+ show price line
+ colors can be changed
Please leave wishes in the comments. Reviews are also welcome.
FREE
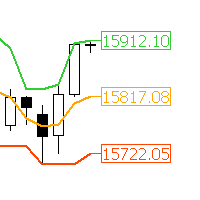
"AV Donchian Channel MT5" is an indicator for MetaTrader 5, which shows the current prices of the donchian channels and the middle line.
Multiple AV Donchian Channel indicators can be placed on one chart. The center line can be used for trailing.
See also Richard Dennis Turtle Trader strategy.
Settings:
- Donchian Channel Period
- Colors and widths of the lines
- Colors and widths of price labels
Please report bugs to me.

Considering the main theories of Forex (Dow Theory, support lines, chart patterns, and Fibonacci retracements), It tells you the price range where whales (large investors) are likely to appear. You can trade at the price points that professionals also aim for. You no longer have to warry about where to aim next.
We are live-streaming the actual operation of the system. Please check for yourself if it is usable. Please check it out for yourself. https://www.youtube.com/@ganesha_forex
We do n

This Indicator is based on Mr. Dan Valcu ideas.
Bodies of candles(open-close) are the main component used to indicate and assess trend direction, strength, and reversals.
The indicator measures difference between Heikin Ashi close and open.
Measuring the height of candle bodies leads to extreme values that point to trend slowdowns. Thus quantifies Heikin Ashi to get earlier signals.
I used this indicator on Heiken Ashi charts but, it's possible to choose to calculate Body size based on
FREE

A pivot point is an intraday technical indicator used to identify trends and reversals mainly in equities, commodities, and forex markets . Pivot points are calculated to determine levels in which the sentiment of the market could change from bullish to bearish, and vice-versa.
the swing daily is an advanced pivot points indicator that grants the user control over many aspects of the trading levels that you'll get familiar with in the controls section it's used mainly to locate intraday

Imbalance / FVG MTF Mark Imbalance on chart of Selected Multi Time frames. Trend is Manually set to filter signals in the chosen direction by a button on the chart. .
Futures Auto Mark Imbalance / FVG on chart on selected time frames
Select time frames by buttons on chart
Popup Alert, Push Notification or email when New Imbalance Form
Popup Alert, Push Notification or email when Imbalance is Taken out
Select Alert Mode to be a single or multiple Imbalance ( OR / AND option ) when Imbalan
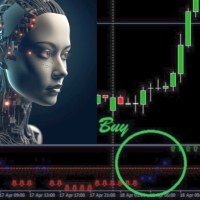
Introducing Trend Fusion 444F, a powerful MQL4 indicator designed to determine market direction using multiple trading indicators. This comprehensive tool offers a unique fusion of technical analysis techniques that help traders make informed decisions in various market conditions. Key Features: Comprehensive Analysis: Trend Fusion 444F combines several widely-used trading indicators to provide a multi-dimensional view of the market. The indicators include Moving Averages, MACD, RSI, DeMarker,

INTRODUCTION The Fib Autotrendline is a basic tool that analysts use to find out when a security's trend is reversing. By determining the support and resistance areas , it helps to identify significant changes in price while filtering out short-term fluctuations, thus eliminating the noise of everyday market conditions. It is an excellent tool for any trader who follows indicators that use swing highs and swing lows . How to Use the fib Auto Trendline Indicator The Fib Auto Trendline
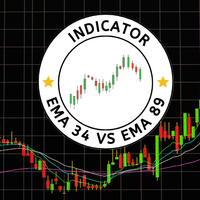
Индикатор "EMA43 vs EMA89" является мощным инструментом для трейдеров, которые ищут возможности для выявления разворотов тренда и потенциальных сделок. Этот индикатор отображает два скользящих средних, EMA34 и EMA89, на графике. Когда эти скользящие средние пересекаются, генерируется сигнал на покупку или продажу, указывая на потенциальное изменение направления тренда. Особенности: Прост в использовании: Просто добавьте индикатор на свой график и начните получать сигналы, когда EMA34 и EMA89 пер

Versus USD рассчитывает изменение цены каждой основной валюты по отношению к доллару США и отображает ясное и сравнительное представление их производительности для каждого периода или бара, индексируемого курсором в текущем временном интервале диаграммы с полосами прогресса. Кроме того, он помечает стрелкой бар/период, где данная валюта испытала наибольшее или наименьшее изменение курса по сравнению с другими валютами, тем самым обеспечивая более точную оценку производительности валюты. Доллар С

Это индикатор торговых сессий который может отображать все уровни ( Open-High-Low-Close ) для четырех сессий. Сессии могут быть нарисованы линиями или с заливкой как свечи, линии могут быть продлены до следующей сессии. Вы можете легко скрывать/показывать каждую сессию нажатием на горячие клавиши. Также вы можете видеть ASR (средний диапазон сессий) (горячая клавиша по умолчанию «A»). Это похоже на расчет ADR, только он рассчитывается на основе последних X-сессий, что позволяет увидеть пот
Введение BreakOut Consult, революционного инструмента, который поднимет ваше торговое мастерство на новый уровень! Наш современный алгоритм комбинирует несколько трендов и осцилляторов для генерации точных сигналов на покупку и продажу, что делает его мощным инструментом для любого трейдера. С BreakOut Consult вы можете легко выявить прорывы на рынке с помощью нашего динамического канала, который использует уровни сопротивления и поддержки для обнаружения прорывов. Наш алгоритм обнаруживает два

"Настроения трейдеров" на финансовых рынках это тема, которая нас давно интересует. Со временем мы не смогли найти правильную формулу для определения этих настроения. Мы прошли много этапов в поисках нужной методологии - от взятия данных из внешних источников для расчета открытых позиций покупателей и продавцов до расчета тиковых объемов, но все равно нас не удовлетворили результаты. Расчет открытых позиций покупателей и продавцов из внешних источников имел несколько проблем - это была выборка з

Повысьте свой опыт торговли с Wamek Trend Consult!
Разблокируйте силу точного входа на рынок с нашим передовым торговым инструментом, разработанным для выявления ранних и продолжающихся трендов. Wamek Trend Consult дает трейдерам возможность войти на рынок в идеальный момент, используя мощные фильтры, которые уменьшают ложные сигналы, повышают точность сделок и, в конечном итоге, увеличивают прибыльность.
Основные характеристики: 1. Точная идентификация тренда: Индикатор Trend Consult испол

The HighsAndLowsPro indicator for MetaTrader 5 marks local highs and lows in the chart. It distinguishes between weak and strong highs and lows. The line thicknesses and colours can be individually adjusted. In the default setting, the weak highs and lows are displayed thinner, the strong ones thicker. Weak highs and lows have 3 candles in front of and behind them whose highs are lower and lows are higher. The strong highs and lows have 5 candles each.
FREE

[ MT4 Version ] [ Order Blocks ] [ Kill Zones ] [ SMT Divergences ] How to trade using Order Blocks : Click here User Interface Performance: During testing in the strategy tester, the UI may experience lag. Rest assured, this issue is specific to the testing environment and does not affect the indicator's performance in live trading. Elevate your trading strategy with the Order Blocks ICT Multi TF indicator, a cutting-edge tool designed to enhance your trading decisions through advanced o

The ICT Concepts indicator regroups core concepts highlighted by trader and educator "The Inner Circle Trader" (ICT) into an all-in-one toolkit. Features include Market Structure (MSS & BOS), Order Blocks, Imbalances, Buyside/Sellside Liquidity, Displacements, ICT Killzones, and New Week/Day Opening Gaps. It’s one kind of Smart money concepts. USAGE: Please read this document ! DETAILS Market Structure Market structure labels are constructed from price breaking a prior extreme point. T

Introducing our A.I Currency Strength Meter Forex Indicator, a state-of-the-art tool designed to provide forex traders with real-time insights into the strength of various currencies. Leveraging the latest advancements in artificial intelligence and machine learning, this innovative indicator analyzes market data in real-time, providing users with accurate and up-to-date information to inform their trading decisions. In addition to its cutting-edge algorithms, the Currency Strength Meter For
Интеллектуальный индикатор ZigZag. Имеет всего две настройки. Чем выше значения, тем более значимые экстремальные значения показывает. Область применения. Для определения тренда. Направление рисования линии. Для распознавания многочисленных паттернов. Если наложить два индикатора на один график с быстрыми и медленными значениями. Изменив цвет одного из них, то очень хорошо можно разложить движение цены на волны. Индикатор может оказаться отличным помощником для разметки графика и обозначения к
Add an image or logo on a chart. Parameters: "File name for On mode" - location of image file depending MQL5 folder. "Background object" - set the logo as a background object. “x”, “y” – coordinates on the chart, from which the logo shows. If you want to delete the logo, just remove ea from the chart. The suggested resolution for the image is 200x200 pixels. You can use this ea while recording a video.
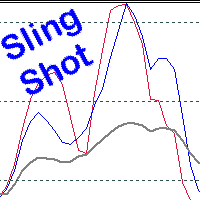
Scalping, Mean reversion or Position trading strategy
Get into an established trend on a pullback in the market. Use the Pinch in the indicator for profit taking. Use the Pinch as a mean reversion strategy, scalping back to a moving average line.
Input Parameters Fast Sling Shot configuration. Slow Sling Shot configuration. Dual Sling Shot configuration. Price line configuration. Trigger zones or levels. Example of Sling Shot trade idea: Price line sets the mood, below the baseline level (5

HighQualityMap是一个很好的中长线交易指示器,这个指标可以单独使用,尤其是用在M30或者大于M30的时间框架下,它能很好的体现出趋势的走向,以及转折点,你可以很快的从这个指示器上寻找到最佳的buy和sell位置,同时也能很好根据指示器去坚守自己的持仓定订单。指标不含有未来函数,不会重新绘制,不仅能够应用到自己的手动交易过程中,还能完全可以写入到自己的EA中。(如果你感觉到这个指标能够帮助你进行更准确的交易,请帮忙给个好评,希望我的作品能够帮助更多有需要的人) ===================参数列表===================== 所有参数均采用默认参数即可,无需更改,若为激进型交易者,可以根据自己的需要来调整参数。 =================参考使用方法=================== 此指标可以适用于任何交易品种,使用周期框架大于M30相对更准确。
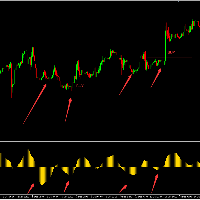
SQZ uses an adaptive algorithm, which can adjust itself well according to the market. If you have studied the introductory model of machine learning, you should understand the linear regression model, which can predict short-term trends very well. Of course, this is only a part of the SQZ indicator. This is an indicator for understanding short-term trend reversals and works very well for tracking triggers. When the price shows HigherHigh and the indicator shows LowerHigh, there is a structural b

Slopes are an increasingly key concept in Technical Analysis. The most basic type is to calculate them on the prices, but also on technical indicators such as moving averages and the RSI.
In technical analysis, you generally use the RSI to detect imminent reversal moves within a range. In the case of the Blue indicator, we are calculating the slope of the market price and then calculating the RSI of that slope in order to detect instances of reversal.
The Blue indicator is therefore used

If you are using naked eyes to find candlestick patterns on your chart it's a good thing but it requires your time and attention and still you miss some patterns here and there. Don't worry! This indicator will help you to find "Harami Candlestick Pattern" on your chart very easily. *Note: Default inputs are set for EURUSD H1 (1 hour) timeframe. This is an alert system which gives you alerts whenever harami candlestick pattern happens. Types of alerts it can give you are: 1. Audible Alerts - Thi

Super Scalp Indicator MT5 is a unique trend reversal 100% non-repainting multi-algo indicator that can be used on all symbols/instruments: forex, commodities, cryptocurrencies, indices, stocks . Super Scalp Indicator MT5 will determine the current trend at its early stages, gathering information and data from up to 10 standard algos When indicator give a valid buy or sell signal, a corresponding arrow will be printed on the chart, open trade at start of the next candle/bar indic

Scalper Pivot detects respectable small reversal areas that can be used to mark repeatable opportunity windows. Originally made for M1 timeframe. Setup/inputs: First, set one pip on price, e.g. EURUSD to 0.0001, USDJPY to 0.01, or XAUUSD to 0.1. Set minimum and maximum range on pips, if you want scalp between 10 to 20 pips then set it to 10 and 20 respectively. Set detection window to any candle count you want. Set it too low or too high would be less accurate.

Это четкий индикатор для оценки максимумов и минимумов, и он хорошо работает для колеблющегося рынка.
Акционная цена 49$ → 59$
функции хорошо оценивает верх и низ Без перерисовки, без дрейфа Быстрый расчет, без задержек Богатый режим напоминания Можно настроить несколько параметров и цветов
параметр "======== Главная ========" HighLowPeriod1 = 9 HighLowPeriod2 = 60 HighLowPeriod3 = 34 HighLowEMAPeriod = 4 MASignalPeriod = 5 "======== Уведомить ========" UseAlertNotify = истина; UseMetaQuo

"Индикатор "BIG FIGURE INDICATOR" автоматически идентифицирует и рисует горизонтальные линии на графиках цен на определенных уровнях, таких как целые числа или половинные числа (например, 1,0000 или 1,5000 в валютной торговле). Эти уровни считаются психологически значимыми, поскольку они представляют собой округленные цифры, на которые могут сосредоточиться крупные трейдеры и инвесторы, что может привести к потенциальным уровням поддержки или сопротивления. Этот индикатор может помочь трейдерам
FREE
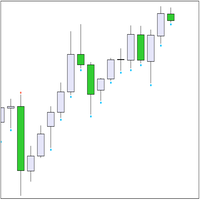
The trend indicator "Trend Two Moving Average" uses two types of Arrow to display calculation results - these are "Trend UP" and "Trend DN". Arrows "Trend Up" are drawn By price 'Low' bar , A Arrows "Trend DN" - By price 'high'. The trend search algorithm is based on the analysis of the price of a bar and the values of two 'Moving Average' indicators. The trend direction is calculated on the current (zero) bar. Therefore, it is

Представляем RSIScalperPro - революционный индикатор на основе RSI для MetaTrader 5, специально разработанный для скальпинга на графике одной минуты. С RSIScalperPro у вас будет мощный инструментарий для точных сигналов входа и выхода, чтобы повысить вашу торговую эффективность. RSIScalperPro использует два различных индикатора RSI, которые предоставляют четкие сигналы для уровней перекупленности и перепроданности. Вы можете настроить временные периоды и ограничительные значения двух RSI в соот

User Support
Paid subscribers may request to join the WTGS Workshop @DB_WTI after emailing your Twitter handle and the proof of subscription to wtg.system.international@gmail.com . The System WTGS Navigator Overlay consists of two components: Dynamic Butterfly Footprints Overlay Disclaimers Although every effort has been made when designing WTGS Navigator Overlay, WTG makes no warranties, expressed or implied, or representations as to the accuracy or profitability of the system. WTG assume

The Nadaraya Watson Envelop indicator for MT5 is a popular tool used by traders to identify trends and potential buy/sell signals. The indicator is based on a non-parametric regression model that uses kernel smoothing to estimate the underlying trend of the market. The resulting envelopes are then plotted around the trend line, providing traders with an indication of where prices are likely to fluctuate. One of the key features of this indicator is its ability to send alerts, emails, and notific

Horizontal tick volumes (HTV)
Горизонтальные тиковые объемы - легкий и удобный индикатор горизонтального профиля рынка в выбранном пользователем интервале времени, теперь и для MT5.
Имеет быструю динамику отображения горизонтальных тиковых объемов на графике. Производит наглядное изображение сильных торговых уровней по максимальным пикам
прошедших объемов и направления торговли по цвету (продажи или покупки), а также позволяет обнаружить более мелкие торговые уровни с помощью дифференциац

A heatmap is a graphical representation of data in two dimensions, using colors to display different factors. Heatmaps are a helpful visual aid for viewers, enabling the quick dissemination of statistical or data-driven information. The MP Heatmap indicator provides a graphical representation of the relative strengths of major currencies compared to others, organizing data from pairs into color-coded results and producing a clear overview of the entire Forex market. The MP Heatmap indicator dis
FREE

Индикатор ICT Implied Fair Value Gap (IFVG) является важной составляющей частью системы Smart Money Concepts (SMC). Он ищет и показывает на графике современный паттерн - Разрыв справедливой стоимости ( FVG ). Этот паттерн представляет собой формирование дисбаланса трех свечей, которое основано на обнаружении несоответствия между спросом и предложением. Так получается, когда цена быстро движется в одном направлении, не встречая сопротивления. В результате образуется разрыв, "гэп", который может б

This Indicator is based on the Indice gaps between todays open price and yesturdays closing price. On Metatrader these are not shown as we only see a 24hr chart. If we want to know the gap between the open at 16:30 and yesturdays close at 23:30 on the SP500 this EA will reveal the gap. On Indices these types of Gap close approximately 60% of the time within the same day and is demonstrated on the panel which records previous gap closures and provides to the user a statistical proof of gaps clos
Please send me Direct message on MQL5 CHAT after purchasing the Indicator for Training and Installation Support There are some additional files that is important to use with the Indicator . So be sure to contact me after purchasing the Indicator So that I can add you for training and support .
If you find any difficulty with installation then send me Direct message here So that I can connect with you via Anydesk or Teamview for the product installation. " Smart Order Block Indicator " to find

You can change the time period of the chart at the touch of a button. You can also change multiple charts at the touch of a button. You can also change multiple charts at the touch of a button, saving you the trouble of changing time periods.
We are live-streaming the actual operation of the system. Please check for yourself if it is usable. Please check it out for yourself. https://www.youtube.com/@ganesha_forex
We do not guarantee your investment results. Investments should be made at y

AutoScroll automatically scrolls the chart by the set width (pips). You can see the next milestone without having to operate the chart yourself. You can concentrate on trading.
We are live-streaming the actual operation of the system. Please check for yourself if it is usable. Please check it out for yourself. https://www.youtube.com/@ganesha_forex
We do not guarantee your investment results. Investments should be made at your own risk. We sharll not be liable for any disadvantage or damage

The time until the end of the bar is counted down. Therefore, you can time your order while watching the chart. You can concentrate on your trading.
We are live-streaming the actual operation of the system. Please check for yourself if it is usable. Please check it out for yourself. https://www.youtube.com/@ganesha_forex
We do not guarantee your investment results. Investments should be made at your own risk. We sharll not be liable for any disadvantage or damage caused by the use of the in

Fibonacci automatically draws Fibonacci retracement, Because Fibonacci automatically draws Fibonacci retracement, you can know at a glance the price to buy at a push or sell back. Therefore, you can trade in favorable conditions in a trending market.
We are live-streaming the actual operation of the system. Please check for yourself if it is usable. Please check it out for yourself. https://www.youtube.com/@ganesha_forex
We do not guarantee your investment results. Investments should be mad

The chart pattern is automatically drawn. It also automatically tells you the price at which you are most likely to buy or sell according to the pattern. Therefore, there is no need to memorize patterns or draw lines by yourself.
* The "WhaleFinder" includes four indicators ("DrawTurningPoint", "DrawHurdle", "DrawChartPattern", "DrawFibonacci"). so, Please be careful not to purchase more than one copy (duplicates).
We are live-streaming the actual operation of the system. Please check for

The system automatically draws resistance and support lines, The system automatically draws resistance and support lines, so you can see at a glance the price range where you are most likely to encounter resistance. Therefore, you can trade in price zones where you are less likely to encounter resistance.
We are live-streaming the actual operation of the system. Please check for yourself if it is usable. Please check it out for yourself. https://www.youtube.com/@ganesha_forex
We do not guar

Based on the Dow Theory, the system automatically draws a turning point, which is the starting point for buying or selling. It also automatically tells you whether the market is in a buying or selling condition and recognizes the environment. It is also a good tool to prevent false trades and to make profitable trades.
We are live-streaming the actual operation of the system. Please check for yourself if it is usable. Please check it out for yourself. https://www.youtube.com/@ganesha_forex

The TrendLinePro indicator for MetaTrader 5 creates a trend line based on the last candle highs and lows. The number of candles to be used to determine the direction can be selected yourself. The trend line can also be used to set an SL. Changes in trend directions can optionally be displayed with an arrow. Input Parameters: Number of Candles for Distance: 3 Display Direction Changes Arrows: false

An indicator based on support and resistance levels with many signals (per candle) Can be used in all time frames Can be used in all symbol Blue lines: upward trend. Red lines: downward trend
How It work: This indicator gives signals based on support and resistance levels as well as some complex calculations. Based on past data
As you know, one of the most important trade options are support and resistance levels.
Get good signals using this indicator.
How To work: Run the indicator.
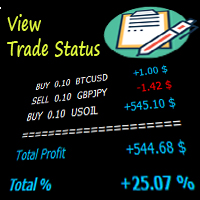
This indicator will help you have a better visualization of the status of your open trades. You can see profits or losses in USD or %, as well as a total of all trades and the percentage of profit or loss according to your account size. You can change the font size and color. I hope you find it useful and it makes monitoring your trades easier. This indicator adjusts to the size of your screen and will be positioned in the bottom right corner of your screen for better convenience.

BestPointOfInitiation是一个很好的短线交易指示器,能与 ShortBS ( https://www.mql5.com/zh/market/product/96796 )完美的配合,可以很好的指出最佳的buy和sell位置,指标不含有未来函数,不会重新绘制,不仅能够应用到自己的手动交易过程中,还能完全可以写入到自己的EA中。(如果你感觉到这个指标能够帮助你进行更准确的交易,请帮忙给个好评,希望我的作品能够帮助更多多有需要的人) ===================参数列表===================== fastPeriod: 9 slowPeriod:30 PassivationCoefficient:5 =================参考使用方法=================== 此指标可以适用于任何交易品种,能够用在任何周期。

Displays symbol tabs for easy access when trading, symbols that are coloured are symbols you have trades running on.
The indicator immediately shows the specified currency pair in the open window after clicking it. You no longer need to open a new window to view each chart thanks to the indicator. Additionally, it enables traders to concentrate on their trading approach by just keeping a small number of charts displayed.
FREE

Indicator details The Moving Average Retracement Boundaries(M.A.R.B) shows the average retracement level above or below the given moving average.It shows the first upper boundary (which is the average retracement above the moving average ),the second upper boundary (which is double the first upper boundary),the first lower boundary (which is the average retracement below the moving average) and the second lower boundary (which is double the first lower boundary).
How to use it 1.It can be used
FREE

it depends on ATR period to get swing points to help make better trading decisions blue dot and red dot is the default color scheme of course you can change it later if you'd like you can change the following : ATR PERIOD sending notifications number of times to send notifications sending notifications to your smart phone that's it very simple to use just drag and drop and follow the trend

it depends on channels and moving average in sketching the chart in two colors the default colors are gold and light blue to highlight the area of downtrend and the area of uptrend TO ADJUST THE INDICATOR YOU CAN CHNGE THE FOLLOWING: 1- the look back period which affects the length of the moving average 2- the multiplier which affects the point of swing in the trend 3- the channel shift which affects how close the line is moving to the price the default settings are the best for the indicator B
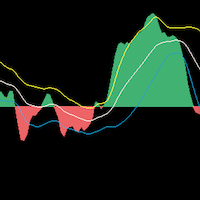
TradingDirection是一个针对中长线交易的趋势指标。在图上你能很清晰的看到什么时候是上涨趋势,什么时候是下跌趋势,同时在趋势中,你能看到很明显的补仓位置和减仓位置。同时它与 BestPointOfInitiation( https://www.mql5.com/zh/market/product/96671 )指标可以形成完美的配合,两个指标相互配合更能很好的把握开单时机。 ===================参数列表===================== fastPeriod: 9 slowPeriod:30 PassivationCoefficient:5 =================参考使用方法=================== 此指标可以适用于任何交易品种,能够用在任何周期。
This is a modern MACD indicator based on regular MACD indicator. It also has alert system included. This indicator gives you alerts when base line of MACD indicator crosses above or below Zero level so you can look for Buy or Sell opportunity. Available Alerts: 1. Audible Alerts on Chart / Trading Terminal window. 2. Alerts on your email. 3. Alerts on your mobile phone. Type of Alerts Explained: 1. Audible_Chart_Alerts - Audible alerts and Popup message on your computer’s tr

ShortBS是一个很好的短线交易指示器,能很好与 BestPointOfInitiation ( https://www.mql5.com/zh/market/product/96671 )配合,能让你找到最合适的buy和sell位置,指标不含有未来函数,不会重新绘制。是一个针对(如果你感觉到这个指标能够帮助你进行更准确的交易,请帮忙给个好评,希望我的作品能够帮助更多有需要的人) ===================参数列表===================== maPeriod: 25 slowPeriod:20 fastPeriod:10 stepPeriod:5 =================参考使用方法=================== 此指标可以适用于任何交易品种,能够用在任何周期。
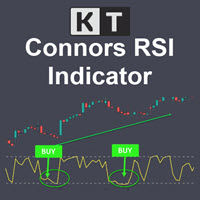
KT Connors RSI is a modified and more advanced version of the original Connors RSI developed by Larry Connors. It was designed to help traders generate trade signals based on short-term price movements.
The Connors combine the standard RSI calculation with two additional elements: a short-term RSI, ROC, and a moving average.
Features Provides more transparent and more actionable buy and sell signals using the overbought/oversold zones. Incorporates short-term RSI and moving average, provid

Добро пожаловать в индикатор Twin Peak MT5 --(Двойная вершина/ Двойная дно)-- Индикатор «Двойная вершина и дно» — это инструмент технического анализа, предназначенный для выявления потенциальных моделей разворота на рынке.
Он определяет области, где цена сделала два последовательных пика или впадины почти одинаковой высоты, за которыми последовало движение цены в противоположном направлении.
Этот паттерн указывает на то, что рынок теряет импульс и может быть готов к развороту тренда. *Свяж

Экономьте время и принимайте более точные решения с закрепленными VWAP Если вы хотите испытать мощь этого инструмента, вы можете скачать бесплатный индикатор закрепленных VWAP для MT5 . Помимо того, что этот индикатор работает независимо, он также является расширением для бесплатной версии Sweet VWAP. Это потому, что, когда вы кликаете на бесплатную версию, тот VWAP, который вы видите на указателе мыши, будет закреплен. И для лучшего понимания, тот, кто будет закреплен там, - это этот индикатор

Этот индикатор предназначен для определения времени наибольшей торговой активности внутри дня. После этого вычисления индикатор строит наиболее значимые торговые уровни. Сравнение этих уровней с реальным движением цены может дать информацию о силе и направлении рыночных тенденций.
Особенности работы индикатора Таймфрем должен быть ниже D1. Рекомендуемые таймфреймы: M15, M30 и H1. Таймфреймы выше H1 могут дать слишком грубую картину. А использование таймфремов ниже M15 может привести к появлен

Volatility Trend System - торговая система дающая сигналы для входов.
Система волатильности дает линейные и точечные сигналы в направлении тренда, а также сигналы выхода из него, без перерисовки и запаздываний.
Трендовый индикатор следит за направлением среднесрочной тенденции, показывает направление и ее изменение.
Сигнальный индикатор основан на изменении волатильности, показывает входы в рынок.
Индикатор снабжен несколькими типами оповещений.
Может применяться к различным торговым инс
ICT Template Indicator visualizes and automatically updates all important ICT elements for Scalpers, Day and Swing traders. It allows you too keep your chart clean and bring any elements by just one click to the buttons. Thanks to mobile notifications on external liquidity levels, you will not miss any opportunity and you don't have to sit behind the screens whole day. Each element has fully customizable colours, width, line types, max timeframe to be shown etc... so you can really tweak your ch

Мультивалютный и мультитаймфреймовый индикатор Heikin Ashi. Отображает текущее состояние рынка. На панели вы можете видеть направление, силу и количество баров текущего тренда. Также, с помощью цвета, отображаются свечи консолидации/разворота цены. В параметрах можете указать любые желаемые валюты и периоды. Также индикатор может отправлять уведомления при изменении тренда или появлении разворотных и прорывных свечей. По клику на ячейке будет открыт данный символ и период. Heikin-Ashi — японский

To get access to MT4 version please click here . This is the exact conversion from TradingView: "SwingArm ATR Trend Indicator" by " vsnfnd ". Also known as : "Blackflag FTS" by "Jose Azcarate" This is a light-load processing and non-repaint indicator. All input options are available except multi time frame. Buffers are available for processing in EAs. Extra option to show buy and sell signal alerts. You can message in private chat for further changes you need.

uGenesys AI - 90% Accurate Daytrading Indicator
Introducing the ultimate forex trading indicator system, uGenesys AI, powered by cutting-edge AI technology and advanced analytical techniques, including Time-Series Analysis and Genetic Algorithms. Our AI-powered trading system leverages the power of time-series analysis to identify trends and patterns in historical price data, allowing traders to make informed predictions about future market movements. By analyzing vast amounts of data, our sys

Introducing "Congestion Breakout MT5" - the indicator that helps you identify congestion zones in your chart and alerts you when the price breaks through them. Traders know that congestion zones can be key areas of price action and can indicate potential turning points in the market. However, spotting these zones and anticipating breakouts can be a difficult and time-consuming task. That's where "Congestion Breakout" comes in. This powerful indicator uses advanced algorithms to analyze the pri
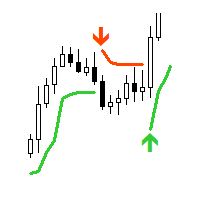
"AV SuperTrend MT5" is an indicator for MetaTrader 5. The supertrend indicator is popular for determining the trend and positioning stops or as trailing support. I use this indicator in several expert advisors for trend analysis.
Supertrend indicator signals can be selected in the form of entry arrows and notifications, as well as various sounds.
Settings:
- Period
- Multiplier
- Alert buy signal: arrow color
- Alert sell signal: arrow color
- Alert yes/no
- Sound: choice or no

The euro index (Euro Currency Index, EURX) is an average indicator of changes in the exchange rates of five currencies (US dollar, British pound, Japanese yen, Swiss franc and Swedish krona) against the euro. Displays a Eur X chart in a seperate window below the main chart. YOUR BROKER MUST HAVE THESE SYMBOLS FOR THE INDICATOR TO WORK Based on EUR/USD, EUR/JPY, EUR/GBP, EUR/CHF and EUR/SEK All these pairs must be added to Market Watch for the indicator to work correctly As this is calculated usi
FREE

Smart Tape - это индикатор ленты всех сделок с возможностью агрегации по цене и времени и фильтрацией по величине объема, включает в себя два отключаемых варианта отображения. Вариант 1: перемещаемое окно по графику со списком сделок (Time Sales). Список обновляется сверху вниз и не имеет возможности просмотра истории. Количество отображаемых строк выбирается пользователем. Порядок отображения в строке: время с точностью до миллисекунд, тип сделки (B - покупка или S - продажа
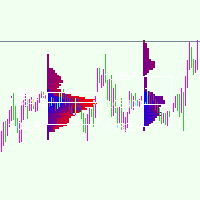
A Market Profile (time price opportunity) implementation with an option to mark a point of control (POC) based on volume .
Config: Hide default candles. Select a session time using exchange timezone. Experiment with tick multiplier value to achieve desired level of detail. Choose the symbols of your choice, e.g. squares or A-Z chars. For multiple sessions you will have to add additional instances of this script with a different time configuration.
Limitations: TradingView has a hard
MetaTrader Маркет предлагает каждому разработчику торговых программ простую и удобную площадку для их продажи.
Мы поможем вам с оформлением и подскажем, как подготовить описание продукта для Маркета. Все продаваемые через Маркет программы защищаются дополнительным шифрованием и могут запускаться только на компьютере покупателя. Незаконное копирование исключено.
Вы упускаете торговые возможности:
- Бесплатные приложения для трейдинга
- 8 000+ сигналов для копирования
- Экономические новости для анализа финансовых рынков
Регистрация
Вход
Если у вас нет учетной записи, зарегистрируйтесь
Для авторизации и пользования сайтом MQL5.com необходимо разрешить использование файлов Сookie.
Пожалуйста, включите в вашем браузере данную настройку, иначе вы не сможете авторизоваться.