Смотри обучающее видео по маркету на YouTube
Как купить торгового робота или индикатор
Запусти робота на
виртуальном хостинге
виртуальном хостинге
Протестируй индикатор/робота перед покупкой
Хочешь зарабатывать в Маркете?
Как подать продукт, чтобы его покупали
Технические индикаторы для MetaTrader 4 - 133

IRDeS (Индикатор Детекции Расстояния и Пиков) - это индикатор силы и расстояния от уровня нуля, который позволяет войти на рынок с практически идеальным таймингом. Он состоит из непрерывной синей линии, которая измеряет расстояние и волатильность от уровня нуля, а также из гистограммы, красной над уровнем нуля и зеленой под уровнем нуля, измеряющей интенсивность и силу торговли в определенной свече, создавая сильный импульс, "пик", в конкретной точке графика. IRDeS - ценный инструмент для технич

Provides instant signals on the chart in panel form. Equipped with signal description and trading analysis tools such as drawing auto trendlines, support/resistance area, regression channel, Fibonacci levels, Pivot levels and current signal price, signal time, signal expiry and stoploss recommendation. Also sending alert messages to all available mt4 alert tool. A detailed description panel provides information about where the signal comes from and what indicators are behind the signal. Includin

Martingale Arrow — это индикатор mt4 типа стрелки, предназначенный для торговли бинарными опционами по мартингейлу. Эта стрелка печатается на открытом/внутри баре и выдает предупреждение. КАК ИСПОЛЬЗОВАТЬ: откройте сделку, когда появится стрелка момента. Если сделка выиграла, дождитесь следующего сигнала и торгуйте тем же лотом. Если сделка теряет двойной лот по следующему сигналу и продолжаете делать это до тех пор, пока сигнал не выиграет, затем выполните сброс и торгуйте первым лотом. РЕКОМЕ
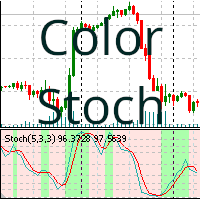
Индикатор стохастического осциллятора с цветом Этот индикатор окрашивает фон в соответствии с тенденцией индикатора. Индикатор окрашивает фон в соответствии со значением стохастического осциллятора, будь то бычий или медвежий тренд. Цвет фона определяется параметрами стохастического осциллятора, отображая только последние 400 баров (см. примечания). Параметры, которые можно изменить:
%K Period : период %K %D Period: период %D Slowing: период замедления Price Field : Low/High, Close/Close MA Met
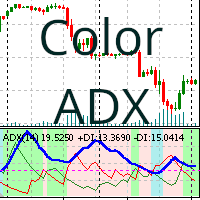
Indicador Average Directional Movement Index (ADX) , который окрашивает фон в зависимости от направления тренда.
Индикатор ADXColor - это технический индикатор, который используется для измерения силы тренда. Цвет фона индикатора определяется его параметрами и окрашивает только последние 400 баров. Параметры, которые вы можете изменить: Period: период времени индикатора ADX. Trend Level: минимальный уровень, который должен достичь индикатор ADX, чтобы считаться бычьим или медвежьим трендом (по
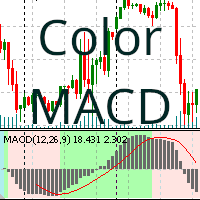
Индикатор MACD с цветным фоном в зависимости от тенденции покупки или продажи
Этот индикатор окрашивает фон в соответствии со значением индикатора MACD (Moving Average Convergence Divergence), в зависимости от его тенденции к покупке или продаже. Цвет фона определяется на основе параметров осциллятора стохастика, рисуя только последние 400 баров (см. примечания) и используется для измерения силы тренда и вероятности его разворота.
Параметры, которые вы можете изменить, совпадают с теми, которы

This indicator provides the ability to recognize the SMC pattern, essentially a condensed version of the Wyckoff model. Once the pattern is confirmed by RTO, it represents a significant investment opportunity. There are numerous indicators related to SMC beyond the market, but this is the first indicator to leverage patterns to identify specific actions of BigBoy to navigate the market. Upgrade 2024-03-08: Add TP by RR feature. The SMC (Smart Money Concept) pattern is a market analysis m

Эта панель обнаруживает и отображает на графике зоны спроса и предложения , как в скальпинге, так и в долгосрочном режиме, в зависимости от вашей торговой стратегии для выбранных символов. Кроме того, сканерный режим панели помогает сразу проверить все нужные символы и не пропустить ни одной подходящей позиции / MT5 версия
Бесплатный индикатор: Basic Supply Demand
Особенности Позволяет просматривать торговые возможности по нескольким валютным парам , давая вам четкое и ясное представление об

Just an excellent arrow indicator with 96 percent accuracy. It uses trend moving averages to detect trend direction change and alert with corresponding arrow. It does not repaint and the alert is optional on the basis of current bar or previous bar. Please this indicator is not responsible for every of your trading position and it must be used in conjunction with other indicators to make trading.

تمكين الصفقات الخاصة بك مع مؤشر الأمل الجيد تحقيق التكامل لنقاط دخول قوية إذا كنت تبحث عن طريقة لتحسين تداولك في الفوركس، فإن مؤشر الأمل الجيد موجود هنا لإرشادك. يتميز هذا المؤشر بقدرته على الدمج الفعال لمختلف المؤشرات المعروفة، مما يؤدي إلى نقاط دخول قوية وتحليل شامل للسوق. ما الذي يميز الأمل الجيد؟ <أ ط=0>1. تكامل المؤشر: تتفوق شركة Hope Good في استخدام مجموعة متنوعة من المؤشرات المعروفة ودمجها بشكل فعال، مما يوفر لك تحليلًا شاملاً للسوق. <أ ط=0>2. نقاط الدخول القوية: يعمل المؤشر على توليد نق

(первый и оригинальный) MOLFAR – новый алгоритм индикатора отскока цены. НЕ ПЕРЕРИСОВЫВАЕТСЯ — появилась и останется! НЕ ЗАПАЗДЫВАЕТ — появляется вовремя! Мы действительно долго работали над алгоритмом этого индикатора. Он уникален, вы можете в этом убедиться как в бесплатной версии на тестере, так и полноценной версии на своем счету.
Описание, настройки и другие интересные вещи об индикаторе MOLFAR можно найти здесь .
MOLFAR использует технический анализ, просчитывает уровни Фибоначчи
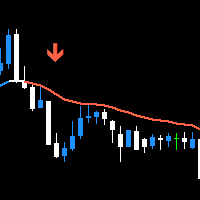
Trend Swift is the trend finding indicator that can estimate the trend volume for you. It help you seeking for the possible trend reversal so you can enter the trade with confident. Because it's indicator you can trade with your decision and really safe to use with any Prop Firms without worry about the rule that doesn't allowed to use EA to trade. This indicator isn't the the normal indicator that just blindly follow EMA, it's the trading system that surely find major trend with EMA but measur

40% СКИДКА НА РОЖДЕСТВО! ПОВЫШЕНИЕ ЦЕНЫ ДО $250 С 1 ЯНВАРЯ!
Представляем GoldenGate Entries: Революционное Торговое Решение!
Откройте для себя революционный подход к торговле с GoldenGate Entries (GGE), передовым индикатором, разработанным для повышения вашего опыта торговли. GGE предоставляет обширный набор функций, чтобы предоставить пользователям точность и уверенность в их торговых решениях.
Пары: Любые (валюты - товары - акции - акции - криптовалюты)
Таймфреймы: 15 минут до H1
Основны

Simple but effective entry improving indicator that you want to use. Combine with other indicators and your trading strategies. Explore different ways to use it and find your perfect entry.
Basic instructions: Buy Signal Example: colour change from red to green Sell Signal Example: colour change form green to red
Check screenshots below for examples of use.

ALQANNAS (Sniper) Indicator Overview: Welcome to ALQANNAS, your ultimate sniper in the forex market! ALQANNAS is a powerful and versatile trading indicator designed to enhance your trading experience. Whether you're a beginner or an experienced trader, ALQANNAS provides you with accurate non repainting signals, trend direction and strength, and advanced features to elevate your trading strategy. Key Features: Buy and Sell Signals: ALQANNAS is equipped with a sophisticated algorithm that genera
Индикатор переведен с другой платформы, которая была разработана LuxAlgo.
Я добавил скользящие средние разных типов, а также разнообразие источников данных. В оригинальной версии скользящая средняя - это SMA и источник данных с рынка, собранный только с закрытия свечей.
В этой версии вы можете выбрать множество типов скользящих средних, а также источник данных, таких как high/low/HL2/HLC/HLC2/... .
Вот некоторые подробности от оригинального разработчика:
Индикатор Range Detector предназнач

Представляем вам индикатор Currency Smart Scalper - трендовый индикатор нового поколения, разработанный специально для валютной пары EURUSD и временного интервала H1. Этот мощный инструмент автоматически анализирует рынок и предоставляет сигналы для открытия и закрытия сделок. Благодаря использованию индикаторов Ichimoku, Parabolic SAR и Bollinger, Currency Smart Scalper обеспечивает непревзойденную эффективность при торговле на валютном рынке. Основной преимуществом этого индикатора являются ег
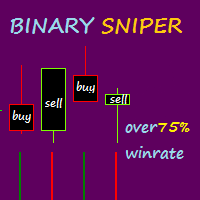
Binary Sniper — это индикатор mt4, который подает сигналы на покупку и продажу для торговли бинарными опционами. Этот индикатор имеет другой подход: При торговле бинарными опционами этот индикатор не перерисовывает и не задерживает сигнал. ПРАВИЛА ВХОДА: 1. КОЛЛ (ПОКУПКА). Когда красная свеча закрывается с зеленым цветом бинарной снайперской полосы после того, как она была красной (первое переключение цвета). 2. ПУТ (ПРОДАТЬ). Когда зеленая свеча закрывается, а цвет двоичного снайперского бара

Introducing our advanced Indicator, a groundbreaking tool for identifying support and resistance zones with unmatched precision. Elevate your trading strategy with a host of features, including a dual-color upper and lower box system that allows for easy visual recognition of market trends.
Key Features: Dual-Color Box for the Support and Resistance Zones Customize your analysis with dual-color box. The upper and lower boxes offer distinct colors, providing a clear visual representation of supp

Этот индикатор отображает до 6 уровней, которые можно включать и выключать, чтобы сделать график чище в соответствии с требованиями трейдера.
Эти 6 уровней разделены на 2 набора: высокий и низкий.
Для каждого набора можно выбрать другой таймфрейм
Он основан на стратегии разворота предыдущего максимума-минимума, поскольку считается, что цена обычно показывает отклонение на меньшем временном интервале, таком как 5 минут, когда цена достигает дневного, недельного или месячного максимума-минимум

Cobra Pivot Points — это индикатор для построения наиболее оптимизированных точек разворота, который вы можете протестировать самостоятельно, загрузив ДЕМО-версию.
1. Выберите два лучших режима поворота: повороты Cobra или повороты Camrilla.
2. Вы можете использовать любой таймфрейм, не ограничиваясь D1.
3. Вы можете играть со значением High Low Close предыдущего дня с помощью параметра Shift. 1 = предыдущий бар, 2 = бар перед предыдущим баром и так далее. Этот параметр поможет вам в исследов

Introducing our revolutionary intra-day trading indicator, meticulously crafted to optimize your trading insights within the 24-hour market cycle. Immerse yourself in historical data with precision using two distinctive modes - "All History" and "Last X Hours."
Key Features: All History Mode Uncover a comprehensive view of the day's dynamics. Instantly analyze the preceding day's high and low, 50% mid-point, and the open versus close price for the current day. Decode critical patterns to inform

Расширенная версия индикатора для визуализации временных диапазонов ключевых торговых сессий: Азиатской, Европейской и Американской. Основным преимуществом данного индикатора является автоматическое построение профиля цены на торговую сессию. Индикатор обладает функционалом настройки времени начала и окончания каждой торговой сессии, а также автоматическим определением временной зоны торгового сервера. Индикатора включают возможность работы с минимальной загрузкой процессора и экономии опер

Стрелочный индикатор "Cool volumes" создан на основе тиковых объемов на Мт4. Индикатор сам отслеживает в определенный промежуток времени (выбор таймфрейма) количество объемов на покупку или продажу. И когда происходит аномальное превышение объемов продавцов или покупателей он и выдает сигнал на продажу или покупку. В нижнем окне рисуются цветные гистограммы, где зеленый цвет показывает преобладание в данный момент покупателей, что означает потенциальный немедленный разворот на повышение в данном

Наша инновационная панель Basic Candlestick Patterns Dashboard специально разработана для автоматического определения прибыльных свечных моделей на графике. Эта панель использует передовые алгоритмы для сканирования ценовых графиков в режиме реального времени и выявления широкого спектра свечных моделей, от классических до сложных. Кроме того, он имеет простой в использовании интерфейс, который позволяет визуализировать обнаруженные паттерны на различных таймфреймах, что облегчает принятие обос

The Trend Analysis Indicator is an innovative tool designed for traders and investors who seek to navigate the complexities of the financial markets with greater precision and insight. This powerful indicator is engineered to adeptly identify whether a market is trending or not, offering users a vital edge in their trading strategy. Key Features: Accurate Trend Detection : The core functionality of the Trend Analysis Indicator lies in its ability to accurately detect market trends. It analyzes p
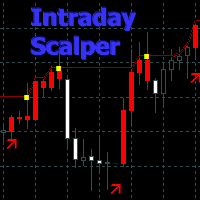
Трендовый автоматический индикатор использующий алгоритм для определения импульсных сигналов для скальпинга и внутри дневной торговли.
Работающий по тренду индикатор автоматически рассчитывает потенциальные точки входа и выхода из сделок.
Индикатор содержит трендовую линию и целевой канал для следования сигналов, изменяющий цвет от направления.
Основные характеристики
Сигнальные окрашенные свечи и стрелки: синие - направление вниз, красные - направление вверх. Желтые точки для выхода из сдело
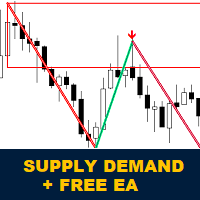
Представляем индикатор Koala Supply Demand для MetaTrader 4 :
Добро пожаловать в индикатор Koala Supply Demand. Этот индикатор разработан для выявления непрерывных зон предложения и спроса. Он может помочь трейдеру рассматривать рынок как зону, где можно видеть, как цена уважает некоторые мощные зоны. Этот индикатор также может показать вам сигналы ценового действия, когда они формируются внутри зон. Присоединяйтесь к Каналу Koala Trading Solution в сообществе mql5, чтобы узнать последние нов

Introducing our groundbreaking indicator designed to elevate your trading strategy! Unlock the power of precise volume analysis with Buy, Sell, and Neutral indicators. Tailor your approach with customizable levels based on timeframes and moving average methods.
Key Features: Dynamic Volume Insights Instantly identify Buy, Sell, and Neutral volumes for informed trading decisions. Gain clarity on market sentiment like never before. Adaptable Level Configuration Customize and adapt levels to match

LLAMA stands for Lag-Less Adaptive Moving Average it is a state of the art moving average that is very close to the price, specially those sudden moves that put every typical moving average away from the price. This finding comes from the latest research in adaptive moving averages, with a lag close to 0
This MA keeps a very high smoothing ability while keeping a lag almost null.
This new version now adds Jurik filtering in addition to the default Simple MA for superior smoothing capability
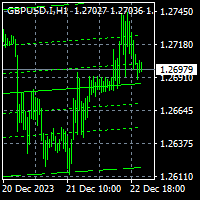
To get access to MT5 version click here . This is the exact conversion from TradingView: "Linear Regression Channel" by "LonesomeTheBlue". This is a repaint indicator. Buffers are not available for processing. You need to parse objects on chart. All input fields are available. You can message in private chat for further changes you need. Thanks for downloading
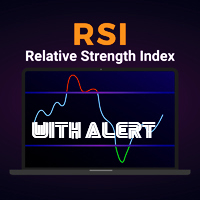
Indicador Universal RSI con Alertas de Oportunidad Este indicador para MetaTrader ha sido meticulosamente diseñado para adaptarse a todos los periodos de tiempo, proporcionando una herramienta versátil para los operadores de todos los niveles. Basado en el índice de fuerza relativa (RSI), este indicador destaca oportunidades potenciales en el mercado y te notifica de manera instantánea a través de alertas personalizadas. Características Principales: Universalidad de Periodos de Tiempo: Funciona
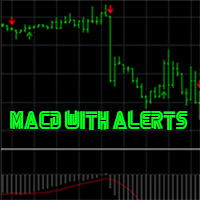
Indicador de Oportunidades MACD en Tiempo Real con Alertas de Precisión Descubre un indicador excepcionalmente preciso diseñado para potenciar tu experiencia de trading. Basado en el Moving Average Convergence Divergence (MACD), este indicador ofrece señales nítidas y oportunas, mejorando tu capacidad para identificar puntos de entrada y salida estratégicos. Además, este potente instrumento te mantendrá informado con alertas en tiempo real, proporcionándote una ventaja competitiva en los mercado
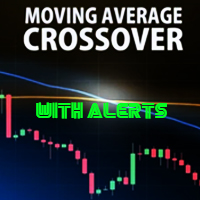
Descubre una nueva dimensión en el análisis técnico con CrossAlert MA, un poderoso indicador basado en cruces de medias móviles con funciones de alerta incorporadas. Diseñado para MetaTrader 4, CrossAlert MA utiliza la estrategia de cruce de medias móviles para identificar cambios significativos en la dirección del precio, proporcionando señales claras y oportunas. Características Principales: Cruces de Medias Móviles: CrossAlert MA aprovecha la potencia de los cruces de medias móviles para iden

PrecisionBands Descripción: Explora el mundo del trading con mayor precisión utilizando PrecisionBands, un indicador avanzado basado en las famosas Bandas de Bollinger. Diseñado para MetaTrader 4, PrecisionBands combina la versatilidad de las bandas de volatilidad con marcadores nítidos de señales de compra y venta, proporcionando una herramienta esencial para los traders que buscan tomar decisiones informadas. Características Principales: Bandas de Bollinger Mejoradas: PrecisionBands utiliza al

My indicator is 1000%, it never repaints, it works in every time period, there is only 1 variable, it sends notifications to your phone even if you are on vacation instead of at work, in a meeting, and there is also a robot version of this indicator With a single indicator you can get rid of indicator garbage It is especially suitable for scalping in the m1 and m5 time frames on the gold chart, and you can see long trends in the h1 time frame.
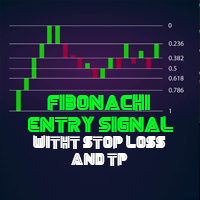
Indicador Trend and Fibonacci ProTrader Mr Beast El Indicador Fibonacci ProTrader v1.0 es una potente herramienta diseñada para optimizar tus estrategias de trading en MetaTrader, aprovechando la precisión y la lógica de la secuencia de Fibonacci. Este indicador incorpora señales avanzadas de take profit, tendencia take profit y stop loss, proporcionando una guía estratégica sólida para tus operaciones. Características Principales: Secuencia de Fibonacci Dinámica: El indicador traza automática

ndicador ADX Crossing Alertby Mr Beast El Indicador ADX Crossing Alert v1.0 es una herramienta avanzada diseñada para potenciar tu análisis técnico en MetaTrader, centrándose en las señales generadas por el cruce del Indicador de Dirección del Movimiento (ADX). Este indicador ofrece alertas visuales en el gráfico y la conveniencia de alertas via email, permitiéndote estar siempre al tanto de las oportunidades de trading. Características Destacadas: ADX Crossing Signals: El indicador utiliza el c

Индикатор PUA MultiType Pivot строится на суточном графике предыдущего дня. Индикатор PUA MultiType Pivot является одним из наиболее популярных инструментов в техническом анализе, используемым трейдерами для выявления потенциальных точек разворота на финансовых рынках. В этом индикаторе осуществляется построение трех видов точек Pivot: Классические, Фибоначчи и Camarilla, каждый из которых предлагает свой уникальный подход к анализу рынка. Преимущества этого индикатора включают в себя: Простота

Created by imjesstwoone and mickey1984, this trade model attempts to capture the expansion from the 10:00-14:00 EST 4h candle using just 3 simple steps. All of the information presented in this description has been outlined by its creators, all I did was translate it to MQL4. All core settings of the trade model may be edited so that users can test several variations, however this description will cover its default, intended behavior using NQ 5m as an example. Step 1 is to identify our Price Ra
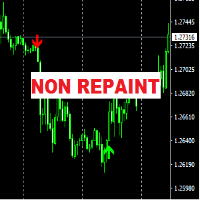
The "FCK Trend Arrow No Repaint" indicator is designed for analyzing market dynamics and determining potential trading signal moments. The main feature of this indicator is the absence of signal repainting, which contributes to more accurate and reliable forecasting of price movements in the market.
Mechanism of Operation: The "FCK Trend Arrow No Repaint" indicator uses several types of graphical elements to indicate trading signals: Up and Down Arrows: The indicator marks possible market entr
FxTDR is a bespoke technical indicator tailored for analyzing asset prices. The primary objective of this indicator is to identify favorable entry points for trading on selected currency pairs. It employs a set of criteria to detect optimal trading opportunities within the chosen time frame.
Key Features: 1. Entry Point Detection: Pinpoints favorable trade conditions. 2. Arrow Signals: Provides visual cues for identified opportunities. 3. Push Notifications: Real-time alerts for timely awarene

#WinPlus Trend and Entry Indicator
Unlock the power of precision in your trading with WinPlus, a bespoke technical indicator designed for financial assets. This indicator is meticulously crafted to discern trends and pinpoint entry opportunities across a diverse range of currency pairs on the h4 Timeframe. WinPlus analyzes price movements and utilizes our advanced algorithms to identify trends. When an optimal entry point is detected, the indicator generates clear arrow signals on the chart. A
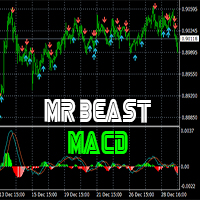
MR BEAST MACD Momentum Signals BUY SELL es una poderosa herramienta diseñada para optimizar las decisiones de trading al identificar oportunidades clave de compra y venta en los mercados financieros. Basado en el popular indicador MACD (Moving Average Convergence Divergence), este sistema utiliza algoritmos avanzados para generar señales precisas que reflejan cambios significativos en la dinámica del mercado. Características Destacadas: Señales de Compra y Venta Precisas: El Indicador MACD Mo

Силовая направленность
Технический индикатор силовой направленности основан на идее сбора набора элементов, которые могут быть использованы для помощи трейдеру в измерении относительной силы движения цен и, одновременно, выявлении и отслеживании направленности тренда.
Индикатор состоит из медленного осциллятора (черная линия), быстрого осциллятора (серая линия) и экспоненциальной средней линии с уменьшенными значениями, которая действует как линия сигнала (синяя линия), выявляя развороты движ

The GGP SuperTrend MT4 Indicator is a technical analysis tool that can assist investors in identifying market trends. The indicator is based on ATR and is very useful for capturing the direction of an asset’s momentum and is widely employed when looking at stocks, currencies, and commodities. It plots a line on the price chart, which acts as a dynamic level of support or resistance, helping traders and investors make informed decisions about entry and exit points. This indicator is MT5 conversi

"MR BEAST ELLIOT WAVES" para MetaTrader: Transforma tu Trading con Precisión y Generosidad El indicador "MR BEAST ELLIOT WAVES" para MetaTrader es una herramienta innovadora que combina la precisión de las ondas de Elliott con la filantropía de Mr. Beast. Diseñado para traders de todos los niveles, este indicador proporciona una visión clara de las oscilaciones del mercado, identificando patrones de manera efectiva. Características Principales: Ondas de Elliott Simplificadas: El indicador visual

El indicador "MR BEAST PATTERNS WITH ALERTS" es una herramienta avanzada diseñada para identificar y notificar automáticamente patrones de oportunidad en el mercado financiero. Basándose en una combinación de análisis técnico y algoritmos inteligentes, este indicador escanea constantemente el gráfico en busca de patrones específicos que podrían indicar momentos propicios para la toma de decisiones. Características Principales: Detección de Patrones: El indicador identifica patrones de oportunida

Indicador "Candlestick Alert Pro" para MetaTrader: Maximiza tu Trading con Alertas de Patrones de Velas El indicador "Candlestick Alert Pro" es una herramienta esencial para traders que desean potenciar su análisis técnico, identificando patrones de velas clave y recibiendo alertas estratégicas en tiempo real. Compatible con MetaTrader, este indicador proporciona una visión detallada de la acción del precio, permitiendo decisiones informadas y oportunas. Características Destacadas: Identificació

Asesor Experto "MR BEAST MIN MAX Price Extremes Master": Potencia tu Trading con Precisión en Mínimos y Máximos El asesor experto "Price Extremes Master" redefine la toma de decisiones en el trading al basarse en los precios mínimos y máximos del mercado. Este innovador asesor utiliza algoritmos avanzados para identificar oportunidades estratégicas en los puntos extremos de precios, permitiendo a los traders capitalizar las fluctuaciones del mercado de manera eficaz. Características Destacadas:

LLAMA MACD has been made from the same formula that creates regular MACD. The only difference is that both smoothing alogrithms has been replaced by the LLAMA (LagLess Adaptive Moving Average)
Main parameters are the same : 2) LLAMA Period (Fast) 1) LLAMA Period (Slow) 3) LLAMA Signal Period
and the LLAMA Parameters are the same as with the single AMA: 1) ActiveBar : computes last bar as well in Realtime (higher CPU usage) 2) ATRPeriod 3) ATRDistMul =: Multiplier1 (Detect) 4) ATRDistMul2 : M
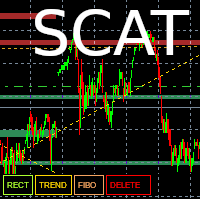
This tool allows you to draw trend lines, polarity zones, supports and resistances, Fibonacci retracements and save them. The user has 4 buttons which are displayed in their default configuration at the bottom left of the main window :
- A "Level" button allowing you to draw support and resistance zones
- A “Trend” button allowing you to draw a trend line
- A “Fibo” button allowing you to display a Fibonacci retracement
- A “DELETE” button which allows you to delete the selected object.
A

Indicator Name: SignalPro Serro Buy Sell Arrows Description: SignalPro Serro Buy Sell Arrows is a powerful and user-friendly MQL4 indicator designed to enhance your trading experience by providing clear and accurate signals for market sell opportunities. Developed with precision and reliability in mind, this indicator is a valuable tool for both novice and experienced traders. Key Features: Buy and Sell Arrows: The indicator displays clear buy and sell arrows on the chart, making it easy for tra

LLAMA BB has been made from the same formula that creates regular BB. The only difference is that the smoothing alogrithms have been replaced by the LLAMA (LagLess Adaptive Moving Average)
Main parameters are the same :
2) LLAMA Period
1) STDDEV Period
3) STDDEV Multiplier
and the LLAMA Parameters are the same as with the single AMA:
1) ActiveBar : computes last bar as well in Realtime (higher CPU usage)
2) ATRPeriod
3) ATRDistMul =: Multiplier1 (Detect)
4) ATRDistMul2 : Multiplie

This Indicator does not repaint itself at all, it's identifies a new TREND in the bud, this indicator examines the volatility, volumes and momentum to identify the moment in which there is an explosion of one or more of these data and therefore the moment in which prices have strong probability of following a new TREND.
CandleBarColorate never misses a beat, he always identifies a new TREND in the bud without error. This indicator facilitates the reading of charts on METATRADER; on a single win
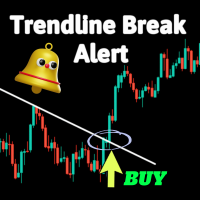
Это простой индикатор, который предоставляет предупреждение о разрыве трендовой линии.
Он может быть полезен, если вы привыкли использовать трендовые линии в своей торговле. Регулируемые параметры включают:
Идентификатор свечи: на какой свече сигнализировать после прорыва И три типа предупреждений: Отправить Email Звуковые предупреждения Уведомления Push Буду рад вашим отзывам или комментариям к индикатору.
Посмотрите это видео, чтобы узнать, как настроить уведомления на телефоне: https://ww

All in one Indicator. Multiple market analysis tools. Non-Repaint Oscillator signals, Trend lines, Price channel, Fibonacci levels, Support and Resistance, Regression, Pivot levels, Candle Strength and Oversold/Overbought line detector. Includes buttons to hide or show. Advanced algorithms to detect important reversal points and draw trend lines or shapes automatically in appropriate areas. A simple and professional chart display, user friendly and easier to understand for faster and accurately

ForexAnalysis Indicator that shows a whole series of information that the broker doesn't tell me, i.e.: volumes, swaps, that is, what I spend every day to leave it open, then you see the pivot with a suggestion on the operation and the stop loss to adopt. We see that with this new indicator, when the price approaches the zero line of the trade, which is automatically suggested, generally with Price Action signals on the screen, we are at an advantage because in the lower bar we have an indicati

Продукт переведен с другой платформы и изначально создан компанией TradeMaster Lite. Индикатор в основном использует концепцию MACD, но усиливает свои возможности различными видами усреднения. Он эффективен для определения тренда и разворота.
Вот некоторые подробности от владельца:
Мы представляем настраиваемый индикатор MACD со следующими возможностями: Мультитаймфрейм Полосы отклонения для выявления необычной волатильности 9 типов скользящих средних Условное окрашивание и пересечение линий

Представляем индикатор Gold Massive Arrow, специально разработанный для трейдеров золота в долгосрочной и краткосрочной перспективах. Этот передовой инструмент обеспечивает высоковероятные торговые сигналы без необходимости в большом количестве индикаторов, упрощая ваш опыт торговли на динамичном рынке золота.
Адаптированный для трейдеров всех стилей, этот 15-минутный сигнальный индикатор предоставляет потенциал для максимизации прибыли как для долгосрочных, так и для краткосрочных трейдеров с
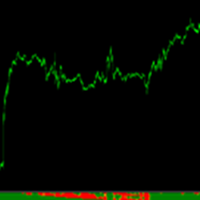
Power Real Trend es un indicador que no repinta y que muestra la dirección real que tiene el mercado, ofreciendo una clara manera de confirmar entradas. Es un indicador que para su constitución se realizan múltiples operaciones para formar los distintos rangos que se utilizan para su creación. Tiene un manejo muy sencillo dando sólo tres posibles valores (1,0,-1) altamente visual y de muy sencilla comprensión. La parte superior del mismo es la zona más sensible y la inferior corresponde a la te
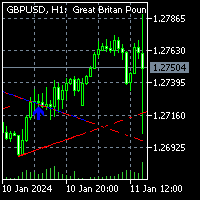
To get access to MT5 version click here . This is the exact conversion from TradingView: "Trendlines with Breaks" by LuxAlgo
This is a REPAINT indicator. Buffers are available for processing. However there are objects on chart to process also. All input fields are available. Alerts are generated based on bars closure. You can message in private chat for further changes you need. Thanks for downloading

Вы инвестор, ищущий долгосрочные возможности на финансовом рынке? Представляю вам Пользовательский Индикатор Долгосрочного Тренда. Этот индикатор предназначен для трейдеров, желающих проводить сделки на более длительных временных интервалах, чем ежедневные, недельные и месячные графики. С четкими и точными сигналами вы получите необходимую помощь для принятия обоснованных решений. Основные характеристики: Долгосрочная стратегия: Этот индикатор идеально подходит для инвесторов, нацеленных на долг

TMA - Индикатор Треугольного Скользящего Среднего Индикатор TMA - Треугольного Скользящего Среднего является мощным инструментом для трейдеров, стремящихся анализировать и выявлять тренды на финансовых рынках. Этот индикатор интеллектуально рассчитывает треугольные скользящие средние, предоставляя ценные исследования направления рынка. Основные характеристики: Идеально подходит для более длительных временных интервалов: Рекомендуется использовать на периодах выше D1/W1/MN, предлагая всесторонний

Fnix Ma цветной. Этот индикатор создан для помощи трейдерам в выявлении трендов на финансовых рынках. MA - Master Trend Position Trade - это инструмент, который рассчитывает и отображает скользящие средние, чтобы облегчить анализ трендов активов. Основные характеристики: Рассчитывает скользящие средние для выявления трендов. Рекомендуется использовать на таймфреймах выше D1/W1/MN (ежедневный/недельный/месячный). Предлагает использовать отложенные ордера для анализа. Совместим со всеми валютными
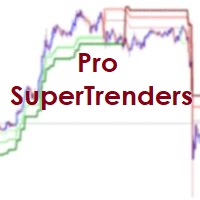
Dear traders! This indicator automatically plots SuperTrends across 3 timeframes. SuperTrend is a trend following indicator. However, it is not much useful on single timeframe, as that gives many whipsaws. Professionals analysis across multi timeframes before taking trades. This adds confluence to trade setups.For the same purpose, Pro SuperTrends shows trend (or absence of trend) on 3 timeframes. Our trading odds improve, when positions are aligned with higher timeframes. Further, SuperTren

The Book of Changes is a product of ancient civilization and a philosophical work that highly integrates natural and social sciences in China. The Book of Changes believes that all things in heaven and earth are constantly developing, and it explains the laws of nature. This law reveals the characteristics of the entire universe, covering the attributes of all things in heaven and earth. The Book of Changes is the crystallization of the wisdom of the Chinese nation. It is the crystallization of
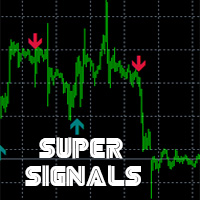
Indicador de Trading UltraPreciso para MetaTrader 4: "Mr Beast Signals no Repaint with alerts" Descubra la revolución en el análisis técnico con nuestro indicador Quantum Precision Pro diseñado para MetaTrader 4. Este avanzado indicador combina algoritmos de vanguardia con inteligencia artificial para ofrecer señales de compra y venta extremadamente precisas en tiempo real. Características destacadas: Precisión sin Igual: Nuestro algoritmo utiliza una combinación de análisis técnico y patrones d

The GGP Trendlines with Breaks Alert MT4 Indicator is a technical analysis tool that can assist investors in identifying market trends. The indicator returns pivot point based trendlines with highlighted breakouts. Users can control the steepness of the trendlines as well as their slope calculation method. This indicator is MT4 conversion of the Trendlines with Breaks Indicator by “ LuxAlgo “ in Trading View website and some alert methods are added to provide real-time alerts when a trading sign
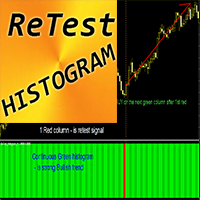
Crypto_Forex Индикатор "ReTest Histogram" для MT4, без перерисовки.
- Индикатор ReTest_Histogram может использоваться для поиска сигналов входа в направлении основного тренда после повторного тестирования сильного уровня поддержки/сопротивления. - ReTest Histogram может быть двух цветов: красный для медвежьего тренда и зеленый для бычьего. - Как только вы увидите устойчивые последовательные столбцы гистограммы одного цвета, это означает, что начался новый тренд. - Сигнал ReTest - это 1 столбец
MetaTrader Маркет - лучшее место для продажи торговых роботов и технических индикаторов.
Вам необходимо только написать востребованную программу для платформы MetaTrader, красиво оформить и добавить хорошее описание. Мы поможем вам опубликовать продукт в сервисе Маркет, где его могут купить миллионы пользователей MetaTrader. Так что занимайтесь только непосредственно своим делом - пишите программы для автотрейдинга.
Вы упускаете торговые возможности:
- Бесплатные приложения для трейдинга
- 8 000+ сигналов для копирования
- Экономические новости для анализа финансовых рынков
Регистрация
Вход
Если у вас нет учетной записи, зарегистрируйтесь
Для авторизации и пользования сайтом MQL5.com необходимо разрешить использование файлов Сookie.
Пожалуйста, включите в вашем браузере данную настройку, иначе вы не сможете авторизоваться.