Смотри обучающее видео по маркету на YouTube
Как купить торгового робота или индикатор
Запусти робота на
виртуальном хостинге
виртуальном хостинге
Протестируй индикатор/робота перед покупкой
Хочешь зарабатывать в Маркете?
Как подать продукт, чтобы его покупали
Бесплатные технические индикаторы для MetaTrader 4 - 26
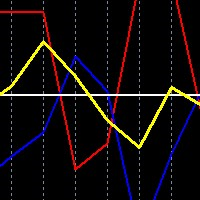
This is a simple free tool for simulating trades when trading both AUDUSD and NZDUSD in a hedge strategy, you can drop the indicator on either market chart. It is essential because you cannot tell at a glance, what a combined trade would be like, just by looking at the two individual charts separately.
New premium low cost indicator
How to use: Drop the indicator on either AUDUSD or NZDUSD chart, or any other chart, it will work.
You choose ploting period, to the number of days/weeks
FREE

Индикатор выводит на график статистику торговли анализируемого Сигнала маркета. Данные по сделкам Сигнала представляются в файле формата excel (csv) и могут быть взяты со страницы Сигнала > История сделок ( Экспорт в CSV: История ). Скопированный файл нужно сохранить в директорию МТ4>File>Open Data Folder>MQL4>Files. Доступно управление цветом и шрифтом выводимых результатов. В случае различия имен инструментов на счете Сигнала и на счете пользователя используйте параметры Prefix и Suffix .
FREE

MultiFiboDynamicMT4 - мощный, профессиональный индикатор для оценки важных уровней поддержки и сопротивления. Главное преимущество - он строит уровни Фибоначчи на всех временных периодах одновременно, что позволяет трейдеру видеть полную картину возможного движения цены торгового инструмента!
Преимущества индикатора Индикатор прекрасно подходит для скальпинга и торговли бинарными опционами; Подходит для начинающих и опытных трейдеров; Работает на любых таймфреймах; Работает на любых финансовых
FREE

RCCMA — это общий индикатор скользящих средних, работающий с индикатором ReviewCandleChart. Оригиналом является индикатор Custom Moving Average от компании MetaQuotes Software Corp. На основе этого когда я создал соответствующий индикатор для ReviewCandleChart .
Преимущества Когда индикатор ReviewCandleChart включен, справа от вертикальной линии индикатора никакие линии отображаться не будут. Когда индикатор ReviewCandleChart включен, нажатием клавиши, например Z или X, вы можете нарисовать ск
FREE

The TLR indicator is a market trend identification indicator. The idea behind this indicator is to use 3 linear regression lines, one short-term, one medium-term, and one long-term. The UPTREND will be determined when: The long-term linear regression line and the medium-term linear regression line have an uptrend. The long-term linear regression line has an uptrend, the medium-term linear regression line has a sideway, and the short-term linear regression line has an uptrend. The DOWNTREND will
FREE

---> Check all the other products <---
The Candle Bias is a coloring indicator that doesn't take account of the close price of the bars.
It will color the candle in the bearish color (of your choice) if the downard range is greater than the upward range. Conversely, it will color the candle in the bullish color of your choice if the upward range is greater than the downward range.
This is a major helper for Multi Time Frame analysis, it works on every security and every Time Frame. You
FREE
CoralPage is a simple little utility to add navigation controls to your chart. You can now easily step through the symbols in the Market Watch without having to click-and-drag a symbol from the Market Watch onto your chart. It's a simple but indispensable time-saver! Click move to the first, previous, next or last symbol in the Market Watch. Shift-click to go the the previous or next symbol that has an open order. CoralPage is completely free. If you like this, please check out my other prod
FREE

- This is the exact conversion from TradingView: " 200-EMA Moving Average Ribbon" By "Dale_Ansel". - This indicator plots a series of moving averages to create a "ribbon" that offers a great visual structure to price action. - This indicator lets you read buffers. For information on buffers please contact via message. - This is a non-repaint and light processing load indicator
FREE

Moving Average Convergence Divergence (MACD) Signal Input parameters: signal mode: set it to true if you want to plug it into STAT (Signal Tester and Trader) arrow shift: distance between fast EMA line to arrow on chart standard entry mode for MACD fast EMA period slow EMA period MACD period MACD price method Standard Entry mode: buy when slow EMA cross and close above fast EMA while above the 0 line sell when fast EMA cross and close above slow EMA while below 0 line You can find the best set
FREE

---> Check all the other products <---
The Multi Time Frame Chandelier Channel is a good synthesis of the chandelier trailing stop and let you analyze the trend.
Enter when the price breaks one of the two lines, then trail using the opposite line. Ideal for scalping, entering after the dot appears.
Plenty of customization: Choose the lookback period, the longer, the slower Choose the Time Frame to use (must be greater or equal your chart TF Play around with the options to get the
FREE

Market Dashboard FREE Indicator gives you advanced information’s about your selected Symbols in MarketWatch
Features
Daily Price Movements (M1 – D1) RSI Values with Highlight Function for your current Timeframe & H1 & H4 Profit per Symbol and traded lots (buy & sell) EMA 5 – 100 based on selected period Swap Information (which direction is positive) FIBO Info & Tracking (highlighted FIBO Levels close to current price – based on selected period) One Click ChartOpen this Version is limited to
FREE

Трендовый индикатор, который определяет оптимальные точки входа в направлении тренда, а также объективный стоп-лосс для управления сделкой. Индикатор позволяет поймать тренд на раннем этапе. Индикатор рисует линию сопротивления, когда обнаруживает на графике восходящий тренд , и линию поддержки, когда обнаруживает нисходящий тренд . Пробой этих уровней позволяет определить направление и импульс преобладающего тренда, что позволяет определить оптимальные точки входа в направлении тренда. Индикато
FREE

White Crow Indicator
by VArmadA A simple yet powerful candle analysis based indicator using the White Soldiers & Crow patterns.
Works with timeframes 1H and higher and tested on all major pairs. Pay attention to the signal: An arrow indicating a long or short entry.
How It Works:
Arrows indicate a ongoing trend. After multiple bullish or bearish candles in a row the chances for another candle towards that trend is higher.
Instructions: - Crow Count: Set the number of candles that n
FREE
Цифровые фильтры являются (упрощенно) способом сглаживания данных. В отличии от традиционных скользящих средних цифровой фильтр в большинстве случаев будет более эффективен. Представленный индикатор отображает в виде цветных свечей данные нескольких (на выбор) цифровых фильтров построенных по различным (на выбор) ценам. Индикатор не перерисовывается на полностью сформированных барах. Индикатор позволяет эффективно следовать тренду как в краткосрочной так и в долгосрочной перспективе (в зависим
FREE

The Starting Points indicator for MetaTrader 4 is a technical analysis tool that shows the monthly, weekly, and daily starting points, as well as the 1000-point and 500-point levels, in the forex market. The indicator is displayed as a series of horizontal lines that represent the starting points and levels. Benefits of Using the Starting Points Indicator Identify potential trend changes: The Starting Points indicator can help traders identify potential trend changes by highlighting areas wher
FREE

The Netsrac Correlation Trade Indicator (NCTI) was created to trade correlations between different assets. NCTI offers five different strategies to do this. Five different correlation trading strategies with two or three assets Fast access your assets with one click via asset buttons Your profit/loss at a glance Configurable alerts via screen or mobile You can use the indicator with every timeframe. Higher timeframes give fewer but better signals. If you have some questions or suggestions - plea
FREE

Форекс-индикатор R Ease Of Movement Metatrader 4 представляет собой торговый осциллятор EMZ синего цвета. Это форекс-индикатор типа осциллятора, который генерирует бычью и медвежью торговую зону. Значения выше нулевого уровня считаются бычьими, а значения ниже нулевого уровня — медвежьими.
Осциллятор R Ease Of Movement сам по себе не дает хороших результатов, его нужно торговать в сочетании с техническим индикатором, следующим за трендом. К хорошим трендовым индикаторам форекс относятся: SMA,
FREE

Индикатор Currency Strength Matrix (CSM) показывает текущую силу основных валют на нескольких таймфреймах, позволяя сортировать валюты по силе и обнаруживать потенциально прибыльные пары. Индикатор идеален для скальпинга и во время резких сильных движений. Данная демо-версия показывает только 4 валюты и 4 таймфрейма. Полную версию можно найти здесь: https://www.mql5.com/ru/market/product/24252
Как она работает? CSM сравнивает значение текущей скользящей средней с такое же скользящей средней на
FREE
Представленный индикатор - переработанная версия индикатора Moving Speed Normalized автором которого является Роман Киверин . Индикатор подает два типа сигналов: 1. Пересечение гистограммой нулевого значения; 2. Смена направления сигнальной линией. Для эффективного использования необходимо учитывать долгосрочный тренд и открывать позицию только в его направлении. Рекомендуется использовать подтверждение сигналов. Сигнал считается подтвержденным если текущая цена преодолела максимальное (для сиг
FREE

This pointer is supplied of a double smoothing in such way to succeed to be more reactive of a blunt Moving Average but without tracing the noises of bottom of the market. Its use will have to be exclusively turned to the search and to the identification of the trend in action (even if graphically it could seem an indicator that indicates an inversion of the prices) because the first useful signal is had to the opening of the successive bar to that one that has made to invert the sense of the
FREE

The indicator is a 15-minute signal indicator for all types of traders. Meaning, you could make lots of profits trading two different signals in one indicator.
NOTE: Both indicators are channels for achieving the same result. RED ARROW -- Sell Signal BLUE ARROW -- Buy Signal
Purchase now to be part of our community. We offer standard chart setups for both novice and intermediate traders. Trade with ease!
FREE
EasyTrend 2 AM - индикатор который позволяет открыть позицию в самом начале значительного движения цены. Вторым важнейшим качеством индикатора является способность максимально долго следовать тренду для получения всей потенциальной прибыли при этом минимизируя потенциальные убытки. Индикатор позволяет оповещать пользователя о своих сигналах отправляя сообщения на терминал и электронную почту. Индикатор не перерисовывается и не пересчитывается.
Сигналы при работе с индикатором: появление красно
FREE

Buy a Coffee for Yuniesky Carralero Cuellar
This indicator draws SUPPORTS AND RESISTANCES:
TX - The max price since the last cross down, between M20_30MIN y M20_H1 , and the previous up cross
BX - The min price since the last up crossover, between M20_30MIN y M20_H1 , and the previous down crossover
You will need to use the A4_D template that shows
1. Simple Moving Average 20 30 MINUTES
2. Simple Moving Average 20 1 HOUR
3. Period Separators
4. ASK line
Support
I will be h
FREE

CHF INDEX
The Currency Index Project is ONE part of a thorough Forex study. Many people do not know the theoretical basis that drives currency exchange rates to move on the market. With this set of tools you will be able to have a more complete view of the entire market by analyzing not only the single currency of an exchange, but all the exchange rates that make up that currency by looking at a single window!
The indicator faithfully represents the real index of a single currency present in
FREE

Tick Speed Free povides a on-chart label of tick speed to allow you to see the ebb and flow of market activity. Observing rises and falls in tick speed may allow you to better time entries to reduce slippage and re-quotes.
Options include: - colores for low-mid-high tick speeds - placement and styling - prefix & suffix to customise the speed label
Troubleshooting: - Note, in the tester environment, tick timings are limited to what is supplied by the tester environment and it's speed
- If
FREE

FRB Time - FRB Trader
Indicator that shows the server's time of operation. You can edit the font color and size of the timetable.
Settings font color Font size Background color
To move the Timetable, just click on it and move the mouse to where you want to leave it. After placing the Time where you want it, click again or press "ESC" and the time will stay where you left it.
FREE

This indicator show all history orders on chart with the same symbol. It help you see time and price that orders opened and closed. 1) Show all history 2) Open chart with symbol that you need to watch 3) Attach the indicator 4) Press key "h" -Downwards line Blue: sell with profit -Downwards line Red: buy with loss -Upwards line Blue: buy with profit -Upwards line Red: sell with loss.
FREE
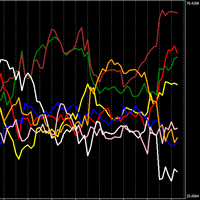
Мощный индикатор, показывающий силу отдельной валюты.
Чем он выше, тем сильнее валюта, и наоборот, чем он ниже, тем она слабее.
Торговая стратегия N1: Открывайте позицию при пересечении линий, если одна пересекает вверх, а другая вниз, открывайте позицию по валюте, которая растет.
Торговая стратегия N2: Откройте позицию, покупая самую сильную валюту и продавая самую слабую валюту.
В настройках можно изменить таймфрейм, я использую по умолчанию (ТАЙМФРАММ 1 ЧАС) и с периодом 24. Я также
FREE
Индикатор отображает на ценовом графике сигналы осциллятора RSX. (Для отображения этих сигналов в отдельном окне, вместе с осциллятором, используется другой индикатор - RSX Osc 4 AM ). Сигналы индикатора оптимально использовать как сигналы для открытия сделки при преодолении ценой максимума или минимума бара на котором сигнал был подан. Противоположный сигнал отменяет сигнал предыдущий.
Настройки: Data period for indicator calculation - период данных для расчета индикатора; Data period to
FREE

Данный индикатор отображает на графике цены сигналы основанные на данных классического индикатора - CCI. CCI может использоваться для определения на рынке зон перекупленности или перепроданности. Достижение таких уровней говорит о том, что рынок может вскоре развернуться, но не подает сигнал, поскольку в сильном тренде рынок может находиться в перекупленном или перепроданном состоянии достаточно продолжительное время. Сигналы как и на большинстве осцилляторов подаются при выходе из этих зон. Дан
FREE

HighLow level Indicators Welcome to our page. here we are introduced here HighLow Level indicator which is the most profitable indicators in our trading life. Recommended Time Frame: M1/M5/H1 Suitable for all currency's This indicator is used to identify the lowest low and highest high level in all currency's to know the trading trends. Trade in the same trend to get the most profit
Happy Trading
FREE

Этот индикатор является идеальным инструментом для сравнения брокеров на предмет минимального запаздывания. Он моментально показывает медленных и быстрых брокеров. Точка на линии означает, что этот брокер самый быстрый, а красной линией (Broker_A) отмечен самый медленный брокер. Посмотрите пример на скриншоте.
Как это работает? Индикатор работает с общей ценовой информацией в общей папке из каталога данных. Он сравнивает все цены. Цена основана на среднем значении (Ask + Bid) / 2. Есть два усл
FREE
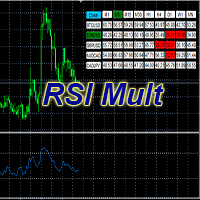
Стандартный Осциллятор RSI (Relative Strength Index) с некоторыми дополнениями. Позволяет выбрать до 5 инструментов. Отображение данных индикатора с выбранных инструментов по всем тайм-фреймам. Быстрое переключение на выбранный инструмент или тайм-фрейм . Индикатор RSI показывает неплохие сигналы, но все же его показания необходимо фильтровать. Одним из таких возможных фильтров может быть RSI с более старшего периода. Данная версия Осциллятора предназначена облегчить работу с графиками, а име
FREE

Velvet RSI is intended for use with the Velvet advanced ordering layer. It is a modified version of the RSI indicator provided by Metaquotes and all of the data it displays is accurate and verified, when it is detected by the ordering layer. In order to place orders with the Velvet RSI indicator, the ordering layer must be installed and running. Ordering from the Velvet RSI indicator requires that "Velvet Ordering Layer" ( found here ), version 1.0 or higher, be installed and running. When de
FREE

基于股票软件黄金线指标改编。可根据需要调整参数值。具体使用规则请参考相关股票软件说明。 ////////////////////////////////////////////////////////////////////////////////////////// //股票公式源码如下:
VAR1:=(HIGH+LOW+OPEN+CLOSE)/4;
黄金线:EMA(3*VAR1-2*SMA(VAR1,2,1),13); //////////////////////////////////////////////////////////////////////////////////////////
声明 1 指标计算均基于价格变化而来, 不保证使用此指标的盈利性,作者不对使用此指标的任何损益负责。 2 本指标免费使用。
FREE
The LWO is a tool that effectively indicates the end of trends. Being an oscillator, it has values between 0 and 100, defining the areas of hyper-sold and those of hyper-bought. Its effectiveness is due to the weighing of prices at the end of individual periods on a logarithmic scale; this allows you to have a perception of the will of the market.
The parameters
The indicator has only 2 settable values, period and smooth factor.
The period indicates how many bars the weighing is performed,
FREE

Pivot Mean Oscillator (PMO) is a unbounded zero-centered oscillator that provides a quick and normalized measure of divergence between two spreads. Detailed description of the mathematical formulation along with some comments and experiments can be found in this article .
Trading aspects
This version of PMO is tuned on spreads relative to Close and Open price signals against their cumulative moving average (CMA). Positive PMO(m,n) values means that last (normalized) m Close prices are higher
FREE

CCFp (Complex_Common_Frames percent) is a measure of currency strength.
Shows the total rate of change of “short-term moving average” and “long-term moving average” for each currency.
Supports eight major currencies: USD, EUR, JPY, CHF, GBP, AUD, CAD and NZD.
1). Displays the currency name at the right end of the graph.
2). You can change the display color of each currency.
3). Moving average smoothing type (ENUM_MA_METHOD) can be selected.
4). Price constant (ENUM_APPLIED_PRICE
FREE

Демо версия индикатора Colored Candles - рассчитывает параметры каждой свечи, а также её объем. После этого, окрашивает свечи в зависимости от её силы и направления. Бычьи свечи окрашиваются зеленым цветом, а медвежьи - красным. Чем больше сила быков или медведей, тем ярче цвет. При желании, цвета можно изменить. Индикатор помогает анализировать движение цены, а также моменты входа в сделку. Более точные сигналы формируются на крупных таймфреймах. Можно и желательно использовать вместе с другими
FREE

Панель Time End от MMD — это простой индикатор, который показывает количество секунд, оставшихся в трех выбранных интервалах. Согласно методологии MMD важен момент, когда происходит направленное движение цены. Этот индикатор позволяет более эффективно использовать эту взаимосвязь в торговле на рынке Форекс и фьючерсами.
Описание функционала:
Time Frame 1 Period - определение первого временного интервала Time Frame 1 Color - указание цвета для первого временного интервала Time Frame 1 Period
FREE
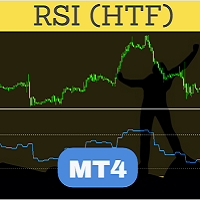
Perfected RSI (Relative Strength Index) HTF (Higher Time Frame) is perhaps the most advanced and reliable HTF indicator. Highly optimized in terms of execution, the indicator comes with standard settings of the RSI indicator which is supplied with the MT4 platform. Place the indicator on the chart, any timeframe. You may select a higher time frame in indicator inputs. The same indicator can be used on a chart multiple times to draw RSI from multiple timeframes or for different RSI period values
FREE

Pipwise Indicators Multiple MAs Intro Please Note, this is a simpler version of the much more powerful version which you can find here: https://www.mql5.com/en/market/product/119947?source=Unknown The Pipwise Indicators Moving Averages indicator is a powerful tool for technical analysis in MetaTrader 4 (MT4). It allows traders to visualize and analyze moving averages from multiple periods on a single chart. Here are the key features:
Customizable Moving Averages: Traders can choose the numbe
FREE

Signals and Alerts for Accelerator/Decelerator indicator based on these MQL5 posts: Accelerator Oscillator and Signals of the Indicator Accelerator Oscillator . Note : this tool is based on the code of Accelerator indicator developed by MetaQuotes Software Corp.
Features The signals are triggered at closing of last bar/opening of a new bar; Any kind of alerts can be enabled: Dialog Box, Email message, SMS notifications for smartphones and tablets, and Sound alerts; Customizable arrows. By
FREE

Данный индикатор представляет собой отображение элементов торговой системы, а именно торговли в зоне, описанной Биллом Вильямсом. Индикатор использует идею открытия сделок на продажу в период одновременного падения значений MACD и OsMA (в книгах Билла Вильямса для этих индикаторов используются названия АО и АС) или наоборот, открытие сделок на покупку в период одновременного роста значений таких индикаторов. Индикатор не имеет настраиваемых параметров. (Вариант индикатора в котором параметры MAC
FREE

Velvet RVI is intended for use with the Velvet advanced ordering layer. It is based on the algorithm for the Relative Vigor Index, provided by Investopedia here . All of the data it displays is accurate and verified against the internal API function iRVI, when it is detected by the ordering layer. In order to place orders with the Velvet RVI indicator, the ordering layer must be installed and running. Ordering from the Velvet RVI indicator requires that "Velvet Ordering Layer" ( found here ),
FREE

Footmarks Pro Footmarks Pro is a MetaTrader 4 Essential Indicator that create round number or sweetspot on chart with "Button". Parameter Indicator Name - Footmarks Pro Pair Selection - 250 points / 500 points / 1000 points Sweetspot Setting Sweetspot Line Color Sweetspot Line Style Sweetspot Line Thickness Sweetspot Button Setting Button Axis-X Button Axis-Y Thanks...
FREE

Осциллятор FxSProWPR генерирует сигналы для подтверждения ТРЕНДА, а также для подтверждения возникновения новых тенденций.
Параметры индикатора NumberBars - Число баров отображения индикатора. Большое количество баров может существенно замедлить работу торгового терминала. SignalAlert - Alert-сигнал тренда. SignalSound - Звуковой сигнал тренда. Сигнал будет звучать при превышении гистограммой величины уровня 15.
Правила для подтверждения входа в позицию Зеленая гистограмма - ВОСХОДЯЩИЙ ТРЕНД
FREE

Этот индикатор был модифицирован согласно 'Пути черепахи'. Он формирует канал на основе цены открытия и значений ATR текущего бара. Turtle ATR Channel можно использовать для помощи при определении состояния перекупленности и перепроданности рынка.
Расчет Верхний канал = Open + r1*ATR Нижний канал = Open - r2*ATR Где: Open - цена открытия текущего бара. ATR - значение ATR текущего бара. r1, r2 - коэффициенты ATR.
Входные параметры ATR Period - период индикатора ATR, по умолчанию - 14. ATR Up
FREE

Покупайте и продавайте сигналы с помощью Гистограммы MACD. Интерфейс прост и прост для понимания. Вы можете перзонализировать индикатор несколькими способами в соответствии с его визуальным стилем или, что еще более важно, его настройкой параметров для обнаружения рыночных сигналов. Используя опцию Мультипликатора в меню, можно увеличить период индикатора, хотя рекомендуется использовать настройки по умолчанию.
FREE
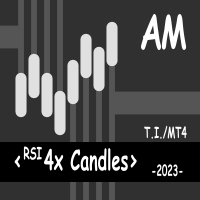
Представленный индикатор отображает в виде цветных свечей сигналы пересечений четырех индикаторов RSI разных периодов. Свеча окрашивается в красный цвет когда значения первого индикатора меньше значений второго индикатора и значения третьего индикатора меньше значений четвертого индикатора. Свеча окрашивается в синий цвет когда значения первого индикатора больше значений второго индикатора и значения третьего индикатора больше значений четвертого индикатора. В других случаях свечи окрашены в се
FREE

Демо-версия Advanced Arrow indicator Работает только на GBPJPY, полная версия работает на всех валютных парах.
Особенности Он наглядно показывает точки входа в виде значка готовности (Buy / Sell) и стрелки (Buy / Sell) после закрытия свечи, а также линию SL и до 4 линий TP; Как только лини SL-TP будут показаны стрелками, они остаются неизменными до изменения сигнала; Это исторический индикатор; Не перерисовывается;
Настройки индикатора Indicator Version : версия индикатора, V5 или V6; TP 1
FREE

I make this indicator to help you for setting effective stoploss and getting more signals from following trends. This indicator helps to tell the trends and sideway, when 2 lines stand above of blue cloud, it means uptrend. When 2 lines stand above red cloud, it means down trend, the other else, it means sideway market. For taking order, you have to wait the arrows. You also need to see the cloud position, if the cloud's res, you have to wait the yellow arrow for selling order. If the cloud's bl
FREE

This indicator alerts you when/before new 1 or 5 minute bar candle formed. In other words,this indicator alerts you every 1/5 minutes. This indicator is especially useful for traders who trade when new bars formed.
*This indicator don't work propery in strategy tester.Use this in live trading to check functionality.
There is more powerful Pro version .In Pro version,you can choose more timeframe and so on.
Input Parameters Alert_Or_Sound =Sound ----- Choose alert or sound or both to not
FREE

Данный индикатор представляет собой отображение элементов торговой системы, описанной Александром Элдером. Индикатор использует идею открытия сделок на продажу в момент падения значений MACD или OsMA ниже нуля или наоборот, открытие сделок на покупку в момент роста значений таких индикаторов выше нуля, при совпадении такого падения или роста с направлением скользящей средней. Толстая и тонкая цветные гистограммы соответствуют значениям MACD и OsMA. Если гистограмма больше 0, значение индикатора
FREE

OCTO TACK TREND INDICATOR
Summary/Description: Trend indicator showing signals to execute orders in favor of the current trend Get ready to have the best trend indicator you've ever tried. No repainting in any way, guaranteed It generates clear signals and always in favor of the trend (see screenshots) You just have to wait for the alert to indicate it and earn pip Are you tired of indicators that never work? Here we have the solution, try the free version and if you want to have more signals
FREE

Индикатор в виде гистограммы показывает восходящий и нисходящий тренды. Данный инструмент рекомендуется использовать в качестве фильтра. Основываясь на его показаниях можно отследить начало, окончание и продолжение тренда. Этот дополнительный инструмент подойдет для любой торговой системы. Параметры Period — период индикатора; Bars — количество баров для отображения на истории.
FREE
Индикатор линий сил валют (Currency Strength Lines, CSL) - это весьма полезный инструмент как для начинающих, так и для опытных трейдеров. Индикатор способен рассчитывать силы одиночных валют и отображать их на графике, чтобы вы могли видеть тренд и замечать торговые возможности. Данная демо-версия показывает значения только по AUD, NZD, CAD и CHF , полная версия доступна здесь: https://www.mql5.com/ru/market/product/22398
Как она работает? Индикатор CSL даст вам возможность выбора одного из ч
FREE

Power Trend Free - индикатор, показывающий "силу" тренда на выбранном периоде.
Входные параметры Индикатор имеет три входных параметра: Period - положительное число больше единицы, показывающее, по какому количеству свечей строятся показания. Если ввести единицу или ноль, ошибки не будет, но отрисовываться индикатор не будет. Applied Price - стандартный набор "Применить к:", обозначающий, по каким данным будет рассчитываться индикатор: Close - по ценам закрытия; Open - по ценам открытия; High
FREE
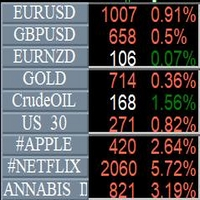
Info Symbol is an indicator that will allow you to monitor up to 9 different markets. Just enter the name of the symbols and the number of decimal places. With a single click you can switch from one market to another, it will take two clicks for a chart with an expert attached to it. With this indicator, you will know how many points or pips that the monitored markets have gained or lost since the beginning of the day and you will also have the percentage.
FREE
Представленный индикатор подает сигналы о выходе цены за пределы Keltner channel, а также о возращении цены в канал. Keltner channel — технический индикатор, состоящих из двух полос над и под скользящей средней ценового показателя, ширина которых определяется как доля от среднего изменения цены за период. Автором данной методики является Chester W. Keltner, опубликовавший её в своей книге How To Make Money in Commodities в 1960 году. Keltner channel подвергался широким исследованиям и модификац
FREE
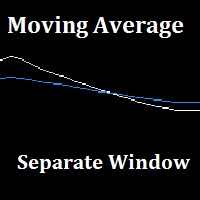
"Separate Moving Average" is a custom indicator made from the combination of 2 moving averages in a different window (the indicator window) for the goal of removing the clutter from the price chart, the indicator also has arrows to show the moving average cross either long or short. All the moving average parameters are customizable from the indicator input window.
FREE

HJZHI88888888888888888888888888888888888888888888888888888888888888888888888888888888888888888888888888888888888888888888888888888888888888888888888888888888888888888888888888888888888888888888888888888888888888888888888888888888888888888888888888888888888888888888888888888888888888888888888888888888888888888888888888888888888888888888888888888888888888888888888888888888888
FREE
Данный индикатор идентифицирует текущий тренд, позволяя трейдеру захватывать максимум сильных движений цены используя отложенные ордера. Настройки индикатора просты, а его применение интуитивно понятно. Линия выступает сильным уровнем поддержки/сопротивления в зависимости от ее расположения относительно цены. Отдельные точки индикатора отмечают краткосрочный уровень поддержки/сопротивления, ниже или выше (с учетом спреда) значений которого устанавливаются отложенные приказы на вход в рынок. Инд
FREE

Целью этой новой версии стандартного MT4 индикатора, входящего в поставку платформы, является отображение в подокне нескольких таймфреймах одного и того же индикатора. См. пример, приведенный на рисунке ниже. Однако индикатор отражается не как простой индикатор MTF. Это реальное отображение индикатора на его таймфрейме. Доступные настройки в индикаторе FFx: Выбор таймфрейма для отображения (от M1 до MN) Установка ширины (количество баров) для каждого окна таймфрейма Всплывающее оповещение/звуков
FREE

USD INDEX
The Currency Index Project is ONE part of a thorough Forex study. Many people do not know the theoretical basis that drives currency exchange rates to move on the market. With this set of tools you will be able to have a more complete view of the entire market by analyzing not only the single currency of an exchange, but all the exchange rates that make up that currency by looking at a single window!
The indicator faithfully represents the real index of a single currency present in
FREE
Binary Options Assistant (BOA) COLD Signals Indicator provides signals based on Amalia Trader Binary Options Strategy. Indicators: Keltner & Stochastic
Stop missing trades, stop jumping from chart to chart looking for trade set-ups and get all the signals on 1 chart! U se any of the BOA Signals Indicator with the Binary Options Assistant (BOA) Multi Currency Dashboard .
All BOA Signal Indicator settings are adjustable to give you more strategy combinations. The signals can be seen vis
FREE

Arlene Sessions Background is an indicator that draws colored vertical background on the chart depending on your session. You can see the version 1 here: https://www.mql5.com/en/market/product/68822 You can see more of my publications here: https://www.mql5.com/en/users/joaquinmetayer/seller If you only want to paint a session on your chart, you must set the color "none" to deactivate it.
FREE
Данный индикатор представляет собой осциллятор построенный по принципу классического Momentum. Индикатор входит в серию индикаторов - T3 Line AM, T3 Momentum AM, T3 Candles AM, T3 Signal AM .
Индикатор представляет собой разницу текущей цены и ценой некоторое количество периодов назад. Отличием от классического индикатора Momentum является предварительное сглаживание цен по методу T3. Использование индикатора: Следует принимать во внимание что значения индикатора на нулевом баре (который е
FREE

My Account Brokers Details This indicator displays the account data and broker terms regarding its operation. For example, broker name, account number, financial leverage, account currency, automatic trading approval, minimum lot, lot step, maximum number of lot, margin call, stop out and many other important data. It is easier to display such data on the chart in one moment with a click of the mouse, than to look for it in the contract or call the broker.
FREE

Introducing Austin RSI—an innovative indicator designed to elevate your forex trading strategy by applying moving averages to the MetaTrader 4 indicator, RSI.
The Relative Strength Index (RSI) is a popular momentum oscillator that measures the speed and change of price movements. It oscillates between 0 and 100 and is used to identify overbought and oversold conditions in the market. Traders often use RSI to gauge the strength of price movements and anticipate potential trend reversals.
Aus
FREE
MetaTrader Маркет - единственный магазин, где можно скачать демоверсию торгового робота и подвергнуть его проверке и даже оптимизации на исторических данных.
Прочитайте описание и отзывы других покупателей на заинтересовавший вас продукт, скачайте его прямо в терминал и узнайте, как протестировать торгового робота перед покупкой. Только у нас вы можете получить представление о программе, не заплатив за неё.
Вы упускаете торговые возможности:
- Бесплатные приложения для трейдинга
- 8 000+ сигналов для копирования
- Экономические новости для анализа финансовых рынков
Регистрация
Вход
Если у вас нет учетной записи, зарегистрируйтесь
Для авторизации и пользования сайтом MQL5.com необходимо разрешить использование файлов Сookie.
Пожалуйста, включите в вашем браузере данную настройку, иначе вы не сможете авторизоваться.