适用于MetaTrader 4的免费技术指标 - 11

量子擺動 1.什麼是量子擺動? 該指標基於量子數學,以高概率和方向精度顯示未來價格水平。級別顯示為進行交易決策的區域;它們明確定義了具有最小和最大利潤的訂單的窄範圍。該指標顯示不同時期的未來交易區H1,H4,D,W。它還顯示量子振盪而不參考時間。適用於所有交易工具。外匯市場,股票市場,期貨市場和商品市場將改變為MT4交易平台上使用的所有工具。 2.量子擺動的優點和不同之處: 在線汽車打造優質交易平台。 交易決策區域的構建和顯示的準確性。 以未來時態展示貿易區,帶領您領先一步。 易於使用和應用。 聊天電報中頻道的在線支持 https://t.me/nest8 每日評論和直播YouTube頻道 https://www.youtube.com/watch?v=kzapOX0cGfc&feature=youtu.be 2.交易策略。 指標描述,交易策略,調整和交易計劃將在YouTube頻道上詳細顯示,並在聊天電報中進行討論。
FREE

本产品接收指标/信号工具的信息,在满足特定条件时显示箭头或通知。
例如,当MA25和MA50交叉、SAR反转、MACD改变正负值或收盘价穿过布林线时,都会显示箭头和通知。
具体配置请参考示例设置图。
详细手册和配置文件:
https://www.mql5.com/en/blogs/post/755082
免费版本也可供下载。
箭头可以以多种配置显示,组合方式无限,任您想象。
如果您在设置与信号工具和指标的链接时遇到困难,请联系我们寻求帮助。
我们还可以向您的智能手机、电子邮件、Slack、Line、Discord等推送通知,最多添加8个参数,或根据您的要求单独链接到指标。您可以将其用作信号工具的补充或事件的通知功能。 https://www.mql5.com/zh/users/mt4kabukimono
FREE
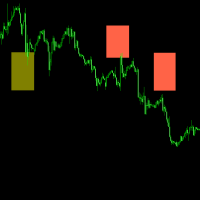
用这个指标,应用于货币兑非常好用,比如欧元、英镑、澳元、纽元、加拿大元、瑞士法郎 可以很容易找到的上下区间 国际上标准的大平台都很好用,不建议使用小平台.推荐瑞讯银行.或者EXNESS.
瑞讯开户链接: https://trade.swissquote.ch/signup/public/form/full/fx/com/individual?lang=cn&partnerid=daf9af43-2f95-443e-86c5-89ce1ab2bd63#full/fx/com/individual/step1 EX开户链接: https://one.exness.link/a/t2v0o2v0 只要稍微懂一点交易,用上这个指标的辅助,就如鱼得水 这个指标能告诉我们方向和价格区间 红色是做空 深黄色是做多 这个指标是本人独立开发,任何问题都能联系我,可以留言,也可以在TG找我。 用法: 行情遇到色块会回头 上方色块做跌 下方色块做涨 下单位置在色块边缘及色块中央 止损位置在色块外 止盈位置无法固定,参考前面的行情。
FREE

AIS MT4 INDICATOR 5 ALL INCLLUSIVE SET
!!!!!!!!!!!!!!!!!!!!!!!!!!!!!!!!!!!!!!!!!!!!!!!!!!!!!!!!!!!
!
! ATTENTION ! LIMITATION OF FREE OFFER PERIOD IS IMPLICIT !
!
!!!!!!!!!!!!!!!!!!!!!!!!!!!!!!!!!!!!!!!!!!!!!!!!!!!!!!!!!!!
GUIDE
CHAPTER 1 IMPORTANT INFORMATION <1> THIS INDICATOR IS ONE OF THE SERIES OF NEW AIS INDICATORS AIS MT4 INDICATOR 1 =ADVANCED CLASSIC= AIS MT4 INDICATOR 2 =MULTIFRAMES= AIS MT4 INDICATOR 3 =LINES= AIS MT4 INDICATOR 4 =MARKET PROFILES= AIS MT4 INDICATOR 5 =ALL IN
FREE

ATR Volatility plots the ATR-based volatility, and triggers alerts when it crosses user-defined upper and lower thresholds (purple and tan lines, please see screenshots). Circles are painted when ATR volatility crosses either above the upper threshold, or below the lower threshold. This is a small tool custom-built by our group, by specific request of one of our customers. We hope you enjoy! Do you have an indicator you would like to see designed? Feel free to send us a message! Click here for m
FREE

Multi timeframe fractal indicator which shows the higher timeframe's fractal point on lower timeframes.
Parameters Fractal_Timeframe : You can set the higher timeframes for fractals. Maxbar : You can set the maximum number of candles for the calculations. Up_Fractal_Color, Up_Fractal_Symbol, Down_Fractal_Color, Down_Fractal_Symbol : Color and style settings of the fractal points. Extend_Line : Draws a horizontal line from the previous fractal point until a candle closes it over or a user-speci
FREE

RoundNumbers indicator is a simple and powerful psychological price levels. Trader usually use these levels as a Support and Resistance (SnR). Indicator Input: Levels - Numbers of levels drawn on chart. Default 30 levels. BoxSize - Box size drawn on each levels, indicate buffers around levels. Default value 1pips (10point) above and below each levels. ZoneSize - Distance between each levels, default value 10pips (100point). Style & Colours - User inputs customization.
For MT5 version, please r
FREE

在您的平台上提供新版 MT4 标准指标的目的,是在子窗口里显示多时间帧的相同指标。参看下面例中的图片。 但是它的显示不像简单的多时间帧指标。它是指标在其时间帧的实际显示。 在 FFx 指标里提供了一些选项: 选择显示的时间帧 (M1 至 每月) 定义每个时间帧箱体的宽度 (柱线数量) 提示弹出/声音/邮件/推送 (价格穿越中带 和/或 上边/下边带) 直接在图表上激活/停用提示 修改所有颜色 ... 当然还有所有标准指标的常用设置 如何设置提示: 在弹出的参数设置 : 选择您希望的提示和模式 (弹出、声音、邮件或推送通知) 之后在图表上 : 选择铃铛图标 (双击) 然后将其拖拽到任意位置。在下一个报价来临,它将恢复它的原始位置,但用不同颜色信号改变它的状态。红到绿意为它现在已激活 … 绿到红意为它现在未激活。
FREE

ON Trade 启明星蜡烛图指标 启明星蜡烛图模式是一个强大且直观的蜡烛图模式,可以为市场情绪和潜在趋势反转提供有价值的见解。它以蜡烛的一端具有非常小或不存在的影线(上下影线),而另一端有一个延伸到当前趋势方向的长实体为特点。该模式表示买家和卖家之间的强烈失衡,暗示市场动力明显单边。 特点和优势: 清晰的市场情绪: 启明星蜡烛清楚地描绘了主导市场情绪。牛市(白色)启明星表明从开盘到收盘价格有强劲的买入压力,而熊市(黑色)启明星表示有强烈的卖出压力。 趋势延续或反转: 根据背景,启明星模式可以信号趋势延续或潜在趋势反转。当它们出现在长时间趋势后时,可能表示趋势将继续。相反,出现在支撑或阻力区域附近的启明星蜡烛可能暗示潜在反转。 简单可靠: 启明星模式在价格图表上相对容易识别,并且与其他技术分析工具结合时可以提供可靠的信号。 如何使用启明星蜡烛图指标: 识别启明星模式: 该指标在您的价格图表上识别和标记启明星模式。它突出显示牛市(向上)和熊市(向下)启明星模式,使其易于发现。 与其他指标确认: 尽管启明星模式本身可以提供有价值的见解,但考虑使用其他技术指标或图表模式来确认信号,以提高准确
FREE
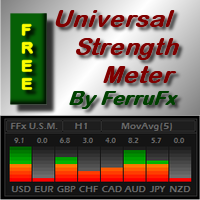
PRO version is available here: https://www.mql5.com/en/market/product/12648 FFx Universal Strength Meter is more than a basic strength meter. Instead of limiting the calculation to price, it can be based on any of the 19 integrated strength modes + 9 timeframes. With the FFx USM, you are able to define any period for any timeframe. For example, you can set the dashboard for the last 10 candles for M15… Full flexibility! Very easy to interpret... It gives a great idea about which currency is weak
FREE

В основе индикатора TDI лежат следующие индикаторы: RSI, Moving Average, Bollinger bands, но основным из них нужно выделить RSI, весь расчет индикатора завязан от его значений.
Зеленая линия (линия RSI) – сглаженные простой (по умолчанию) скользящей средней значения индикатора RSI, период сглаживания 2.
Красная линия (сигнальная линия) – сглаженные простой (по умолчанию) скользящей средней значения индикатора RSI, период сглаживания 7.
Синие линии – индикатор Bollinger bands по умолчанию п
FREE

O indicador TRIX, conforme o utilizado pelo grafista Didi Aguiar.
Este indicador é composto pela Triple Exponencial Average (TRIX), que neste setup é utilizada com o período 9, e um sinal de média simples do próprio indicador que é utilizado com o período 4.
Parâmetros: Período: 9 Sinal: 4
Os demais indicadores do sistema operacional de Didi Aguiar são:
Bollinger: período 8, desvio 2 ADX: período 8 DidiIndex com médias simples, períodos: 3, 8 e 20 Estocástico: 8, 3 3
FREE
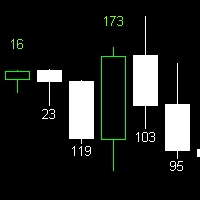
Candle Size Indicator Explore the candle size using this convenient indicator. It works across various timeframes, providing valuable insights for technical analysis. Key Features: Display the size of the candle after configuring the indicator. Compatible with all timeframes. The size of the candle is a significant metric in technical analysis, offering insights into market strength and volatility. This indicator enables clear and accurate visualization of candle sizes on your chart. Utilize thi
FREE

RSI Signal Scanner The primary trend of the stock or asset is an important tool in making sure the indicator's readings are properly understood. For example, some of the technical analysts, have promoted the idea that an oversold reading on the RSI in an uptrend is likely much higher than 30%, and an overbought reading on the RSI during a downtrend is much lower than the 70% level. This indicator notifies you of RSI important levels breakouts (30% and 70%) by searching among the symbols and chec
FREE

不同货币对的行为是相互关联的。 Visual Correlation 指标允许您在一张图表上显示不同的工具,同时保持比例。 您可以定义正相关、负相关或无相关。
有些仪器比其他仪器更早开始移动。 这样的时刻可以通过叠加图来确定。
要在图表上显示工具,请在 Symbol 字段中输入其名称。
亲爱的朋友! 我们提请您注意视觉相关性指标。 主要优点及其工作原理: 不同貨幣對的行為是相互關聯的。 Visual Correlation 指標允許您在一張圖表上顯示不同的工具,同時保持比例。 您可以定義正相關、負相關或無相關。
有些儀器比其他儀器更早開始移動。 這樣的時刻可以通過疊加圖來確定。
要在圖表上顯示工具,請在 Symbol 字段中輸入其名稱。 Version for MT5 https://www.mql5.com/zh/market/product/109155
FREE

This is an implementation of the market cycle indicator described by Raghee Horner in the book "Forex Trading for Maximum Profit" . The current state of the market can be determined by analyzing the inclination angle of the exponential moving average (EMA) running on a period of 34 bars. If the EMA inclination is defined as the direction of the hour hand on the dial from 12 to 2 hours, then an uptrend is considered to be present; from 2 to 4 hours, the market consolidates; from 4 to 6 hours, a d
FREE

In the world of finance, correlation is a statistical measure of how two securities move in relation to each other. Correlations are used in advanced portfolio management. This indicator measures how different securities move in relation to a reference one, thus making portfolio management easier. [ Installation Guide | Update Guide | Troubleshooting | FAQ | All Products ] Avoid concurrent trades in highly correlated instruments Find trading opportunities among highly correlated instruments Cor
FREE

ITS FREE I Recommend www.CoinexxBroker.com as a great broker and the one I personally use Asia session 1:00 to 9:00 (6pm est to 2 am est) Eur means London Session 10:00 to 18:00 (3 am est to 11 am est) USA means New York Session 15:00 to 23:00 (8 am est to 4 pm est) Session indicator highlights the start of each trading session. You can show all sessions or edit the settings to only show the hours you want highlighted (Asia) means Asian Session ,(Eur) means London Session , (USA) means New
FREE

MACD is well known indicator that still can be use for prediction where price will go next few minutes, hours or even weekly With colored bar of Macd, your eyes can easily catch when color is changed based what market price movement to find any early trend on market. here is the parameter of the indicator: TF_MACD , default is 1 Hour , this mean you can see clearly MACD of 1 Hour TimeFrame on Lower TimeFrame. InpPrice , default is Price Close , this is original MACD parameter from Metaquotes st
FREE

Rainbow MT4 is a technical indicator based on Moving average with period 34 and very easy to use. When price crosses above MA and MA changes color to green, it’s a signal to buy. When price crosses below MA and MA changes color to red, it’s a signal to sell. The Expert advisor ( Rainbow EA MT4) based on Rainbow MT4 indicator, as you can see in the short video below is now available here .
FREE
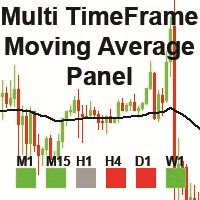
The "MTF Moving Average Panel" indicator is more of a helping tool than an indicator, it serves to help traders to spot the trend direction without having to change the timeframe and check all timeframes. It is best used with other indicators and signals, to help filter the signals according the trend based on multiple timeframes.
Indicator inputs : - Moving Average period : The period for the Moving Average. Default is set to 50 periods. - Moving Average method : The method of calculation of
FREE

This indicator displays each bar's volume in points as a histogram. The second version of the indicator. Now it is represented as an oscillator. It is more informative and functional. At that it does not load the main chart. GitHub It displays: bar's volume in points as a histogram (buffer 0) average value of the volume for the whole period (buffer 1) bars upper than the client average value with another color (buffer 2) average value of the amount of bars set by a user (buffer 3) Also: setting
FREE

Never miss a trend change again! This indicator uses various calculation methods based on price action to detect changes in the direction of the trend. It can be used on high timeframes (from H1 to D1) and is most suitable for H4 and Daily timeframe. This indicator is compatible with all broker symbols (forex, indices, CFD, commodities, crypto…). It is also possible to open the indicator on several charts to follow several symbols at the same time. In addition, you don't have to stand by your P
FREE

The indicator defines the Bullish and Bearish Engulfing Bar. The pattern has greater reliability when the open price of the engulfing candle is well above the close of the first candle, and when the close of the engulfing candle is well below the open of the first candle. For an engulfing bar to be valid it must fully engulf at least one previous bar or candle - includes all the body and the wick. The engulfing bar can engulf more than one bar as long as it completely engulfs the previous bar.
FREE

因为风格很重要
我知道每次都要点击属性来改变蜡烛的颜色、背景是浅色还是深色,以及放置或删除网格是多么令人厌烦。这里有一个一键式的解决方案。 三个可定制的按钮可以选择交易者想要的蜡烛样式。 一个按钮可以在白天和夜晚模式之间切换。 一个按钮可以在图表上显示或隐藏网格。 ***** 在设置中,你可以选择按钮在屏幕上的显示位置*****。
请考虑查看我的其他产品 https://www.mql5.com/en/users/javimorales.fer/seller
检查MT5版本: https://www.mql5.com/en/market/product/69070
什么是RSI指标?
RSI显示为一个震荡器,可以从0到100进行测量。该指标由J.Welles Wilder Jr.开发,并发表在他1978年的开创性著作《技术交易系统的新概念》中。它被认为是低于20的超卖和高于80的超买。RSI提供信号,告诉交易者在货币/股票/工具超卖时买入,超买时卖出。
如有任何问题,请随时与我联系。
作者简介
Javier Morales,交易算法的创始人。
FREE

該指標在一張圖表上顯示兩個不同的貨幣對,旨在簡化顯示的信息,
能夠使用終端機中幾乎所有可用的工具(不僅是貨幣對,還包括金屬和原料)。 對任何貨幣對使用視覺關聯方法的特點 子符號。 貨幣對以彩色蠟燭顯示在螢幕上。 這是同一相關對。 鏡像。 輔助貨幣。 此指標反映了兩種類型的相關性。
設定
子交易品種 = "美元兌瑞郎"; BullBarColor = 橘紅; BearBarColor = 黃色; 顏色網格顏色=白色; 鏡像=假;
The indicator displays two different pairs on one chart, designed to simplify the displayed information, Capable of working with almost all instruments available in the terminal (not only currency pairs, but also metals and raw materials). Feature of using a visu
FREE

When prices breakout resistance levels are combined with Larry Williams' Percent Range oscillator "WPR" breaks out its historical resistance levels then higher chances emerges to record farther prices. It's strongly encouraged to confirm price breakout with oscillator breakout since they have comparable effects to price breaking support and resistance levels; certainly short trades will have the same perception. Concept is based on find swing levels which based on number of bars by each side to
FREE

This indicator scans for you up to 30 trading instruments and up to 8 timeframes for occurrences of the high probability reversal patterns: Double Tops/Bottoms with fake breakouts . Please read also the blog post " Professional Trading With Double Tops/Bottoms And Divergences! " which explains the concepts behind the ULTIMATE Double Top/Bottom indicator and how you can use a professional top-down approach. This FREE Version of the Scanner scans only EURUSD and GBPUSD. The full version of the sca
FREE

Bollinger Bands Breakout Alert is a simple indicator that can notify you when the price breaks out of the Bollinger Bands. You just need to set the parameters of the Bollinger Bands and how you want to be notified.
Parameters: Indicator Name - is used for reference to know where the notifications are from Bands Period - is the period to use to calculate the Bollinger Bands Bands Shift - is the shift to use to calculate the Bollinger Bands Bands Deviation - is the deviation to use to calculate
FREE

Concept
Market arranges in Time upcoming Phases according to the present Results of its Interest. Directing Modulations are an Interaction of immanent Periods, which show in Reference to Time cyclic Activity and to Price leveling Activity. PointZero is a projecting Price Mask of this Concept of Time and Price and categorizing developed Price Movements related to their own Range: how far moved ? indicating their Status by marking special Events: when which Action ? setting the Situation in a fu
FREE
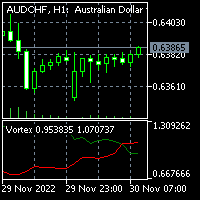
To download MT5 version please click here . - This is vortex indicator. - It is used to detect trend strength and direction. - It consists of two line(buffers). ==> VIM and VIP - There are three types of signals related to this indicator: 1. crossing VIM and VIP 2. threshold on distance between VIP and VIM 3. VIP above VIM vice versa. - This is a non-repaint indicator with light processing.
FREE
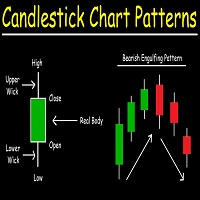
Please leave 5 Stars to me
Candlestick Patterns Scanner is professional indicator that will assist and alert you to identify candlestick patterns on meta trader 4 charts whenever a pattern appears on the chart. In financial technical analysis , a candlestick pattern is a movement in prices shown graphically on a candlestick chart that some believe can predict a particular market movement. The recognition of the pattern is subjective and programs that are used for charting have to
FREE

The Rayol Code Hour Interval Lines indicator was designed to assist your trading experience. It draws the range of hours chosen by the user directly on the chart, so that it enables traders to visualize price movements during their preferred trading hours, providing traders a more comprehensive view of price movements and market dynamics. This indicator allows the user to choose not only the Broker's time, but also the Local time. This way, the user no longer needs to calculate local ti
FREE

介绍我们的新指标:[ON Trade Breakout Zone] 对所有交易者而言简单而强大的市场分析工具! 适用于专业人士和初学者 您准备激发您的交易策略吗?我们最新的指标旨在简化市场分析,并赋予各个层次的交易者力量。无论您是经验丰富的专业人士还是初学者,[ON Trade Breakout Zone] 是您解锁市场潜在利润的关键。 如何使用 [ON Trade Breakout Zone]: 每天,这个智能工具都会使用其先进的算法在您的图表上轻松绘制区域。以下是如何充分利用它的方法: 区域识别: [ON Trade Breakout Zone] 准确识别图表上的关键区域,让您轻松发现潜在的交易机会。 交易执行: 等待价格移动到绘制区域的任一侧。 如果价格上涨超过购买线,请考虑输入购买交易,目标设置在上部绘制的水平。 如果价格下跌到卖出线以下,请考虑输入卖出交易,目标设置在下部绘制的水平。 风险管理: 在中心线上设置止损水平,以实现有效的风险管理。 资金管理: 遵循合理的资金管理规则,以优化您的交易策略。 独立使用: ON Trade Breakout Zo
FREE

The ' Average Bar Chart ' indicator was created to showcase the traditional Heiken Ashi calculation as an exotic charting style. This indicator is known for reducing chart noise for a smoother price action. A dditional indicators are recommended
Key Features Candlesticks for OHLC are removed from the chart. Average bars may be shown as complete bars without tails. All functionality and features of this exotic chart are inputs.
Input Parameters Chart Timeframe = PERIOD_CURRENT; - period to s
FREE

Defines extremes. This indicator consists of two parts. The first draws lines on the chart indicating low volatility in relative daily market activity. The second is responsible for determining the extremum and gives signals to buy or sell. This system is suitable for all instruments. It is recommended to use a timeframe from m15 to h4. Before using, you need to choose the settings for yourself. Configure lines deviation. Specify volatility coefficient. Advantages The indicator does not repaint
FREE

Advantages: Based on classic indicators - ATR, Moving Average Determines the trend / flat in the market by coloring the histogram with the appropriate color Arrows indicate confirmed signals It is an excellent filter for channel strategies (by extremes)
Settings:
Наименование Описание настройки Period of Flat Detector Number of bars / candles for analysis Period of EMA Period of EMA (Moving Average) Period of ATR Period of ATR (current timeframe) Coefficient of deviation Coefficient of devia
FREE

The indicator has combined 5 popular strategies. Draws an arrow after confirming a signal for the selected strategy. There are signal alerts. Doesn't redraw its values. I recommend watching my advisor - Night Zen EA
5 strategies. The main line crosses the signal line. The main line crosses the signal line in the oversold (for buy) / overbought (for sell) zones. The main line enters the oversold (for sell) / overbought (for buy) zones . The main line comes out of the oversold (for buy ) / ove
FREE

The indicator searches for and displays Doji candlesticks on the chart and signals the appearance of such a candle. The direction of the signal depends on the direction of the previous candles, as the Doji signals a reversal or correction. In addition to the possibility of signaling, the power of the reversal is graphically shown (the more green, the more likely growth, the more red, the price will fall). In the indicator settings, you can change the parameters of the Doji candlestick, the closu
FREE

TH3ENG CURRENCY STRENGTH SCANNER The best currency strength reader based on more than 4 excellent modes, based on Price action and Volume with various algorithms. This indicator reads all pairs data to measure and find the best results of all currencies and arrange it in a separated dashboard panel.
You can find the strongest currency and the weakest currency, then trade on them pair. NOT COPLICATED NOT REPAINTING NOT LAGING
Input Parameters
=== SYSTEM SETTING === Calc. Mode ==> Calculatio
FREE

Bigger chart labels would allow the user to be entirely aware of which chart he/she is on. Each chart window is unique, containing different patterns and economic motives so acknowledging the chart window would be absolutely essential! There are well known Economic Time Zones included in clear view, by choice! Simple does it! Use your computing mouse scroller, clicking with the right finger on the label, in order to customize the label properties. From there, choose your preferred color, fon
FREE

If you trade or wish to trade the popular HLHB Trend-Catcher System, then this indicator is for you! It detects when the HLHB system entry rules are met and sends out an alert in the form of notifications to your mobile phone and to your pc. By automatically sending you notifications, this indicator lessens your trading work load as you don't have to sit in from of your pc all day checking all the chats for when the entry rules are met. This indicator does all the dirty work for you. When the si
FREE

Trading with the help of the MACD indicator has become even more convenient. Flexible settings will help you choose what you really need in your trading. Use the strategy that you need - the indicator uses 3 strategies. Download the demo right now! I recommend watching my advisor - Night Zen EA Subscribe to my telegram channel, link in my profile contacts - my profile See also my other products on mql5.com - my products Advantages of the indicator: In this indicator, the interpretation of th
FREE

加入 考拉交易解决方案频道 在MQL5社群中,获取有关所有考拉产品的最新信号和新闻,加入链接如下: https://www.mql5.com/en/channels/koalatradingsolution 描述 :
我们很高兴推出基于外汇市场 (PSAR) 中专业和流行指标之一的新免费指标 该指标是对原始抛物线 SAR 指标的新修改,在专业 SAR 指标中,您可以看到点和价格图表之间的交叉,这交叉不是信号,而是谈论运动结束的可能性,您可以从新的蓝点开始买入,并在第一个蓝点之前设置止损,最后您可以在点交叉价格图表时退出。
如何打开买入或卖出信号? 通过第一个蓝点打开买入交易并通过第一个红点打开卖出交易
正确的止损在哪里? 安全止损可以在第一个点上,(在第一个蓝点的买入情况下和在第一个红点的卖出情况下)
正确的止盈在哪里? 止盈可以根据止损距离和RR进行调整,所以我的建议是2 RR,是止损的2倍
如果我们盈利但仍未达到 tp,那么退出点在哪里? 第一个退出警报可以在点和价格图表之间交叉。
该指标何时释放警报? 一旦新的点出现在新的方向,指标就会释放警报
FREE

21 simple moving average ( All Type of 21 MA River ) 51 simple moving average
Long Entry Upper 51 MA and above the 21 River Middle channel. Long Only Above Green Line (Market Opening Line) Short entry Below the lower 51 MA and below the 21 lower channel. Short Only Below Green Line (Market Opening Line)
Exit position
Initial stop loss is 20 pips below (for buy) or above (for sell) Target : Next level as per indicator Profit Target ratio 1:1.2
Download Template : https://drive.google.c
FREE
CandleCloseCountdown is technically an indicator. Its purpose is to show the time a candle has left on a given timeframe before it closes. All possible time frames of MetaTrader 4 are supported. The way the remaining time is displayed depends on the selected timeframe. For M1 only the seconds are displayed. Above that at all timeframes up to H1 the remaining minutes and seconds are displayed and so on for timeframes above D1.
FREE

Candlestick Oscillator is a truly unique Oscillator that uses the concepts of within candlestick trading called the Record Session High. This is a method of analysing candlesticks to gauge when a trend might be wearing out and therefore ready for reversal or pause. We call it a record session high when we get 8 or more previous candles that have higher closes. We call it a record session low when we get 8 or more previous candles that have lower closes.
We don't rely on the typical Oscillatio
FREE
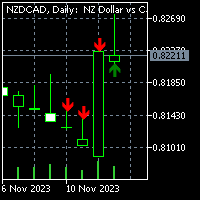
For MT5 version please click here . Introduction Most traders use candle patterns as a confirmation tool before entering a trade. As you know there are lots of candle patterns out there. However I realized most of them can be generalized in simple rules. So I developed my own candle pattern(Although I cannot say for sure this is mine). pattern description The pattern consists of three consecutive candles. This is true for most of the patterns out there (considering there is a confirmation nec
FREE

Key Level Key Level is a MetaTrader 4 Indicator that uses a proprietary algorithm based on Price Retracement/Breakout Method to show the Entry-Line on your trading.
Instead, it analyzes data of market and identify entry points and opportunities. (Price Retracement / Price Breakout)
It's also a trading tool that be used to practice and enhance your manual trading skills.
Key Level is an amazing tool for Scalping Trader. It also a trading tool that be used to practice and enhance your manual t
FREE

Double Exponential Moving Average ( DEMA ) is a moving average (MA) that gives the most weight to recent price data.Like exponential moving average (EMA), it is more reactive to all price fluctuations than a simple moving average (SMA) and so DEMA can help traders to spot reversals sooner, because it is faster responding to any changes in market activity. DEMA was developed by Patrick Mulloy in an attempt to reduce the amount of lag time found in traditional MAs. ( TASC_Feb. 1994 ). DEMA can al
FREE

This indicator plots another symbol on the current chart. A different timeframe can be used for the symbol, with an option to display in multiple timeframe mode (1 overlay candle per several chart candles). Basic indicators are provided. To adjust scaling of prices from different symbols, the overlay prices are scaled to the visible chart price space.
Features symbol and timeframe input MTF display option to vertically invert chart, eg overlay USDJPY, invert to show JPYUSD
data window values
FREE
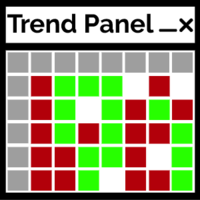
趋势面板是一个简单方便的工具,它将使用用户选择的十对显示时间帧 M1 - D1 的已确认趋势方向。
该指标旨在将方向确认添加到任何策略/模板中,然后还可以作为一个干净的交互式界面快速将图表更改为不同的货币对或时间范围。 群聊: https://www.mql5.com/en/users/conorstephenson 请在购买后与我联系以获取设置建议和免费专家顾问! 我的产品仅在 MQL5 上出售 ,如果您在其他任何地方看到此产品,那是仿制品。不要被愚弄 。 主要特点 清洁图表面板以快速帮助确定时间范围内的趋势方向。 交互功能。 更改图表蜡烛的颜色 - 轻松查看当前和过去的趋势。 点击配对和时间框架按钮可更改当前打开的图表。 单击图表上的面板并将其拖动到最适合您的模板设置的位置。 选择要显示的 10 对。 编辑面板中使用的颜色。 将与外汇对、指数、股票、加密货币... 提示新趋势开始的警报功能。 建议 当面板中的所有一个垂直列都是相同的颜色时,一对可以被认为是强烈趋势。 与策略/模板一起使用以获得时间框架趋势方向的视觉帮助。 输入定义 趋势模式。 更改蜡烛颜色 - True 将更
FREE

Candle High Low
Indicator showing High and Low of X candles across a line.
Settings Candle number for calculation (>= 1 ) - Define the number of candles for the indicator to find the maximum and minimum of that period of candles. Continuation of the line's display to the right - If you want the High and Low line to extend to the right edge of the graph Line High Color - Set line color Line High Style - Set line style Line Low Color - Set line color Line Low Style - Set line style
FREE

False Breakout Stochastic to be used with our Elliott Wave Indicator as part of the overall strategy on trading the 5th wave.
As we cannot upload multiple files, we have listed this separately. False Breakout Stochastic is best used as a confirmation tool rather than the sole signal indicator The Elliott Wave Indicator Suite is designed around a simple but effective Swing Trading Strategy. The Indicator Suite is great for Stocks, Futures and Forex trading on multiple timeframes You can find the
FREE

The MACD 2 Line Indicator is a powerful, upgraded version of the classic Moving Average Convergence Divergence (MACD) indicator.
This tool is the embodiment of versatility and functionality, capable of delivering comprehensive market insights to both beginner and advanced traders. The MACD 2 Line Indicator for MQL4 offers a dynamic perspective of market momentum and direction, through clear, visually compelling charts and real-time analysis. Metatrader5 Version | How-to Install Product | How-t
FREE

The Hull Moving Average (HMA), developed by Alan Hull from 2005, one of the most fast-moving Average, reduce lag and easy to use to identify Trend for both Short & Long term. This Indicator is built based on exact formula of Hull Moving Average with 3 phases of calculation: Calculate Weighted Moving Average (WMA_01) with period n/2 & (WMA_02) with period n Calculate RAW-HMA: RAW-HMA = 2 * WMA_01(n/2) - WMA_02(n)
Weighted Moving Average with period sqrt(n) of RAW HMA HMA = WMA (RAW-HMA, sqrt(n
FREE

TILLSON MOVING AVERAGE Also known as TMA or T3 indicator. It is a moving average that uses EMA and DEMA in its formula and is calculated with the 3rd degree Binomial expansion. Pros; 1- erroneous signals encountered in other moving averages ( continuous zig zag ) has been reduced as much as possible. 2- prevented the delays seen in classical moving averages . 3- Very successful in trends Cons 1- It is not effective in horizontal markets. Setting parameters; period ; Altho
FREE
Highly configurable Macd indicator.
Features: Highly customizable alert functions (at levels, crosses, direction changes via email, push, sound, popup) Multi timeframe ability Color customization (at levels, crosses, direction changes) Linear interpolation and histogram mode options Works on strategy tester in multi timeframe mode (at weekend without ticks also) Adjustable Levels Parameters:
Stochastic RSI Timeframe: You can set the lower/higher timeframes for Stochastic RSI. Stochastic RSI
FREE

It is another simple information indicator. This indicator shows the current spread of a financial instrument and the value of one point with a volume of 0.10 lot.
About the Spread Spread is the difference between the Ask and the Bid price of an asset in the stock or currency exchange. Let's refer to Central Banks and currency exchange in these banks, in order to understand why Spread is so important in currency trading. In Central Banks, we always see the difference between the buying and the
FREE

The " Multi Kernel Regression " is a versatile trading indicator that provides graphical interpretations of market trends by using different kernel regression methods. It's beneficial because it smoothes out price data, creating a clearer picture of price movements, and can be tailored according to the user's preference with various options.
What makes this indicator uniquely versatile is the 'Kernel Select' feature, which allows you to choose from a variety of regression kernel types, such
FREE

the AK CAP toolbox free to use;
it includes the same indicators we use for our daily trading and we think the simpler the better. Lightweight indicator for use on all timeframes. that includes VWAP with vwap value indicator on top right. 3 EMA: FAST, MEDIUM, SLOW the candle timer to show how much time left in a candle.
colors and positions are fully customizable.
enjoy
FREE

Using the indicator you can 1 Identify the trend and follow the large and small trends by drawing lines. When the price leaves the corridor of the lines, then with a high probability the price will go to the next line and reverse on it. 2 Long-line - Lay lines along the centers of fractals, the indicator can detect the fractal of the second point (Number bars analysis). Often the price can approach the line even after a week or a month and you can open a reversal trade. If the wave has passed w
FREE

1.每月,每周和每日枢轴计算每个时期的开始和结束数据。
这在图表上提供了一条简单的线,用于识别枢轴的位置并减少计算误差。
3.即使您不了解如何计算枢轴,该指示器也将帮助非常快速地定义仪器的主要枢轴。
4.您还可以比较每周和每日的支点,以便您更好地了解价格的位置。
5该指标将帮助您更有效地交易,更接近阻力或支撑。
1. Měi yuè, měi zhōu hé měi rì shū zhóu jìsuàn měi gè shíqí de kāishǐ hé jiéshù shùjù.
Zhè zài túbiǎo shàng tígōngle yītiáo jiǎndān de xiàn, yòng yú shìbié shū zhóu de wèizhì bìng jiǎnshǎo jìsuàn wùchā.
3. Jíshǐ nín bù liǎojiě rúhé jìsuàn shū zhóu, gāi zhǐshì qì yě jiāng bāngzhù fēicháng kuàisù de dìngyì yíqì de zhǔyào shū zhóu
FREE

For some trader's charts analysis use, specially for multi timeframe trading strategies . When you need to check something of the time within different timeframe at the same symbol chart, even different symbol charts, this indicator will show the crosshair at sync moving. You just need to load this indicator into some charts, then the crosshair will shown automatic.
FREE

The indicator draws lines the the price highs and lows. Break through the high or low usually indicates trend change (or continuation). Once the price moves through a line, and the candlestick closes, the indicator draws an appropriate arrow (also, you can enable alerts). A deal should be conducted in the breakthrough direction immediately or after a slight rollback. It is best to trade following the trend on a larger timeframe. This indicator is easy to use, but nevertheless, there are many tra
FREE

For Multi Time Frame version, please click here. BASE TRADING SYSTEM is a useful tool to trade with simple strategy. It draws automatically base up for long trade and base down for short trade. Clear trade when base is going opposite direction. User can trade by instant market entry or by pending order entry. It depends on user best strategy. input: Base Box Color- UP base box , DOWN base box, UP base shadow, Down base shadow.
FREE
Highly configurable Awesome Oscillator (AO) indicator. Features: Highly customizable alert functions (at levels, crosses, direction changes via email, push, sound, popup) Multi timeframe ability Color customization (at levels, crosses, direction changes) Linear interpolation and histogram mode options Works on strategy tester in multi timeframe mode (at weekend without ticks also) Adjustable Levels Parameters:
AO Timeframe: You can set the current or a higher timeframes for AO. AO Bar Shift:
FREE

This indicator shows the strength of each currency compared to the US dollar by calculating the rate of change in price over a specified time period. When you open the indicator, you'll see a list of different currencies on the price chart. Each currency will have a numerical value indicating its strength level compared to the US dollar, where: If the value is higher than the US dollar, it will be displayed in green, meaning that currency is stronger than the dollar. If the value is lower than
FREE
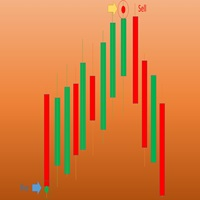
Wave Entry Alerts Oil is a custom indicator developed by Azad Gorgis for MetaTrader 4. This indicator is designed to provide alerts based on ZigZag patterns, specifically tailored for trading on the Oil (XIT/USD) symbol.
Key Features: - Chart Window Indicator: The indicator is designed to be displayed on the main chart window. - Arrow Signals: The indicator generates arrow signals on the chart, indicating potential reversal points based on ZigZag patterns. - Customizable Parameters: Traders c
FREE

Features: Find these engulfing patterns: Simple Engulf Stick Sandwich Engulf Three Line Strike Rising Three Morning Star Doji Scanner is useful to make your strategy better. Don't always go by Win/Loss percentage. Because this tool is not based on past results. Basic Settings: For All Patterns You can set: First:Last Candle Ratio This will make sure that the earlier opposite candle is at least this given ratio in height as compared to the engulfing candle. This is not checked for Three Line Stri
FREE
MetaTrader市场是您可以下载免费模拟自动交易,用历史数据进行测试和优化的唯一商店。
阅读应用程序的概述和其他客户的评论,直接下载程序到您的程序端并且在购买之前测试一个自动交易。只有在MetaTrader市场可以完全免费测试应用程序。
您错过了交易机会:
- 免费交易应用程序
- 8,000+信号可供复制
- 探索金融市场的经济新闻
注册
登录