Guarda i video tutorial del Market su YouTube
Come acquistare un Robot di Trading o un indicatore
Esegui il tuo EA
hosting virtuale
hosting virtuale
Prova un indicatore/robot di trading prima di acquistarlo
Vuoi guadagnare nel Market?
Come presentare un prodotto per venderlo con successo
Nuovi indicatori tecnici per MetaTrader 4 - 16
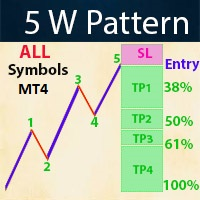
Contact me for instruction, any questions! Introduction The Elliott Wave in technical analysis describes price movements in the financial market that are related to changes in trader sentiment and psychology. The 5 W Pattern (Known as 3 Drives) is an Elliott Wave pattern that is formed by 5 consecutive symmetrical moves up or down. In its bullish form, the market is making 5 drives to a bottom before an uptrend forms. In a bearish 5-drive, it is peaking before the bears take over. 5W Pattern S

nota: questo indicatore e' per METATRADER4, se vuoi la versione per METATRADER5 questo e' il link: https://www.mql5.com/it/market/product/108123 TRENDMAESTRO ver 2.4
TRENDMAESTRO riconosce un nuovo TREND sul nascere, non sbaglia mai. La sicurezza di identificare un nuovo TREND non ha prezzo.
DESCRIZIONE
TRENDMAESTRO identifica un nuovo TREND sul nascere, questo indicatore prende in esame la volatilita' i volumi ed il momentum per identificare il momento in cui c'e' un'esplosione di uno

- Real price is 80$ - 50% Discount ( It is 39$ now ) Contact me for instruction, any questions! Introduction The breakout and retest strategy is traded support and resistance levels. it involves price breaking through a previous level. The break and retest strategy is designed to help traders do two main things, the first is to avoid false breakouts. Many false breakouts start with a candlestick that breaks out of a level but ends with an immediate candlestick that brings the price back into t

ENIGMERA: Il cuore del mercato https://www.enigmera.com
Introduzione Questo indicatore e sistema di trading rappresenta un approccio straordinario ai mercati finanziari. ENIGMERA utilizza i cicli frattali per calcolare con precisione i livelli di supporto e resistenza. Mostra l'autentica fase di accumulazione e fornisce direzione e obiettivi. Un sistema che funziona sia in un trend che in una correzione.
Come funziona? ENIGMERA è composto da tre linee: la linea di supporto/resistenza, la
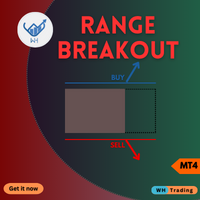
Sblocca una nuova dimensione del trading con il nostro indicatore MQL4 all'avanguardia, Range BreakOut MT4
Questo potente strumento è progettato per identificare e sfruttare i movimenti dei prezzi quando escono dagli intervalli stabiliti,
fornendoti la precisione e la sicurezza necessarie per prosperare nel dinamico mondo dei mercati finanziari.
Versione MT5 : WH Range BreakOut MT5
Caratteristiche:
Rilevamento accurato della portata. Segnali di breakout in tempo reale. Parametri
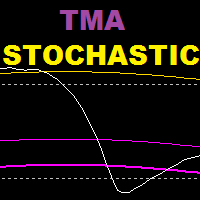
TMA Stochastic è un indicatore basato sull'oscillatore stocastico e sull'indicatore delle bande tma, questo indicatore si basa su una strategia di inversione.
Periodo di tempo consigliato: 15 e oltre
Impostazioni consigliate: valori più bassi per lo scalping, valori più alti per lo swing trading
================================================== =====================
Parametri:
Storia tma: quante barre indietro per mostrare le bande tma sullo stocastico
Periodo K (stocastico)
Peri
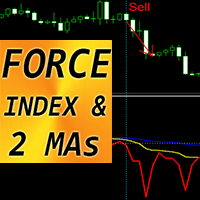
Forex Indicator "FORCE index and 2 Moving Averages" for MT4 This indicator is excellent for Momentum trading into the trend direction. " FORCE index and 2 Moving Averages" Indicator allows you to see Fast and Slow Moving Averages of Force index Force index is one of the top indicators that combines price and volume data into a single value Force index itself is powerful oscillator - that measures the amount of power used to move the price Indicator gives opportunities to see the t

The "Yesterday High Low" indicator for the MetaTrader 4 (MT4) trading platform is a powerful tool designed to help traders identify key price levels from the previous trading day. This indicator provides a visual representation of the high prices, low prices, high/low price averages, and intermediate average levels on the chart.
Primarily used by institutional and professional traders, this indicator offers an instant view of price levels that are often considered crucial in financial markets
FREE

The Datasource AC indicator is a technical analysis tool developed by the author based on the Accelerator Oscillator. Everyone knows the general principles of working with the AC indicator. Therefore, I will not describe them separately. I will focus on differences.
Differences are a purely technical implementation and expanded indicator. An important feature is that the indicator does not change its values even when using the closing price, since the indicator uses the safe calculation a

This indicator integrates the Bollinger Band strategy in calculation with a volume-over-MA
calculation to further narrow down "Areas of Interest" levels for a potential re-test zone to the right of the chart.
We added a Moving Average calculation for a multi-level cloud and further broke down more conditions to highlight both
volume flow crossover on the High and Extreme High MA's and also high and extreme high volume spikes on set period average
without bull\bear conditions. Original Bull
FREE

The SFT Fibo Smart Pivot indicator is a powerful trading tool based on the Fibonacci Golden Ratio, designed to identify key support and resistance levels in the forex market. This indicator has the ability to pinpoint significant price levels that can serve as entry and exit points for trades. It enables traders to analyze the market more effectively and make well-informed decisions. The indicator uses the Fibonacci Golden Ratio to accurately determine support and resistance levels. These levels
FREE

Head and Shoulders Pattern Indicator - Your Key to Recognizing Trend Reversals Unlock the power of pattern recognition with the "Head and Shoulders Pattern Indicator." This cutting-edge tool, designed for MetaTrader, is your trusted ally in identifying one of the most powerful chart patterns in technical analysis. Whether you're a novice or an experienced trader, this indicator simplifies the process of spotting the Head and Shoulders pattern, allowing you to make informed trading decisions. Key
FREE
The presented indicator is based on a fast digital filter (RFTL) with the help of which a short-term trend is predicted. This product marks trend reversal points and support/resistance lines. The indicator has six calculation options: 1. Identifies the closing price leaving the channel; 2. Identifies the exit/entry of the closing price outside the channel; 3. Identifies the closing price leaving the channel and sideways price movement; 4. Identifies the average price going beyond the channel; 5.
The presented indicator is based on a slow digital filter (RSTL) with the help of which a long-term trend is predicted. This product marks trend reversal points and support/resistance lines. The indicator has six calculation options: 1. Identifies the closing price leaving the channel; 2. Identifies the exit/entry of the closing price outside the channel; 3. Identifies the closing price leaving the channel and sideways price movement; 4. Identifies the average price going beyond the channel; 5.
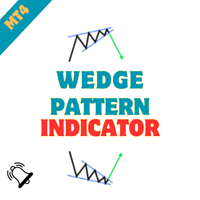
Wedge Chart Pattern Indicator - Unleash the Power of Wedge Patterns in Your Trading Embark on a journey of precision trading with the "Wedge Chart Pattern Indicator." Crafted for MetaTrader, this advanced tool is your ultimate companion for identifying wedge chart patterns, empowering you to make informed and strategic trading decisions. Whether you're a seasoned trader or just starting, this indicator simplifies the process of spotting wedge patterns, providing you with a valuable edge in the m
FREE

Flag Pattern Indicator - Your Guide to Flagging Profitable Trade Setups Welcome to the world of precision trading with the "Flag Pattern Indicator." Designed for MetaTrader, this powerful tool is your go-to solution for identifying one of the most reliable and versatile chart patterns in technical analysis: the flag pattern. Whether you're a seasoned trader or just starting, this indicator simplifies the process of spotting flag patterns, giving you an edge in your trading decisions. Key Feature
FREE

Introducing the South African Sniper indicator created by a small group of traders with a few years trading trading the financial market profitably . This is a plug and play indicator that provides you with BUY and SELL (SNIPER ENTRY) signals with TARGET and trail stops. The indicator Works with all MT4 trading instruments. The indicator uses previous chart data as receipt to speculate on future market moves.
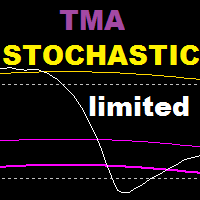
TMA Stochastic is an indicator based on stochastic oscillator and tma bands indicator , this indicator is based on a reversal strategy . Recommended time frame : 15 and above Recommended settings : lower values for scalping , higher values for swing trading WORKS ONLY ON EURUSD , GET THE FULL VERSION : https://www.mql5.com/en/market/product/108378 ======================================================================= Parameters : tma history : how many bars back to show tma bands on stochas
FREE

Daily supply and demand levels for breakouts or reversals. Use on 1 Hour charts No nonsense, for the confident trader who trades price action supply and demand levels with daily projections without the fluff using 1 Hour charts. MT5 Version: https://www.mql5.com/en/market/product/108522 The Bank Trader Indicator is a sophisticated tool employed by institutional traders, particularly those in banking institutions, to navigate the complex world of forex markets. Rooted in the principles of daily

Symmetrical Triangle Pattern Indicator - Mastering Trend Recognition in MetaTrader Unlock the power of trend recognition with the "Symmetrical Triangle Pattern" indicator for MetaTrader. This innovative tool simplifies the identification of symmetrical triangle patterns, providing traders with clear signals for potential trend continuation or reversal. Elevate your trading strategies with this MQL offering. Key Features : Accurate Pattern Recognition : The Symmetrical Triangle Pattern Indicator
FREE
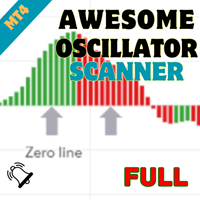
Welcome to the world of advanced trading with the Awesome Oscillator Scanner! Maximize your trading experience with our powerful MT4 indicator designed for seamless analysis and real-time insights. Key Features: Effortless Awesome Oscillator Scanning: Unlock the full potential of the Awesome Oscillator Scanner by effortlessly scanning multiple currency pairs. Receive instant alerts when specific Awesome Oscillator conditions are met, ensuring you stay ahead of market movements. Comprehensive Da
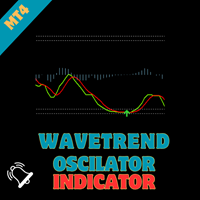
WaveTrend Oscillator - Bringing Tradingview's Renowned Indicator to MQL Elevate your trading strategies with the "WaveTrend Oscillator," an MQL port of the renowned TS/MT indicator created by Lazybear on tradingview. This powerful indicator provides valuable insights into market dynamics, offering clear signals for optimal entry and exit points in your trades.
Key Features : Proven Effectiveness : Based on the popular TS/MT indicator, the WaveTrend Oscillator brings a time-tested and proven ap

Supreme Direction is an indicator based on market volatility , the indicator draws a a two lined channel with 2 colors above and below price , this indicator does not repaint or back-paint and signal is not delayed. how to use : long above purple line , short below golden line. Parameters : channel period ========================================================
FREE

Supreme Stoploss is an indicator for metatrader 4 that is based on the ATR indicator , it gives stoploss/takeprofit as lines drawn above and below the price , this indicator does not repaint/back paint and is not delayed. can be used to determine the stop loss or take profit of a trade using ATR value multiplied by the number set by user. ====================================================================================================== Parameters : ATR SL period : ATR period identity : leave
FREE
Supreme MaChannel is an indicator based on moving averages , the indicator gives dynamic support and resistance in bands format. Recommended for reversal traders , add it to your reversal strategy. Parameters : Supreme MA Period : ma periods Supreme MA Price : close/open/high/low..etc Supreme MA Type : Simple/Exponential/Smoothed/Linear Weighted Deviation : bands deviation the distance between the two band lines
Supreme Entry is an arrow signal based indicator that give buy and sell signals , the indicator gives buy/sell signals with alert on candle open/close (depends what you set it to be from inputs) . this indicator does not repaint/back-paint and signal is not delayed. Strategy : Open buy same moment buy arrow appear and open sell same moment a sell arrow appear , close on well or on opposite signal . Recommended Time frame : 15 and above this arrow is good as ? : addon to your existing strategy ,
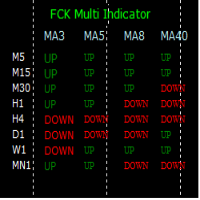
The FCK Multi Indicator for MT4 displays trend direction of multiple indicators on multiple time frames for a pair. So, forex traders can see the trend direction at a snap and trade with confluence of multiple indicators. Furthermore, it helps traders to see the trend in multiple time frames and trade in the direction of the overall market trend. Additionally, it shows the stop loss, pips to stop, pips in profit of any open position. The indicator display is very neat and is very helpful for bot
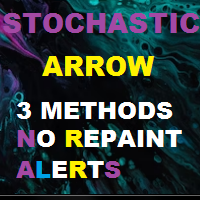
STOCH ARROW is a long short arrow signal type indicator that is based on standard stochastic oscillator this indicator has 3 methods of giving long and short signal that are as follow : 1.whenever stochastic lines cross 2.when a cross happens in overbought and oversold zones (short arrow on overbought zone cross , long arrow on oversold zone cross) 3.when stochastic lines leave overbought and oversold zones (short arrow on leave from overbought zone , long arrow leave on oversold zone) this ind
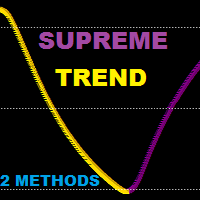
Supreme Trend is a reversal/continuation type Oscillator type indicator that is based on Moving average and stochastic indicators this indicator can be used in two methods : Reversal Method : short when golden arrow appear after arrows were above upper level (e.g 70) Reversal Method : long when Purple arrow appear after arrows were below lower level (e.g 30) Trend Method : long when arrows cross above 50 level line , short when arrows cross below 50 level line. use higher ma and stochastic peri
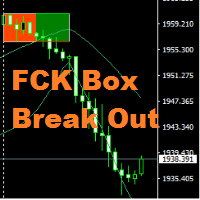
Hi All, " FCK Box Break Out " indicator is very simple indicator for new users. You can choose which indicators and timeframes you want to calculate. "FCK Box Break Out" provides the day's trend for buy/sell trades. Opposite side you the stop loss or hedging trade. NON-REPAINT Buy/Sell signals Recommendations Timeframes: Recommended - H 1 (Still, EA technically works on any Time frames ) Spread : up to 20 Recommended pairs: works on any metal, indices and currency pair

This indicator smoothes the value of CCI (Commodity Channel Index) and reduces its volatility. By using this indicator, the fluctuations created by the CCI indicator are reduced. The smoothed CCI value is placed in a buffer that you can use in your EA and strategy. Leave me a comment if you want By using this indicator, you no longer need to use the Moving Average indicator on the CCI indicator.
FREE
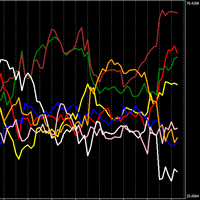
Indicatore Potente che mostra la forza della singola valuta. Piu è in alto, più è forte la valuta, viceversa, più è in basso, più è debole. Strategia di Trading N1: Aprire posizione sugli incroci delle linee, se una incrocia verso l'alto e l'altra verso il basso, aprire la posizione sulla valuta che va verso l'alto. Strategia di Trading N2: Aprire posizione comprando la valuta più forte e vendere la valuta più debole. Nelle impostazioni, è possibile cambiare il time frame, io uso quello di defau
FREE

Il TRANSACTION SPEED è l'indicatore di maggiore qualità che mostra dove e quando si accumulano grandi ordini sul mercato e i vantaggi che ne derivano. Rileva i cambiamenti di tendenza in una fase molto precoce. È contemporaneamente un indicatore e un sistema di trading. Il concetto è unico e incredibilmente redditizio.
Nel Forex, il volume dei tick è chiamato in modo piuttosto fuorviante volume. In realtà si tratta della variazione di prezzo per unità di tempo, che di fatto è la VELOCITÀ DI T
Supreme Diamond è un indicatore multi-intervallo temporale basato sulla strategia di inversione e di trading di tendenza, l'indicatore non ridipinge o retrovernicia e i segnali non vengono ritardati, l'indicatore fornisce segnali di acquisto e vendita con avviso.
l'indicatore ha 2 modalità di segnale che possono essere scelte dall'ingresso (usa la voce migliore come diamanti), se è impostato su vero l'indicatore filtrerà i segnali in modalità normale e fornirà il miglior segnale possibile com

Supreme Arrow è un indicatore a freccia per mt4 basato sulla strategia degli indicatori rsi e demarker.
la strategia è adatta ai mercati in trend, ma funziona anche nei mercati in range, soprattutto se viene utilizzata per lo scalping
Periodo consigliato: qualunque
Componenti aggiuntivi consigliati: 200 SMA
L'indicatore Supreme Arrow non viene ridipinto o retroverniciato e il segnale non viene ritardato
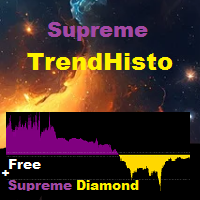
Supreme TrendHisto è un indicatore di tendenza che fornisce segnali di tendenza al rialzo e al ribasso, l'indicatore agisce come un istogramma, l'indicatore non si ridipinge/ritarda.
Strategia
Acquista operazione: incrocio dell'istogramma superiore a 0,65, apriamo un'operazione di acquisto, poiché per l'uscita puoi uscire quando l'istogramma raggiunge il livello di 0,70 o uscire bene.
Vendi operazione: l'istogramma incrocia sotto -0,65, apriamo l'operazione di acquisto, poiché per l'uscit
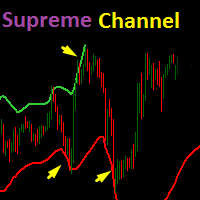
basato sull'indicatore del canale TV atr, l'indicatore Supreme Channel è una banda dinamica di supporto e resistenza che dà al trader un suggerimento su una potenziale inversione della tendenza attuale.
Intervallo di tempo consigliato: 15 milioni e oltre
Impostazioni consigliate: predefinite, ma il trader può scegliere di modificare secondo necessità.
Parametri:
1. Lunghezza del canale
2.Larghezza di banda (la distanza tra le due linee di canale)
3.Moltiplicatore (moltiplicatore del
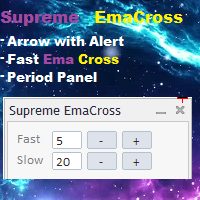
Supreme EmaCross è un indicatore basato su due medie mobili esponenziali incrociate, genera frecce di acquisto e vendita basate su ema cross e fornisce avvisi sull'apparizione del segnale, l'indicatore non si ridipinge o si retrodipinge e le frecce non vengono ritardate, l'indicatore ha un veloce Pannello di modifica del periodo ema in cui il trader può modificare i valori di ema senza accedere alle impostazioni dell'indicatore, il pannello è mobile.
==========================================

Forex Indicator "MACD with Trend ZigZag" for MT4 MACD indicator itself is one of the most popular tool for trend trading "MACD with Trend ZigZag" is excellent for using with Price Action entries or in combination with other indicators Use this indicator to select most accurate entry signals: - If MACD is above 0 (green color) and ZigZag line is upward - search only for Buy Price Action patterns - If MACD is below 0 (pink color) and ZigZag line is downward - search only for Sell Price Action
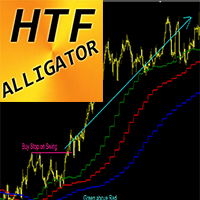
Forex Indicator Alligator H igher Time Frame for MT4 Alligator indicator is one of the most powerful trend indicators. H TF means - H igher Time Frame This indicator is excellent for Trend Traders as well as combination with Price Action entries. HTF Alligator Indicator allows you to attach Alligator from Higher time frame to your current chart. Consider Buy entries only when Green line is above Red one & Red is above Blue - arrange Buy Stop pending order on maximum of latest

Trend analysis is perhaps the most important area of technical analysis and is the key to determining the overall direction of an instrument's movement. The Quest Trend indicator determines the prevailing trend. They help analyze the market on a selected time interval. Trends are based on the principle of higher highs, higher lows (for an uptrend) and lower highs, lower lows (for a downtrend). They can have different time periods and they can be related to each other like fractals. For example,

With this tool you can create some useful data in a CSV file.
You can:
- Determine time frame - the number of candles to be loaded - Name the file whatever you want - Select additional data sets to be loaded
The following data is written to a CSV file.
- Time when the candle was created. - Open price - Close price - High price - Low price
The following selection is also available to you:
- Volume - RSI (you can also select the period) - Moving Avarage (you determine the period and m
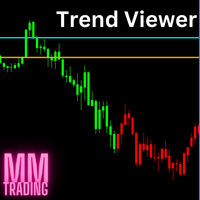
This indicator changes the color of the chart when prices are more bullish or bearish. It is recommended to use this indicator on small timeframes and only during peak trading hours. And don't forget your stop limit. This is not an oracle and not a holy grail.
In the settings, you can change the color of the candles and also their sentiment. To do this, use the Set 1 and Set 2 settings and test.
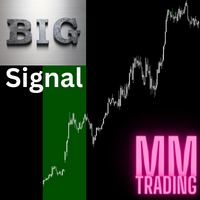
This is a multi-timeframe indicator that collects data from multiple time frames. It tries to identify the trend and predict a pullback. You have to understand that trends emerge suddenly and with that the pullback turns into a new trend. This is not a holy grail, always remember your stoploss. Use this indicator as a complement to your existing strategy.
The lines that are displayed on the chart can be changed so that they are only displayed in the indicator window and are therefore not dist
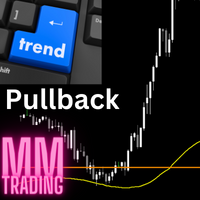
This indicator is not an ordinary moving avarage, even if it behaves similarly. I really like to use this to identify pullbacks. I only use this strategy once a day for one instrument, not more often. It is best if the price is further away from the line in the morning and when the pullback occurs, then you can create an entry setup using this indicator. Use additional indicators or use this as a supplement to your existing strategy.
This is not a holy grail. A pullback can quickly become a t

The indicator is the advanced form of the MetaTrader 4 standard Fibonacci tool. It is unique and very reasonable for serious Fibonacci traders.
Key Features
Drawing of Fibonacci retracement and expansion levels in a few seconds by using hotkeys. Auto adjusting of retracement levels once the market makes new highs/lows. Ability to edit/remove any retracement & expansion levels on chart. Auto snap to exact high and low of bars while plotting on chart. Getting very clear charts even though man
This indicator is a modification of the classic Parabolic support and resist (PSAR) indicator. The indicator has two customizable ranges, which allows you to identify long-term and short-term trends. The indicator has the ability to generate signals and send notifications about them to email and the terminal. A time-tested product that allows you not only to determine entry/exit points, but also reasonable levels for placing protective stop orders.
FREE
Technical analysis indicator described in the article by Vladimir Kravchuk: " Digital indicators in the technical analysis of financial markets ".
In the proposed version, the indicator provides two types of signals: 1. Zero crossing; 2. Change of direction. To use it effectively, it is necessary to take into account the long-term trend and open a position only in its direction. It is recommended to use signal confirmation. A signal is considered confirmed if the current price has overcome the
FREE

The Supreme HmaSignal indicator is an indicator for trend trading , its main character is the hull moving average colored line , and secondary is buy and sell arrows , arrows are fair but the main focus is on the colored hma , this indicator does not repaint or back paint or delay its signals. if you like this indicator please check my Supreme Trendhisto: here , and my Supreme Diamond indicator : here
Parameters: HMA Period HMA Smoothing HMA Price (close/open) Signal Period (Arrows)
FREE

Introducing the Consecutive Green/Red Candle Alert Indicator for MT4 - Your Trend Spotting Companion! Are you ready to take your trading to the next level? We present the Consecutive Green/Red Candle Alert Indicator, a powerful tool designed to help you spot trends and potential reversals with ease. Whether you're a new trader looking for clarity in the market or an experienced pro seeking additional confirmation, this indicator is your trusted companion. Key Features of the Consecutive Green/Re
FREE

Rsi indicator and Stochastic Combined into one indicator , the Supreme StochRsi doesnt repaint / Back-paint / delay. can be used as overbought oversold strategy , or trend following on 50 level cross. if you like this indicator please check my Supreme Trendhisto: here , and my Supreme Diamond indicator : here ========================================================================= Parameters : Stochastic K and D value , Stochastic period Rsi Period Rsi price ====================================
FREE

Property of Vertical Capital Edition: Gugol_Quants About USA INDEXES QUANT_INDICATOR: This is a indicator created by math modulation to be used as a trading tool, which was developed in MQL. (MT4) This indicator is for use only with US500(S&P500), NAS100(Nasdaq Composite) and US30(Dow Jones). Signals are activated on "Open" Candle. It’s based on Intraday/Swing Trades whose main timeframe is H1, H2, H3 and H4. However you can use it with other assets by testing with the appropriate settings. *
FREE

Behaving in a similar fashion as the price action of a chart, the indicator uses " Trix " to opportune itself to the exposure of divergency, flat/low market volume, and price action expansion . The TRIX indicator nicknamed after the Triple-Exponential-average, is a momentum-based oscillator that filters minor price changes and fluctuations that are considered insignificant for forex trading whilst providing money making opportunities! Overall, TRIX is a leading indicator that shows diverge
FREE

WONNFX create arrow tester. Сonstructor/Tester. Tester for buffer indicators. Converting a buffer indicator into an arrow signal on the chart. Combining two buffer indicators into one arrow signal. Filter by candle color. You can move the arrow signal several bars forward (useful in cases where the indicator gives signals 2-3 bars late
"WONNFX create arrow tester" is a tool designed specifically for traders who use buffer indicators in their trading strategies. This tester converts the buffer
FREE

Daily Reverse - Day Number-Based Reversal Predictor Description: Experience a revolutionary approach to price reversal prediction with our "Daily Reverse" indicator. This innovative tool leverages day numbers to forecast potential market reversals by drawing vertical lines on the hourly timeframe, giving you valuable insights into intraday trading opportunities. How It Works: "Daily Reverse" harnesses the power of day numbers to predict price reversals. By calculating day-specific patterns, this
Welcome to the world of advanced trading with the Moving Average Crossover Multicurrency Scanner! Elevate your trading experience with our powerful MT4 indicator designed for seamless analysis and real-time insights. Key Features: Effortless Moving Average Crossover Scanning: Unlock the full potential of the Moving Average Crossover Multicurrency Scanner by effortlessly scanning multiple currency pairs. Receive instant alerts when specific Moving Average Crossover conditions are met, ensuring y
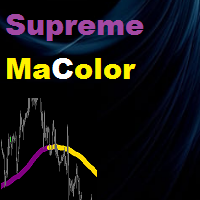
Supreme MaColor is an indicator based on moving average indicator , it gives up and down trend colors and it has different moving averages types and has multi time frame function , this indicator does not repaint/back-paint/delay signal. =================================================================================== Parameters : Timeframe (what time frame to use to draw Supreme Ma) Ma Period Ma Type Ma Price (close/open...etc) Average Shift (Ma shift) Multi Time frame on/off ===============

This indicator softens the value of the RSI (Relative Strength Index) and reduces its volatility. You can use this indicator in your expert advisors, indicators and strategies. With this indicator, you don't need to have two indicators on the chart at the same time. For example, an RSI indicator and a Moving Average indicator If you have any questions or concerns, contact me.
FREE
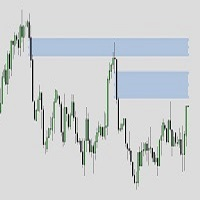
ICT Fair value gapes / Balanced price ranges it marks the fvgs i.e., bisi and sibi both filled and unfilled based on your requirements. it can work on mtf while your on any other time frame i.e., seeing on 5 min. you can watch from filled (BPRs) to unfilled (imbalances) of monthly/weekly/daily/H4/H1 to your likings It can be using multiple times using unique ID with buttons option to on and off the required TF or keeping them all.
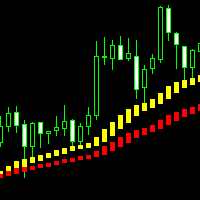
这是 一款可以直观识别波段趋势的分析指标,手工交易最佳选择,不重绘不漂移。 适应任何新手和量化交易的朋友。 参数设置(您购买指标后若不知道如何使用,请私信我): 快线: g_period_88 20
慢线: g_period_88 40
===========交易信号 ===========
快线:黄/蓝线;慢线:红/绿线 多头方向:快线上穿慢线,快线在慢线上方 空头方向:快线下穿慢线,快线在慢线下方
做多信号: 当快线上穿慢线形成一轮多头方向时,首轮多单进场条件为出现两根以上连续阴线,第3根以上K线出现一根阳线,且收盘价格在慢线上方,慢线为红线,即可成交第一单多单,同时如果满足价格回踩触碰到快线,出现一条阳线,且收盘价格在慢线上方,慢线为红线时,也可成交第一单多单;当第一轮多单结束后,此轮多头方向的多单只能满足价格回踩触碰到快线后,出现一条阳线收盘价格在慢线上方,慢线为红线时,才可继续做多进场,即不管快线是黄线或蓝线,只要阳线收盘价格在慢线上方,慢线为红线时就可以做多进场;当快线在慢线上方,阳线收盘价格在慢线上方,但慢线为绿线时,则不进场
做空信号: 当快线下穿

Gold Channel is a volatility-based indicator, developed with a specific timing algorithm for the XAUUSD pair, which consists of finding possible corrections in the market.
This indicator shows two outer lines, an inner line (retracement line) and an arrow sign, where the theory of the channel is to help identify overbought and oversold conditions in the market.
The market price will generally fall between the boundaries of the channel. If prices touch or move outside the channel it is a tra

Market Cycles is a unique proprietary indicator that uses a neural network to determine the current market phase.
For training, the neural network uses cyclic (reversal) patterns.
Currency markets tend to cycle from bearish to bullish periods and back again.
In this product, we combined patterns from four timeframes (M5, M15, M30, H1), which allowed us to significantly increase the accuracy of the signals!
Market Cycles should be used on the EURUSD currency pair, M30 timeframe!
Be

Innanzitutto, è importante sottolineare che questo sistema di trading è un indicatore non repainting, non redrawing e non lagging, il che lo rende ideale per il trading professionale. Corso online, manuale utente e demo. Il "Sistema di Trading di Supporto e Resistenza Intelligente" è un indicatore avanzato progettato per trader nuovi ed esperti. Permette ai trader di ottenere precisione e fiducia sul mercato forex. Questo sistema completo combina più di 7 strategie, 10 indicatori e varie approc

L'indicatore di trading Del Segnale Sea Candles MT4 determina la direzione del movimento dei Prezzi utilizzando l'oscillatore CCI, generando segnali per aprire una posizione. Commodity Channel Index [CCI] - misura la deviazione del prezzo dalla sua media mobile. La divergenza appare quando il prezzo raggiunge un nuovo massimo e il CCI non può superare i massimi precedenti. Questa divergenza classica è solitamente seguita da una correzione dei Prezzi. Il CCI varia generalmente entro ±100. Valori

Indicatore Forex Advanced Scalper MT4 è una formula che si basa sul trading di scalping, così come sui livelli di Ipervenduto e Ipercomprato. L'indicatore funziona su Tutte le coppie di valute,
criptovalute, azioni, indici. Un indicatore universale che può essere personalizzato in base alle proprie esigenze e non sarà mai superfluo in nessuna strategia di trading.
INFORMAZIONI SULL'INDICATORE L'indicatore Forex Advanced Scalper MT4 è presentato sotto forma di un grafico a barre colorato c

L'indicatore Forex Wave wold MT4 è progettato per cercare le onde di Woolf e visualizzarle nella finestra corrente del terminale di trading. Un ottimo indicatore per i trader che utilizzano le onde di Wolfe nel trading. La sua applicazione nelle strategie di trading aumenterà notevolmente la loro efficienza e redditività.
INFORMAZIONI SULL'INDICATORE A differenza di altri indicatori onda Wold, indicatore Forex onda wold MT4 ha una serie di caratteristiche che aumentano notevolmente la sua eff

Scanning Multi Symbols Scalping Signals based on 3 kinds of Market Analysis methods. Trend, Signal, and Reversator. And each method consists of its own multi timeframes algorithm functions. Summarized to become clear signals direction BUY/SELL, including the signals strength scoring and sending message to all available alert tools. Displayed on a User Friendly and customizable Dashboard. Size, colors, coordinates, highlight, hidden/show and more. Base Timeframe: M15. And M5 to Daily to confirm

Quarterly Cycles
Quarterly Cycles is based on the Quarterly Theory developed by Daye ( traderdaye on X ) T his is an aid to the user to find Cycles and it is NOT automatic detected, user can select AMDX or XAMD in each Cycle and it will be visually draw on the chart. Quarterly Cycles: Yearly, Monthly, Weekly, Daily, 6 Hour (90 minutes)
Yearly Cycle: The year is divided in four sections of three months each Q1 - January, February, March Q2 - April, May, June Q3 - July, August, September Q4
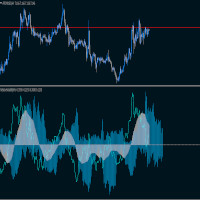
The indicator shows the deviation of the moving average relative to the volatility leading half of its period.
The red histogram shows the moving average relative to the anchor point.
The blue histogram shows volatility relative to the leading half
of the moving average.
The blue line simulates the price relative to the moving average.
The indicator is perfect for both grid trading and trend trading.
The signal does not change when the timeframe changes

Trend Channel is a Forex trend arrow indicator for identifying potential entry points. I like it, first of all, because it has a simple operating mechanism, adaptation to all time periods and trading tactics. Created based on a regression channel with filters. We display the signals of the Trend Channel indicator on the price function chart using a mathematical approach.
How it works: when the price breaks through the overbought/oversold zone (channel levels), a buy or sell signal is generate
MetaTrader Market - i robot di trading e gli indicatori tecnici per trader sono disponibili nel tuo terminale di trading.
Il sistema di pagamento MQL5.community è disponibile per tutti gli utenti registrati sul sito MQL5.com che effettuano transazioni su MetaTrader Services. Puoi depositare e prelevare denaro usando WebMoney, PayPal o una carta di credito.
Ti stai perdendo delle opportunità di trading:
- App di trading gratuite
- Oltre 8.000 segnali per il copy trading
- Notizie economiche per esplorare i mercati finanziari
Registrazione
Accedi
Se non hai un account, registrati
Consenti l'uso dei cookie per accedere al sito MQL5.com.
Abilita le impostazioni necessarie nel browser, altrimenti non sarà possibile accedere.