MetaTrader 4용 기술 지표 - 136
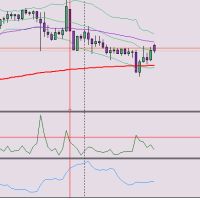
How many time is Candle's Range bigger than Atr indicator? HERE IS THE ANSWER YOU WERE LOOKING FOR!! This awesome indicator is meant to better read market and keep Valuable informations for a good trading payload. let me know if you like it in comments, if it's usefull and if you have hints to make it better i would appreciate it.
this indicator measures proportion between range and atr

The Practitioner indicator is based on a unique algorithm for analyzing price behavior and presents the result of this complex work in the form of lines. One of the advantages of this indicator is that it automatically changes the color of the line according to the current direction of the price movement.
It is important to note that the indicator has an option to enable alerts when the line color changes. This gives the trader the opportunity to quickly respond to changes and identify new tr

TrendMaster: Your Ultimate Non-Repaint Trading Indicator for Consistent Profits Introducing TrendMaster , the cutting-edge NONREPAINT Trading indicator that empowers traders to seize market opportunities with unparalleled precision. Utilizing a sophisticated blend of the Relative Strength Index (RSI), Stochastic Oscillator, and Average Directional Index (ADX), TrendMaster delivers highly accurate buy and sell signals, allowing traders to capitalize on both bullish and bearish trends confidently
The RSI Advanced tool will help traders capture trends and optimal entry points by:
- Enter a Buy order when the green line crosses the yellow line. Provided that the yellow line is near line 32 or 20 - Enter a Sell order when the green line crosses the yellow line. Provided that the yellow line is near line 68 or 80
Additionally, you can combine it with the convergence divergence that occurs at the green line. **When you purchase the Mastering the RSI MT4 or Mastering the RSI MT5 indicator

SmartSignal Sniper: 귀하의 궁극적인 트레이딩 파트너 SmartSignal Sniper를 사용하여 정확한 매수 및 매도 신호의 힘을 발견하세요. 이 고급 도구는 정확한 매수 및 매도 신호를 제공하여 모든 수준의 트레이더가 자신감을 가지고 금융 시장을 탐색할 수 있도록 설계되었습니다. 주요 특징: 정밀도 높음: SmartSignal Sniper는 고급 알고리즘을 사용하여 정확한 매수 및 매도 신호를 제공하여 트레이더가 시장에서 수익 기회를 파악할 수 있도록 지원합니다. 실시간 실행: 실시간 신호 생성을 통해 SmartSignal Sniper는 잠재적인 거래 기회에 대해 즉시 알림을 제공하여 트레이더가 합리적인 결정을 내릴 수 있는 경쟁 우위를 제공합니다. 사용자 정의 가능한 매개변수: 사용자 정의 가능한 매개변수를 사용하여 SmartSignal Sniper를 자신의 거래 선호도에 맞게 조정하고 다양한 시장 조건과 거래 스타일에 적응할 수 있습니다. 사용자 친화적 인터페이
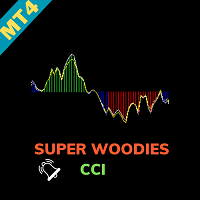
Super Woodies CCI Indicator - Enhance Your Trading Precision Step into the realm of precision trading with the "Super Woodies CCI Indicator" for MetaTrader 4. This advanced tool, inspired by Woodie's CCI, is designed to provide you with clear insights into market trends, enabling you to make well-informed trading decisions. Basic Details : Indicator Type : Super Woodies CCI Indicator Key Metrics : Real-time CCI (Commodity Channel Index) analysis for price trends. Customization : Fully customizab

Adaptive Market Dynamics Indicator (AMDI) is an innovative tool for traders across all financial markets. This indicator is designed to provide traders with a deep understanding of market dynamics and adaptive trading signals based on current market conditions. Key Features and Benefits: Adaptive Analytics : AMDI can automatically adapt to changing market conditions, allowing traders to effectively adjust their strategies in real-time. Multifactor Analysis : The indicator offers a comprehensiv

OVERVIEW
K-means is a clustering algorithm commonly used in machine learning to group data points into distinct clusters based on their similarities. While K-means is not typically used directly for identifying support and resistance levels in financial markets, it can serve as a tool in a broader analysis approach.
Support and resistance levels are price levels in financial markets where the price tends to react or reverse. Support is a level where the price tends to stop falling

"Adjustable Fractals" - 프랙탈 표시기의 고급 버전으로 매우 유용한 거래 도구입니다!
우리가 알고 있듯이 표준 프랙탈 mt4 표시기에는 설정이 전혀 없습니다. 이는 거래자에게 매우 불편합니다. 조정 가능한 프랙탈(Adjustable Fractals)이 해당 문제를 해결했습니다. 필요한 모든 설정이 포함되어 있습니다. 조정 가능한 표시 기간(권장 값 - 7 이상) 고점/저점과의 거리 조절 가능 프랙탈 화살표에 따라 조정 가능한 디자인 ............................................................................................................................................. // 더 훌륭한 전문가 자문 및 지표는 여기에서 확인할 수 있습니다: https://www.mql5.com/en/users/def1380/seller 본 MQL5 홈페이지에서만 제공
'Zoro LITE' is a reversal strategy based MT4 indicator with advance pre-alert system. Its an 100% non repaint indicator with an average accuracy of about 70-95% in a ranging market. --------------------------------------------------------- Features: Neural Network based Advance price action algorithms Pre-alert (get ready) signals Non-delay indications 24/7 signals OTC markets supported Auto-trading supported 100% Non repaint 100% No lag No recalculating Lifetime license -----------------------
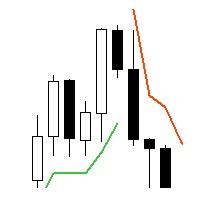
Supertrend - невероятно мощный и универсальный индикатор, предназначенный для помощи трейдерам в определении текущего тренда на конкретном торговом инструменте. С помощью двух встроенных индикаторов, Average True Range и Standard Deviation, трейдеры могут выбрать наиболее подходящий индикатор для своей стратегии торговли. Пользователи также могут настроить период этих индикаторов и выбрать цену (Close, High, Low, Open, Weighted), к которой он должен быть применен, с Typical price в качестве опци

Trop is a trend indicator that has several important advantages. It helps to pinpoint both new and existing trends in the market. One of its key advantages is its quick adjustment and responsiveness to changes in schedule. The effectiveness of the indicator depends on the set CalcBars period. The longer this period, the smoother the indicator displays the trend line. On the other hand, as the period decreases, the indicator takes into account more market noise, which can be useful in generating

In the world of trading, one of the main concerns is finding a reliable trading system. Meet the TrendEdge Channel indicator - your reliable companion in this search. Developed based on complex mathematical calculations, this indicator predicts the most likely short-term price movements.
TrendEdge Channel is designed specifically to identify trends in price movements. Thanks to it, you can quickly determine not only the direction of the trend, but also the levels of interaction between buyers
The TrendScope Pro indicator views the chart as a function with the X-axis representing time and the Y-axis representing price, expressed in bars and pips respectively. The main objective of the indicator is to provide users with signals for actions when the function forms continuous movement in one direction over a specific period of time. The indicator parameters need to be adjusted individually for each currency pair, as the price function varies for different pairs.
The indicator provides

Spread Pulse 지표는 거래자에게 차트의 현재 스프레드에 대한 정보를 제공하는 효과적인 도구입니다. 스프레드는 특정 상품의 구매 가격과 판매 가격의 차이입니다.
지표는 차트에 표시되는 텍스트 형식으로 표시됩니다. 이를 통해 거래자는 현재 스프레드를 쉽게 추적할 수 있습니다.
Spread Pulse 표시기의 주요 장점 중 하나는 색상 시각화입니다. 스프레드 크기에 따라 텍스트 색상이 변경됩니다. 기본적으로 스프레드가 작을 때 텍스트는 녹색으로 표시됩니다. 이는 스프레드가 낮고 거래의 수익성이 더 높을 수 있음을 의미합니다. 그러나 스프레드가 높아지면 표시기 텍스트가 자동으로 빨간색으로 변경됩니다.
또한 사용자는 높고 낮은 스프레드와 관련된 색상을 사용자 정의할 수 있습니다. 정보를 더 쉽게 읽을 수 있도록 글꼴 크기를 변경할 수도 있습니다.
Spread Pulse 지표는 경험 수준 및 거래 전략에 관계없이 모든 거래자에게 이상적입니다. 현재 스프레드에 대한
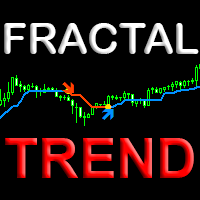
The Fractal Trend indicator visually displays trend changes in price fractals based on the Price Action (PA) principle. The unique algorithm uses the fractal principle of determining a trend change and a new proprietary method of filtering fractals, which gives an advantage in relation to other similar indicators based on MA moving averages. This new approach to trend determination helps to determine with high confidence the trend change points on any financial instrument and on any time frame

The SignalSailor indicator is your reliable assistant in Forex for quick market analysis. It not only reflects the current market condition but also provides valuable signals about the best times to open trades. Market conditions are constantly changing, and to stay ahead, a trader needs to quickly adapt their strategies. This is precisely why the Klaus indicator was created - it will help you accurately determine the direction of the trend on the price chart.
SignalSailor is an indispensable

The TrendTide indicator provides accurate signals about potential market reversals. Its primary purpose is to generate signals for entering and exiting trades. Determining the current market trend is a critically important aspect for traders. The intelligent algorithm of TrendTide efficiently identifies trends, filters market noise, and creates precise entry and exit signals.
This indicator represents an advanced algorithm for visualizing the market trend. It is designed to identify both long

The Market Sentiment Meter indicator calculates the saturation levels of the price chart. A signal to exit the oversold zone indicates a buying opportunity, and a signal to exit the overbought zone indicates a selling opportunity. Typically, for this indicator you need to set relative values for the overbought (Top) and oversold (Bottom) levels.
Often a good trend can be seen visually on the price chart. However, an experienced trader must clearly understand the current distribution of forces

1. Compound Drawings (1) Line segment with arrow (2) Continuous line segment (broken line) (3) Parallelogram (4) Polygon (5) Profit and loss ratio measurement tools
2. Backtracking By the Z key in the process of drawing the line Line types that support Z-key backtracking: continuous line segments (broken line) ,channels,parallelograms,polygons, and fibo extensions.
3.Automatic Adsorption (1) Click the "Lock-Button" to switch the automatic adsorption switch before drawing the line (2)

TrendTrack indicator: Stay on trend easily!
The TrendTrack indicator is designed to analyze price behavior in the Forex market, helping the trader to quickly spot temporary weaknesses or obvious changes in trend direction. Entering the market is only the first step, but maintaining a position is more difficult. With TrendTrack, staying on trend becomes easy!
Peculiarities:
Trend Analysis: The indicator analyzes historical data, providing signals to the trader. The arrow format of the indi
テクニカル指標開発の第一人者であるトム・デマークが考案した TDシーケンシャルは、 トレンドの転換点を判断するのに有用なインディケータです。このインディケータは TDシーケンシャルを裁量およびEAで実際に利用してきた私自身の経験から、より手軽に、かつ効果的に活用できるよう作成された裁量トレード用サインツールです。
強いトレンドが生じている際に多くのだましが生じるのはTDシーケンシャルの弱点と思われますが、これを克服するために強力なフィルターを装備しています。また、最も有効と思われるセットアップ9に絞ってサインを発信します。
全通貨ペア、全タイムフレームで利用できます。勝敗判定機能により、このインディケータの直近の相場環境に対する有効性を確認できます。
設定項目は下記のとおりです。 Enable Protect Mode...強いトレンドが発生した際の連敗を回避します Box Filter...下で設定する3つのタイムフレームでの移動平均でパーフェクト・オーダーが発生していない状態をボックス相場と判定し、サインを限定します Moving Average Time Frame1

The Trendline Trader indicator is designed to reliably track market trends, ignoring sharp fluctuations and noise in the market. This indicator is suitable for trading on both short and long time intervals due to its ability to filter out sudden price spikes and corrections. It is based on the iLow, iHigh, iMA and iATR indicators, which makes it particularly reliable.
Parameters for setting up the indicator: Length: period for channel calculation and noise filtering. Star: period for determin

History VT Информационный индикатор. Показывает на графике, сразу после открытия сделки, стрелку именно на той японской свече, где позиция открыта.
То есть там, где появилась штрихпунктирная линия открытой сделки, в терминале.
Далее, после открытия сделки, как обычно, трейдер ставит SL и TP и ждёт итога своего выбора направления движения.
После того как сделка закрылась, по « sl » или « tp » или «вручную», индикатор отображает на графике уровни и текстовые сноски параметров сделки.
С

Introduction
One of the patterns in "RTM" is the "QM" pattern, also known as "Quasimodo". Its name is derived from the appearance of "Hunchback of Notre-Dame" from Victor Hugo's novel. It is a type of "Head and Shoulders" pattern.
Formation Method
Upward Trend
In an upward trend, the left shoulder is formed, and the price creates a new peak higher than the left shoulder peak . After a decline, it manages to break the previous low and move upward again. We expect the pric
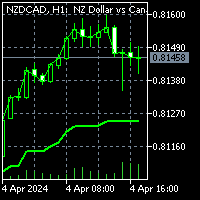
To get access to MT5 version please click here . This is the exact conversion from TradingView: "G-Channel Trend Detection" by "jaggedsoft". This is a light-load processing and non-repaint indicator. You can message in private chat for further changes you need. All input options are available. Buffers are available for processing within EAs. Highlight option is omitted as does not show good in Metatrader.

Advanced Currency Strength Indicator
The Advanced Divergence Currency Strength Indicator. Not only it breaks down all 28 forex currency pairs and calculates the strength of individual currencies across all timeframes , but, You'll be analyzing the WHOLE forex market in 1 window (In just 1 minute) . This indicator is very powerful because it reveals the true movements of the market. It is highly recommended to analyze charts knowing the performance of individual currencies or

Forex Gump Advanced is a ready-made trading strategy based on one indicator. Forex Gump Advanced is an indicator that shows the trader when to open trades, in which direction to open and when to close. Forex Gump Advanced shows all the necessary information in a clear form on the chart. The indicator works on all currency pairs and all timeframes.
Advantages of the indicator: completely ready trading system does not redraw in 95% of cases the price goes in the direction of the signal. 5% of s

APP System Signals는 금융 시장에서 활발히 거래하는 트레이더를 위해 설계된 정교한 지표입니다. 이 지표는 고급 기술 분석을 기반으로 정확한 매수 및 매도 신호를 제공하여 트레이더가 현명한 결정을 내릴 수 있도록 돕습니다. 이 지표는 지수 이동 평균 (EMA), 단순 이동 평균 (SMA) 및 기본적인 트렌드의 조합을 사용하여 신뢰할 수 있는 신호를 생성합니다. 매개 변수는 완전히 사용자 정의할 수 있어 트레이더가 자신의 거래 전략에 지표를 조정할 수 있습니다. 또한 이 지표는 사용하기 쉽고 친절하여 모든 경험 수준의 트레이더에게 필수적인 도구가 됩니다. 초보자든 경험 많은 트레이더든 APP System Signals를 통해 거래 성과를 향상시키고 시장에서 더 현명한 결정을 내릴 수 있습니다.
TeconLab Indicator User Guide Overview The TeconLab Indicator is a tool for MetaTrader 4 (MT4) users, fine-tuned to gather price information, including Date, Time, Open, High, Low, Close, and Volume, and update this data in real-time. Uniquely, this indicator autonomously refreshes the CSV file every minute or less, meaning there's no need for manual restarts—just activate it once, and it will continuously collect data as long as MT4 is running. It maintains the latest data according to the size
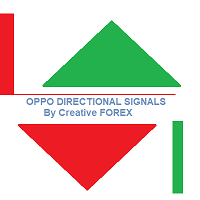
Based on unique formulas and calculations, this indicator analyses every price move on the chart then applies its unique formulas on them to indicate the currently dominant direction. This indicator works on all instruments but best with GOLD (XAUUSD). It can also work as an entry confirmation tool and can also serves highlighting the worthy and noticeable moves on the chart. The Oppo Signals Indicator can work alongside any other strategy and can also help traders devise their own strategies u

The indicator is based on the calculation of liquidity on the market and thus shows where the market can most likely turn.. It shows the places of liquidity where the price will reach sooner or later... The indicator can be set to several types of liquidity and therefore can display several levels on the graph.. It is a unique tool that can help you very well in your trading The indicator is suitable for currency pairs with the most liquidity (EURUSD/GBPUSD...)

Once upon a time, in the bustling streets of Gotham City, there lived a mysterious figure known only as the Joker. With his enigmatic grin and unpredictable nature, the Joker roamed the city's financial district, leaving chaos and uncertainty in his wake. One fateful day, a group of traders stumbled upon a peculiar artifact hidden deep within the dark alleys of Gotham. It was a cryptic indicator known as the "Joker Arrow," rumored to possess the power to predict market movements with uncanny acc

The indicator reveals key levels for gold.
The levels can be used for support and resistance, breakout, break and retest or most strategies.
The major levels can be used for intraday trades from one level to the next or reversals.
The mini levels can be used to scalp lower timeframes.
The color, line style and thickness can be adjusted as preferred.
Symbol: XAUUSD Timeframe: Major levels - M30 - H4 Mini Levels M15 - M1
The levels may enhance your current setup.

The indicator plots key levels automatically for EURUSD.
Major levels - H4,H1 Minor Levels - M30,M15 Mini Levels - M5,M1
To deactivate a level, just select color none.
It can be used to enhance your current strategy. (Please see screenshots)
The color, line style and thickness can be adjusted as preferred.
Symbol: EURUSD Timeframe: H4 and below
Enjoy! ------------------------------------------

TRADE THE BREAKOUTS like Gordon Gekko Gordon Gekko, the ruthless and iconic character from the movie "Wall Street," is renowned for his aggressive and opportunistic trading strategies. When it comes to trading breakouts, Gekko embodies the mindset of a savvy and relentless trader who seizes every opportunity to capitalize on market movements. In Gekko's trading playbook, spotting breakout opportunities is akin to identifying potential gold mines in the market. He meticulously scans the charts

프리메이슨은 전문 분석가 만들 것입니다 도구입니다! 경사 채널을 사용하여 파동 움직임을 결정하는 방법은 모든 악기의 움직임 회로도를 질적으로 전달하여 시장에서 가능한 역전뿐만 아니라 추가 움직임의 목표를 보여줍니다!시장이 살아 있다는 신화를 파괴하고 한 범위에서 다른 범위로 이동하는 회로도를 명확하게 보여줍니다! 현재 추세의 정의와 중기에 적합한 전문 도구! 프리메이슨은 전문 분석가 만들 것입니다 도구입니다! 경사 채널을 사용하여 파동 움직임을 결정하는 방법은 모든 악기의 움직임 회로도를 질적으로 전달하여 시장에서 가능한 역전뿐만 아니라 추가 움직임의 목표를 보여줍니다!시장이 살아 있다는 신화를 파괴하고 한 범위에서 다른 범위로 이동하는 회로도를 명확하게 보여줍니다! 현재 추세의 정의와 중기에 적합한 전문 도구!

The Trend_Scalper_Arrows_Entry&Exit trend indicator perfectly follows the trend, indicates entry search zones, indicates entry signals with arrows, and also indicates zones for fixing market orders with vertical lines. An excellent indicator for both beginners in Forex trading and professionals.
All lines, arrows, alerts can be disabled.
See all indicator parameters on the screenshot.

Channel indicator, written according to a strategy based on indicators: BollingerBands, Moving Average, RSI and TMA. The indicator embodies arrow signals for the trend, counter-trend, and also for fixing transactions. And also all possible alerts. The indicator is ideal for working together with a trend indicator for taking profits. All settings are on screenshots.

Subscribe to the 'MA7 Trading' channel to receive notifications about new programs, updates and other information. Ask questions in the profile on the MQL5 .
Description of work
The 'MA7 Clover' indicator is based on candle shapes. Shows the 'Pin Bar' candle pattern. Detailed information about the 'MA7 Clover' indicator.
Indicator settings
General settings: Min body size ; Max body size ; Min nose size ; Max nose size .
Message settings: Send message to the terminal (Alert) – permission
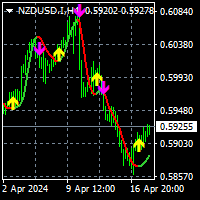
To download MT5 version please click here .
- This is the exact conversion from TradingView: " PA-Adaptive Hull Parabolic " By "Loxx".
- This is a non-repaint and light processing load indicator
- You can message in private chat for further changes you need.
- All input options are available except candle coloring.
- Buffers are available for processing within EAs.
MA Killer Indicator는 이동 평균을 사용하는 트레이더를 위한 최고의 무기입니다. 이는 관리 패널에서 직접 액세스할 수 있는 여러 도구를 사용하는 완전한 시스템입니다. 해당 도구 덕분에 시장 개요를 파악하고 입사를 위한 의사 결정에 귀중한 도움을 받을 수 있습니다.
그것은 다음과 같이 구성됩니다:
- 색상 코드를 사용하여 차트에 추세를 직접 표시하는 추세 차트 마스터 표시기입니다. 이 추세는 두 개의 이동 평균과 여러 오실레이터를 사용하는 알고리즘으로 계산됩니다.
- 9개 시간 단위에 걸쳐 여러 이동 평균(최대 4개)과 관련된 가격 위치를 표시하는 시장 스캐너인 이동 평균 스캐너 표시기입니다.
- 여러 이동평균을 독립적으로 표시할지 여부입니다. 표시기 탭을 통해 추가하거나 제거할 필요가 없습니다.
MT5 version
각 시스템에는 팝업, 이메일 및 푸시 알림을 통해 받을 수 있는 경고가 있습니다. 경고는 제어판을 통해 직접 활성화되거
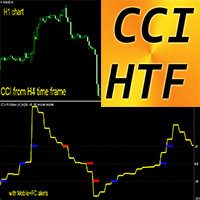
MT4용 외환 표시 CCI HTF 발진기
MT4용 전문 CCI HTF 오실레이터로 거래 방법을 업그레이드하세요. HTF는 더 높은 시간 프레임을 의미합니다. 상품채널지수(CCI)는 현재 가격과 과거 평균 가격의 차이를 측정합니다. 중요 레벨: +/-200, +/-100 +200 영역 이상에서 매도 항목을 가져오고 -200 이하에서 항목을 구매하는 것이 좋습니다. 이 지표는 가격 조치 항목이 있거나 다른 지표와 결합된 다중 시간 프레임 거래 시스템에 탁월합니다. CCI HTF 오실레이터 표시기를 사용하면 더 높은 시간대의 CCI를 현재 차트에 연결할 수 있습니다. 표시기에는 모바일 및 PC 알림이 내장되어 있습니다.
// 더 훌륭한 전문가 자문 및 지표는 여기에서 확인할 수 있습니다: https://www.mql5.com/en/users/def1380/seller 본 MQL5 홈페이지에서만 제공되는 오리지널 제품입니다.
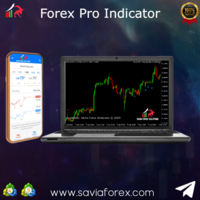
Savia Forex Pro Indicator The Savia Forex Solutions Forex Pro Indicator gives you highly accurate entries on all Forex/Currency pairs, Indices and Cryptocurrencies. The Forex Pro Indicator is dynamic and powerful and is optimized for all timeframes and ALL Currency pairs, Indices, Commodities, and Cryptocurrency pairs. Trade with improved confidence and maximize your success rate. Benefits Dynamic and Powerful. Forex Pro Indicator is fully optimized for all chart timeframes. Forex Pro Indicator

15 years old, 15 years old, 15 years old.
2024 years ago:
️ What to do next.
I want to know what I want to know.
Sorry, I don't know what to do. I want to know, I want to know, I want to know.
I want to know what I want to know.
I want to know what I want to know.
H4(단지 M1에서 M30) I'm here. I'm here.
I want to know what I want to know.
I want to know what I'm saying.
I want to know what I want to know.
I want to know what I want to know. I want to know what I want to know.
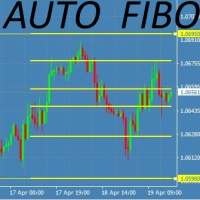
This Fibonacci Indicator is showing fibo retracement lines on chart for EA trading same as the default tool from Metatrader's menu, except this one is fully automatic and changes along with the chart (with modes B and C, then mode A is always fixed by set levels)
AND it also offers the line levels for the Expert Advisors to read (buffers) , so you can set your trades based on crossover\crossunder on those fibo lines.
You can choose from 3 modes for selecting the max HIGH and min LOW limit,

The Forex Correlation Indicator is a powerful tool designed to analyze and display the correlation between different major forex pairs in the market. This indicator helps traders identify relationships and trends between currency pairs, allowing for more informed trading decisions. Key Features: Displays correlation coefficients between pairs. Visualizes correlation strength through color-coded indicators. Customizable settings for timeframes and correlation calculations. User-friendly interfac

The Trend Seeker indicator is perfectly suited for tracking long-term trends in the Forex market and can be used without restrictions on instruments or time intervals. This indicator allows attempting to forecast future values, but its main application lies in generating buy and sell signals. The AlphaTrend Seeker tracks market trends, disregarding sharp fluctuations and noise around the average price. It is based on the idea of technical analysis, asserting that the market has a cyclical n

우리의 Basic Support and Resistance 표시기는 기술 분석을 향상시키는 데 필요한 솔루션입니다.이 표시기는 차트/ MT5 버전
특징
피보나치 수준의 통합 : 지원 및 저항 수준과 함께 피보나치 수준을 표시하는 옵션과 함께, 우리의 지표는 시장 행동과 가능한 역전 영역에 대한 더 깊은 통찰력을 제공합니다.
성능 최적화 : 각 막대의 개구부에서만 확장 라인을 업데이트하는 옵션을 사용하여, 우리의 지표는 지원 및 저항 수준의 정확도를 희생하지 않고 최적의 성능을 보장합니다.
입력 주요 설정 Timeframe: 이 입력을 통해 차트에 더 높은 기간의 지지선과 저항선을 표시하도록 선택할 수 있습니다. Support/Resistance Strength [Number of Bars]: 이 입력을 사용하면 지지대와 저항의 강도를 결정할 수 있습니다.숫자가 높을수록지지/저항이 더 강해집니다. Price mode: 이 매개 변수를 사용하면 지원 및 저항 수준을 계

The "Trend Tandem" indicator is a trend analysis tool in financial markets that helps traders determine the direction of price movement.
Options:
RISK: Determines the level of risk taken into account in the trend analysis. The higher the value, the more aggressively volatility is taken into account. SSP (SSP Period): Defines the period of the moving average used to identify a trend. The higher the value, the smoother the trend signal will be. CountBars: Determines the number of bars on whic

The "Trend Api" indicator is an innovative tool for trend analysis in the Forex market. It has unique features and a wide range of settings that will help traders make informed decisions when trading.
This indicator is based on the analysis of the market trend and helps to identify the direction of price movement. It uses various mathematical algorithms and statistical methods to determine the strength and sustainability of a trend in the market.
One of the key features of the "Trend Api" i
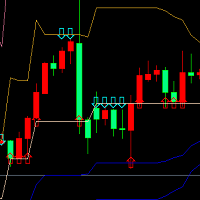
이 지표는 금 분할 이론에 근거하여 각각 과거 22 (기본값) 개의 K선 고저가를 획득하고 금 분할 계수를 통해 지지, 압력 곡선을 계산하는 것이다. 가격이 처음으로 위로 압력선에 접근하거나 압력선에 여러 번 접근할 때 아래로 화살표가 일치하여 압력이 있음을 제시하고 빈 sell을 만들기에 적합하다; 가격이 처음으로 아래로 지지선에 접근하거나 여러 차례 지지선에 접근할 때 위로 향하는 화살표가 일치하여 지지가 있음을 제시하고 buy를 많이 하는 것이 적합하다; 데이터 창에서는 각 지지, 압력선의 가격 수치를 제시하며, 나타나는 화살표는 수치가 up, down에 부합한다.
이 지표는 걸려있는 도표에 단선을 만드는 데 적합하다. 즉 입장하여 창고를 연 후 몇 개의 K선 기둥을 소지한 후 창고를 정리할 수 있다.많이 하면 손상 방지는 지지선 아래에서 압력선 부근에서 멈출 수 있다.비워두면 손상 방지는 압력선 위에 있고 지지선 근처에 가득할 수 있다.
이 지표와 관련된 금 분할 계
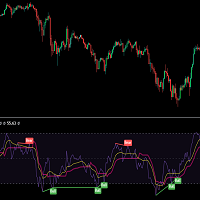
MOST is applied on this RSI moving average with an extra default option added VAR/VIDYA (Variable Index Dynamic Moving Average)
MOST added on RSI has a Moving Average of RSI and a trailing percent stop level of the Moving Average that can be adjusted by changing the length of the MA and %percent of the stop level.
BUY SIGNAL when the Moving Average Line crosses above the MOST Line
LONG CONDITION when the Moving Average is above the MOST
SELL SIGNAL when Moving Average Line crosses belo
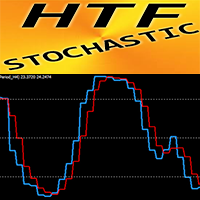
MT4용 외환 지표 HTF 확률론
스토캐스틱 오실레이터는 시장 최고의 지표 중 하나이며 많은 트레이더에게 완벽한 도구입니다. HTF는 더 높은 시간 프레임을 의미합니다. 과매수 구역 - 80 이상; 과매도 1 - 20 미만 HTF 확률론적 지표는 특히 가격 조치 항목이 있는 다중 시간 프레임 거래 시스템에 탁월합니다. 이 지표를 사용하면 더 높은 시간대의 스토캐스틱을 현재 차트에 연결할 수 있습니다. --> 이는 전문적인 거래 접근 방식입니다. 표시기에는 모바일 및 PC 알림이 내장되어 있습니다. HTF Stochastic Oscillator는 일반적인 발산 탐지에도 사용할 수 있습니다.
// 더 훌륭한 전문가 자문 및 지표는 여기에서 확인할 수 있습니다: https://www.mql5.com/en/users/def1380/seller 본 MQL5 홈페이지에서만 제공되는 오리지널 제품입니다.

MAXLUM SYSTEM is a Trading System that uses anti-Margin Call without using SL with a positive correlation Hedging Strategy
Simple example of BUY on EURUSD and SELL on GBPUSD at the same time This kind of trading will not occur as a Margin Call By calculating the GAP difference between the 2 pairs we can take advantage of the GAP
This indicator will be more effective if you use Data Analysis download excel file on telegram Group Please join the Maxlum System Telegram group for details t.me/m

This tool helps you to find easily and clearly when you enter trade with day time and price examples Entered Buy at Monday 20:30 with price 2150 Exited buy at Tues 10: 30 with price 2187 You can convert as local time by inputting shift hours and minutes.
Trading is a learning skill, so you have to evaluate your trading performance at the end of your day. Did you follow your rules? If you did then it was a win, regardless if you earned pips or not. If you didn't follow my rules then is a

The Tripl indicator is designed to visually display the current trend in the market. One of the key aspects of currency market analysis is identifying a trend, which is a stable direction in which prices are moving. For this purpose, the Tripl indicator uses calculations that smooth out sharp fluctuations that do not have a significant impact on the overall trend of price movements.
A trend can be either upward (bullish) or downward (bearish). Most often, a trend develops for a long time befo

이 거래 도구를 사용하면 15개 시장을 동시에 스캔할 수 있습니다.
2024년 새로운 거래 지표 소개:
️ 대시보드 다중 통화 다중 시간 프레임 이중 CCI.
제가 이 거래 도구를 만든 이유는 최소한 두 가지입니다.
첫째, 하나의 시장만 관찰하는 것이 지루합니다. 둘째, 다른 시장에 진입하는 순간을 놓치고 싶지 않습니다.
그렇기 때문에 동시에 다른 시장 상황도 알고 싶습니다.
이러한 이유로 여러 시장의 상황을 동시에 스캔할 수 있는 스캐너가 필요합니다.
나는 종종 빠른 CCI 라인 > (또는 <=) 느린 CCI 라인이 M1에서 H4(또는 단지 M1에서 M30)까지 시작하는 시장을 찾습니다.
내 분석에 동의하신다면 이것이 바로 귀하가 찾고 있던 거래 지표입니다.
시장 상황이 위의 요구 사항을 충족하는 순간을 놓치지 마십시오.
이것은 많은 훌륭한 기능을 갖춘 확률론적 스캐너 또는 대시보드입니다.
빠른 CCI 라인의 데이터를 표시할 수 있습니다.
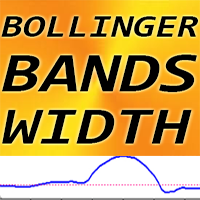
MT4에 대한 외환 표시 볼린저 밴드 폭, 다시 그리기 없음.
-BB 폭 지표는 표준 볼린저 밴드 지표와 함께 사용할 수 있습니다. -이 소프트웨어는 모든 Bollinger Bands 표시기 팬에게 필수입니다. 왜냐하면 이들의 조합은 매우 다양하기 때문입니다. 브레이크아웃 거래에 효율적 -BB 폭 표시기는 볼린저 밴드 사이의 거리(스팬)를 보여줍니다.
BB 폭을 사용하는 방법(그림의 예 참조): 1) 지난 6개월간 BB Width의 가장 낮은 값을 찾아 여기에 25%를 더해 LEVEL을 구합니다. 2) BB 폭 표시기에 LEVEL을 부착합니다. 또한 Bollinger Bands 표시기를 차트에 첨부하십시오. 3)볼린저 밴드 지표 경계선과 BB 너비 값이 LEVEL보다 낮아질 때까지 가격이 고정될 때까지 기다립니다. 4) 볼린저 밴드 인디케이터 보더(캔들은 밴드 외부에서 닫혀야 함)를 통한 돌파를 예상하고 BB 폭을 확인하세요. LEVEL보다 높아야 합니다. 5) 돌파 방향으

이 거래 도구를 사용하면 15개 시장을 동시에 스캔할 수 있습니다.
2024년 새로운 거래 지표 소개:
️ 대시보드 다중 통화 다중 시간 프레임 이중 RSI.
제가 이 거래 도구를 만든 이유는 최소한 두 가지입니다.
첫째, 하나의 시장만 관찰하는 것이 지루합니다. 둘째, 다른 시장에 진입하는 순간을 놓치고 싶지 않습니다.
그렇기 때문에 동시에 다른 시장 상황도 알고 싶습니다.
이러한 이유로 여러 시장의 상황을 동시에 스캔할 수 있는 스캐너가 필요합니다.
나는 종종 빠른 RSI 라인 > (또는 <=) 느린 RSI 라인이 M1에서 H4(또는 단지 M1에서 M30)까지 시작하는 시장을 찾습니다.
그리고 M1부터 M30까지 과매도/과매수 상태인 시장을 자주 찾아봅니다.
내 분석에 동의하신다면 이것이 바로 귀하가 찾고 있던 거래 지표입니다.
시장 상황이 위의 요구 사항을 충족하는 순간을 놓치지 마십시오.
이것은 많은 훌륭한 기능을 갖춘 확률론적 스캐

Elevate your trading game with TigerSignals – the ultimate MetaTrader 4 indicator. Designed for simplicity and precision, TigerSignals provides crystal-clear buy and sell signals, making it a must-have for traders of all levels.
Features: User-Friendly: Easy-to-use interface ensures hassle-free integration into your trading strategy. Alerts: Sound, phone, and email alerts. Receive notifications when a new signal appears, giving you the freedom to step away from the chart! Lot Size Calcula

The indicator show Higher timeframe candles for ICT technical analisys Higher time frames reduce the 'noise' inherent in lower time frames, providing a clearer, more accurate picture of the market's movements.
By examining higher time frames, you can better identify trends, reversals, and key areas of support and resistance.
The Higher Time Frame Candles indicator overlays higher time frame data directly onto your current chart.
You can easily specify the higher time frame candles yo

Auto Multi Channels VT Ещё один технический индикатор в помощь трейдеру. Данный индикатор, автоматически показывает, наклонные каналы в восходящем,
нисходящем и боковом движении цены, т.е. тренды. (Внутри дня. Среднесрочные и долгосрочные, а также Восходящие, нисходящие и боковые).
О понятии Тренд. На бирже, трендом называется направленное движение ценового графика в одну из сторон (вверх или вниз) . То есть, тренд в трейдинге — это ситуация,
когда цена определенное время возрастает или

Introducing the Ultimate Horizontal Line Alert Indicator for MT4! Transform your trading with the smartest tool in the market. Our Horizontal Line Alert Indicator isn't just any indicator — it's your new trading partner that combines precision, flexibility, and intuitive control. What Does It Do? This revolutionary MT4 indicator automatically adjusts trend lines to be horizontal with just the press of the 'L' key. It’s perfect for traders who want to focus on specific price levels, ensu
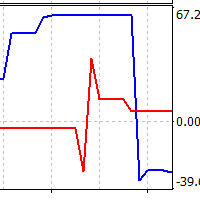
Two lines are being drawn in a separate window. And both are representing an angle of a trendline. One trendline is measured going across two price highs, but the other is measured across two lows. You get to choose the period from which the first price high and first price low is being determined. The second high and low comes from identical time period preceding the first one. Feel free to experiment with the period count until you get the confirmation you are looking for.

TrendWave Oscillator is an advanced MT4 oscillator that not only identifies the trend direction but also provides visual and audio alerts to enhance trading strategies.
Key Features: - Color-coded trend indication: - Blue : Indicates an uptrend, signaling potential price growth. - Orange : Indicates a downtrend, suggesting possible price decline. - Gray : Represents a flat market or lack of clear entry signals.
- Graphical signals on the chart : - Aqua : Highlights an uptrend, empha
AlphaTrend AM is an indicator that allows you to open a position at the very beginning of a significant price movement. The second most important quality of the indicator is the ability to follow the trend as long as possible in order to obtain all potential profits while minimizing potential losses. The indicator determines the trend and points to possible entry points formed by local highs/lows. The indicator allows you to notify the user about your signals by sending messages to the terminal

Safe Trade Indicator MT4
The Safe Trade indicator is an analytical and technical tool that has different features and very accurate signals. This indicator can be used in various markets such as the stock market and the forex market. It states and also provides buy and sell signals.
Features of the Safe Trade indicator
Receiving signals as notifications on the Metatrader mobile application. Receive signals by email. Receiving signals in the form of warning messages or alarms on Metatrader.

Title: BBMA Structure Guide - BBMA Structure Guide
Description: BBMA Structure Guide is a specialized MQL4 indicator designed to help traders understand the journey of BBMA structure more easily and efficiently. BBMA, or "Bollinger Bands Moving Average," is known for its motto "One Step Ahead," highlighting the importance of understanding market structure in depth.
With BBMA Structure Guide, you can quickly identify the underlying market structure patterns that drive price movements. This w

TLBD Chart Indicator MT4
Drawing a trend line in price charts is one of the most important methods to identify the market trend, many traders use the trend line break for positioning because they believe that the trend line break means changing the trend and creating a new trend. As a result, the breaking of the trend line is an important sign for traders to open their positions in the direction of the trend. The TLBD indicator is a very suitable tool for detecting the breaking of dynamic tren
MetaTrader 마켓은 거래로봇과 기술지표를 판매하기에 최적의 장소입니다.
오직 어플리케이션만 개발하면 됩니다. 수백만 명의 MetaTrader 사용자에게 제품을 제공하기 위해 마켓에 제품을 게시하는 방법에 대해 설명해 드리겠습니다.
트레이딩 기회를 놓치고 있어요:
- 무료 트레이딩 앱
- 복사용 8,000 이상의 시그널
- 금융 시장 개척을 위한 경제 뉴스
등록
로그인
계정이 없으시면, 가입하십시오
MQL5.com 웹사이트에 로그인을 하기 위해 쿠키를 허용하십시오.
브라우저에서 필요한 설정을 활성화하시지 않으면, 로그인할 수 없습니다.