Technische Indikatoren für den MetaTrader 4 - 136
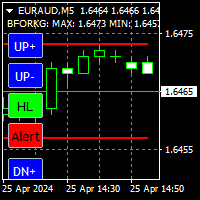
Very useful indicator, you won't be able to be without it. Essential for scalping. It shows rebound levels, top and bottom, forming a fork that surrounds the price. Each level has two blue controls associated to change it, has one green control for rebound mode: High/Low or Open/Close, and has a red breakage alert control. The values of each level, and the distance between levels in pips, are shown at the top left. Features: -T wo independent modes of operation: High/Low, Open/Close. -When on
Der Indikator für den Handel mit Forex und binären Optionen basiert auf dem Standardindikator Mt4 des einfachen gleitenden Durchschnitts. Der Unterschied zum Standardindikator besteht jedoch darin, dass seine Linien je nach Trendstatus in verschiedenen Farben gestrichen werden. Wenn die Farbe grün ist, dann ist der Kauftrend. Wenn es rot ist, dann zum Verkauf. Wenn sich die Trendphase ändert, wird neben dem Puffer in der Mitte der Linien ein akustischer Alarm im Diagramm angezeigt. Dadurch könne

UPDATED VERSION INCORPERATES FIBONACCI FOR BETTER LEVELS AI Powered Price Clustering" is a custom indicator that integrates k means and Fibonacci. This powerful tool provides traders with valuable insights into price clustering patterns, facilitating more informed trading decisions. How it works: With "AI Powered Price Clustering," traders gain access to: A K means algorithm for precise analysis of price clustering patterns. Identification of key Fibonacci levels and centroids for enhanced tech
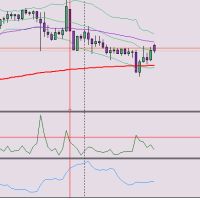
How many time is Candle's Range bigger than Atr indicator? HERE IS THE ANSWER YOU WERE LOOKING FOR!! This awesome indicator is meant to better read market and keep Valuable informations for a good trading payload. let me know if you like it in comments, if it's usefull and if you have hints to make it better i would appreciate it.
this indicator measures proportion between range and atr

The Practitioner indicator is based on a unique algorithm for analyzing price behavior and presents the result of this complex work in the form of lines. One of the advantages of this indicator is that it automatically changes the color of the line according to the current direction of the price movement.
It is important to note that the indicator has an option to enable alerts when the line color changes. This gives the trader the opportunity to quickly respond to changes and identify new tr

TrendMaster: Your Ultimate Non-Repaint Trading Indicator for Consistent Profits Introducing TrendMaster , the cutting-edge NONREPAINT Trading indicator that empowers traders to seize market opportunities with unparalleled precision. Utilizing a sophisticated blend of the Relative Strength Index (RSI), Stochastic Oscillator, and Average Directional Index (ADX), TrendMaster delivers highly accurate buy and sell signals, allowing traders to capitalize on both bullish and bearish trends confidently

The EntryHub system by MQ4.org is designed for Forex trading and is available as an indicator for the popular MetaTrader 4 (MT4) platform. Let’s delve into its details: Forex Entry Point System : The Forex Entry Point System is an MT4 indicator that assists traders in identifying potential entry points for their trades. It provides signals based on specific market conditions, helping traders make informed decisions. While it’s essential to note that no indicator is fo

The RSI Advanced tool will help traders capture trends and optimal entry points by:
- Enter a Buy order when the green line crosses the yellow line. Provided that the yellow line is near line 32 or 20 - Enter a Sell order when the green line crosses the yellow line. Provided that the yellow line is near line 68 or 80
Additionally, you can combine it with the convergence divergence that occurs at the green line. **When you purchase the Mastering the RSI MT4 or Mastering the RSI MT5 indicator

SmartSignal Sniper: Dein ultimativer Trading-Partner Entdecke die Kraft präzisen Tradings mit SmartSignal Sniper. Entwickelt, um genaue Kauf- und Verkaufssignale zu liefern, ermöglicht dieses fortschrittliche Tool Tradern aller Erfahrungsstufen, mit Zuversicht und Klarheit durch die Finanzmärkte zu navigieren. Hauptmerkmale: Präzise Genauigkeit: SmartSignal Sniper verwendet fortschrittliche Algorithmen, um genaue Kauf- und Verkaufssignale bereitzustellen und Tradern zu helfen, profitablen Chance
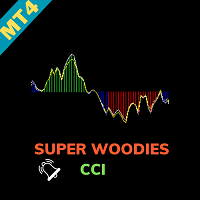
Super Woodies CCI Indicator - Enhance Your Trading Precision Step into the realm of precision trading with the "Super Woodies CCI Indicator" for MetaTrader 4. This advanced tool, inspired by Woodie's CCI, is designed to provide you with clear insights into market trends, enabling you to make well-informed trading decisions. Basic Details : Indicator Type : Super Woodies CCI Indicator Key Metrics : Real-time CCI (Commodity Channel Index) analysis for price trends. Customization : Fully customizab

Adaptive Market Dynamics Indicator (AMDI) is an innovative tool for traders across all financial markets. This indicator is designed to provide traders with a deep understanding of market dynamics and adaptive trading signals based on current market conditions. Key Features and Benefits: Adaptive Analytics : AMDI can automatically adapt to changing market conditions, allowing traders to effectively adjust their strategies in real-time. Multifactor Analysis : The indicator offers a comprehensiv

OVERVIEW
K-means is a clustering algorithm commonly used in machine learning to group data points into distinct clusters based on their similarities. While K-means is not typically used directly for identifying support and resistance levels in financial markets, it can serve as a tool in a broader analysis approach.
Support and resistance levels are price levels in financial markets where the price tends to react or reverse. Support is a level where the price tends to stop falling
'Zoro LITE' is a reversal strategy based MT4 indicator with advance pre-alert system. Its an 100% non repaint indicator with an average accuracy of about 70-95% in a ranging market. --------------------------------------------------------- Features: Neural Network based Advance price action algorithms Pre-alert (get ready) signals Non-delay indications 24/7 signals OTC markets supported Auto-trading supported 100% Non repaint 100% No lag No recalculating Lifetime license -----------------------
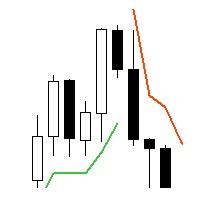
Supertrend - невероятно мощный и универсальный индикатор, предназначенный для помощи трейдерам в определении текущего тренда на конкретном торговом инструменте. С помощью двух встроенных индикаторов, Average True Range и Standard Deviation, трейдеры могут выбрать наиболее подходящий индикатор для своей стратегии торговли. Пользователи также могут настроить период этих индикаторов и выбрать цену (Close, High, Low, Open, Weighted), к которой он должен быть применен, с Typical price в качестве опци

Trop is a trend indicator that has several important advantages. It helps to pinpoint both new and existing trends in the market. One of its key advantages is its quick adjustment and responsiveness to changes in schedule. The effectiveness of the indicator depends on the set CalcBars period. The longer this period, the smoother the indicator displays the trend line. On the other hand, as the period decreases, the indicator takes into account more market noise, which can be useful in generating

In the world of trading, one of the main concerns is finding a reliable trading system. Meet the TrendEdge Channel indicator - your reliable companion in this search. Developed based on complex mathematical calculations, this indicator predicts the most likely short-term price movements.
TrendEdge Channel is designed specifically to identify trends in price movements. Thanks to it, you can quickly determine not only the direction of the trend, but also the levels of interaction between buyers

The TrendScope Pro indicator views the chart as a function with the X-axis representing time and the Y-axis representing price, expressed in bars and pips respectively. The main objective of the indicator is to provide users with signals for actions when the function forms continuous movement in one direction over a specific period of time. The indicator parameters need to be adjusted individually for each currency pair, as the price function varies for different pairs.
The indicator provides

Der Spread Pulse -Indikator ist ein effektives Tool, das Händlern Informationen über den aktuellen Spread auf dem Chart liefert. Der Spread ist die Differenz zwischen dem Kaufpreis und dem Verkaufspreis eines Instruments.
Der Indikator wird in Form von Text dargestellt, der im Diagramm angezeigt wird. Dadurch kann der Händler den aktuellen Spread leicht verfolgen.
Einer der Hauptvorteile des Spread Pulse-Indikators ist seine Farbvisualisierung. Abhängig von der Spread-Größe ändert sich di
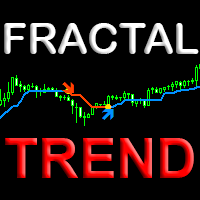
The Fractal Trend indicator visually displays trend changes in price fractals based on the Price Action (PA) principle. The unique algorithm uses the fractal principle of determining a trend change and a new proprietary method of filtering fractals, which gives an advantage in relation to other similar indicators based on MA moving averages. This new approach to trend determination helps to determine with high confidence the trend change points on any financial instrument and on any time frame

The SignalSailor indicator is your reliable assistant in Forex for quick market analysis. It not only reflects the current market condition but also provides valuable signals about the best times to open trades. Market conditions are constantly changing, and to stay ahead, a trader needs to quickly adapt their strategies. This is precisely why the Klaus indicator was created - it will help you accurately determine the direction of the trend on the price chart.
SignalSailor is an indispensable

The TrendTide indicator provides accurate signals about potential market reversals. Its primary purpose is to generate signals for entering and exiting trades. Determining the current market trend is a critically important aspect for traders. The intelligent algorithm of TrendTide efficiently identifies trends, filters market noise, and creates precise entry and exit signals.
This indicator represents an advanced algorithm for visualizing the market trend. It is designed to identify both long

The Market Sentiment Meter indicator calculates the saturation levels of the price chart. A signal to exit the oversold zone indicates a buying opportunity, and a signal to exit the overbought zone indicates a selling opportunity. Typically, for this indicator you need to set relative values for the overbought (Top) and oversold (Bottom) levels.
Often a good trend can be seen visually on the price chart. However, an experienced trader must clearly understand the current distribution of forces

USDLFX is a currency index of US dollar formulated by LiteForex broker. It is an attempt to create an indicator for USD currency power. The idea has been further extended to other major Forex currencies. These indices are not available on other brokers. There are other currencies AUD CAD EUR CHF GBP NZD JPY Thanks to this indicator, you have an objective view of the selected currency

1. Compound Drawings (1) Line segment with arrow (2) Continuous line segment (broken line) (3) Parallelogram (4) Polygon (5) Profit and loss ratio measurement tools
2. Backtracking By the Z key in the process of drawing the line Line types that support Z-key backtracking: continuous line segments (broken line) ,channels,parallelograms,polygons, and fibo extensions.
3.Automatic Adsorption (1) Click the "Lock-Button" to switch the automatic adsorption switch before drawing the line (2)

TrendTrack indicator: Stay on trend easily!
The TrendTrack indicator is designed to analyze price behavior in the Forex market, helping the trader to quickly spot temporary weaknesses or obvious changes in trend direction. Entering the market is only the first step, but maintaining a position is more difficult. With TrendTrack, staying on trend becomes easy!
Peculiarities:
Trend Analysis: The indicator analyzes historical data, providing signals to the trader. The arrow format of the indi

The Trendline Trader indicator is designed to reliably track market trends, ignoring sharp fluctuations and noise in the market. This indicator is suitable for trading on both short and long time intervals due to its ability to filter out sudden price spikes and corrections. It is based on the iLow, iHigh, iMA and iATR indicators, which makes it particularly reliable.
Parameters for setting up the indicator: Length: period for channel calculation and noise filtering. Star: period for determin

History VT Информационный индикатор. Показывает на графике, сразу после открытия сделки, стрелку именно на той японской свече, где позиция открыта.
То есть там, где появилась штрихпунктирная линия открытой сделки, в терминале.
Далее, после открытия сделки, как обычно, трейдер ставит SL и TP и ждёт итога своего выбора направления движения.
После того как сделка закрылась, по « sl » или « tp » или «вручную», индикатор отображает на графике уровни и текстовые сноски параметров сделки.
С

Introduction
One of the patterns in "RTM" is the "QM" pattern, also known as "Quasimodo". Its name is derived from the appearance of "Hunchback of Notre-Dame" from Victor Hugo's novel. It is a type of "Head and Shoulders" pattern.
Formation Method
Upward Trend
In an upward trend, the left shoulder is formed, and the price creates a new peak higher than the left shoulder peak . After a decline, it manages to break the previous low and move upward again. We expect the pric
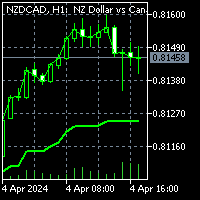
To get access to MT5 version please click here . This is the exact conversion from TradingView: "G-Channel Trend Detection" by "jaggedsoft". This is a light-load processing and non-repaint indicator. You can message in private chat for further changes you need. All input options are available. Buffers are available for processing within EAs. Highlight option is omitted as does not show good in Metatrader.

Forex Gump Advanced ist eine vorgefertigte Handelsstrategie, die auf einem Indikator basiert. Forex Gump Advanced ist ein Indikator, der dem Händler anzeigt, wann er Geschäfte eröffnen, in welche Richtung er eröffnen und wann er schließen muss. Forex Gump Advanced zeigt alle notwendigen Informationen übersichtlich im Chart an.
Vorteile des Indikators: Komplett fertiges Handelssystem wird nicht neu gezeichnet in 95 % der Fälle bewegt sich der Preis in Richtung des Signals. 5 % der Signale funk

APP System Signals ist ein anspruchsvoller Indikator, der für aktive Trader auf den Finanzmärkten entwickelt wurde. Er bietet präzise Kauf- und Verkaufssignale auf Basis einer fortgeschrittenen technischen Analyse, was es den Händlern ermöglicht, fundierte Entscheidungen zu treffen. Der Indikator verwendet eine Kombination aus exponentiellen gleitenden Durchschnitten (EMA), einfachen gleitenden Durchschnitten (SMA) und zugrunde liegenden Trends, um zuverlässige Signale zu generieren. Die Paramet
Based on unique formulas and calculations, this indicator analyses every price move on the chart then applies its unique formulas on them to indicate the currently dominant direction. This indicator works on all instruments but best with GOLD (XAUUSD). It can also work as an entry confirmation tool and can also serves highlighting the worthy and noticeable moves on the chart. The Oppo Signals Indicator can work alongside any other strategy and can also help traders devise their own strategies u

The indicator is based on the calculation of liquidity on the market and thus shows where the market can most likely turn.. It shows the places of liquidity where the price will reach sooner or later... The indicator can be set to several types of liquidity and therefore can display several levels on the graph.. It is a unique tool that can help you very well in your trading The indicator is suitable for currency pairs with the most liquidity (EURUSD/GBPUSD...)

Once upon a time, in the bustling streets of Gotham City, there lived a mysterious figure known only as the Joker. With his enigmatic grin and unpredictable nature, the Joker roamed the city's financial district, leaving chaos and uncertainty in his wake. One fateful day, a group of traders stumbled upon a peculiar artifact hidden deep within the dark alleys of Gotham. It was a cryptic indicator known as the "Joker Arrow," rumored to possess the power to predict market movements with uncanny acc
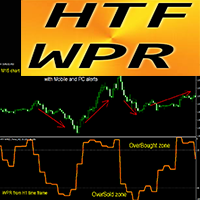
Powerful Forex Indicator HTF WPR Oscillator for MT4 Upgrade your trading methods with the professional HTF WPR Oscillator for MT4. H TF means - H igher Time Frame WPR is one of the top oscillators for scalping This indicator is excellent for Multi-Time Frame trading systems with Price Action entries from OverSold/Bought areas . HTF WPR Indicator allows you to attach WPR from Higher time frame to your current chart --> this is professional trading approach Indicator
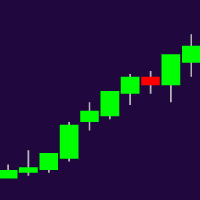
Higher Timeframe Chart Overlay will display higher timeframe candles, including the number of candles high/low you specify.
You no longer need to switch timeframes to check the candles. Everything can be shown in one chart. MT5 Version : https://www.mql5.com/en/market/product/115682 Almost everything can be change as you want. You can change/set:
- Choose different colors for the body and top/bottom wicks.
- Panel's height and width.
- The width of the body and wicks
- Change backgro

The indicator reveals key levels for gold.
The levels can be used for support and resistance, breakout, break and retest or most strategies.
The major levels can be used for intraday trades from one level to the next or reversals.
The mini levels can be used to scalp lower timeframes.
The color, line style and thickness can be adjusted as preferred.
Symbol: XAUUSD Timeframe: Major levels - M30 - H4 Mini Levels M15 - M1
The levels may enhance your current setup.

The indicator plots key levels automatically for EURUSD.
Major levels - H4,H1 Minor Levels - M30,M15 Mini Levels - M5,M1
To deactivate a level, just select color none.
It can be used to enhance your current strategy. (Please see screenshots)
The color, line style and thickness can be adjusted as preferred.
Symbol: EURUSD Timeframe: H4 and below
Enjoy! ------------------------------------------

TRADE THE BREAKOUTS like Gordon Gekko Gordon Gekko, the ruthless and iconic character from the movie "Wall Street," is renowned for his aggressive and opportunistic trading strategies. When it comes to trading breakouts, Gekko embodies the mindset of a savvy and relentless trader who seizes every opportunity to capitalize on market movements. In Gekko's trading playbook, spotting breakout opportunities is akin to identifying potential gold mines in the market. He meticulously scans the charts
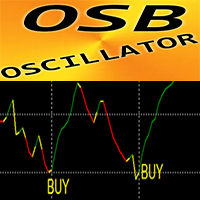
OSB Oscillator - is advanced custom indicator, efficient Price Action auxiliary tool! Advanced new calculation method is used. New generation of Oscillators - see pictures to check how to use it. OSB Oscillator is auxiliary tool to find exact entry points for Price Action, Divergence and Oversold/OverBought signals Oversold values: below 30 Overbought values: over 70 There are plenty of opportunities to upgrade even standard strategies with this indicator. It is much faster and more accurate

"Awesome Market Prediction" is a revolutionary indicator designed to provide accurate and sophisticated market predictions to traders. Developed with cutting-edge technology and intelligent algorithms, this indicator offers deep insights into future market movements. Key features of "Awesome Market Prediction" include: High Accuracy Predictions : Utilizing in-depth data analysis and advanced prediction techniques, this indicator delivers highly accurate estimates of market direction. Multiple Ma

MASONS ist ein Werkzeug, das Sie zu einem professionellen Analytiker macht! Die Methode zur Bestimmung von Wellenbewegungen mit Hilfe von geneigten Kanälen vermittelt die Bewegungsmuster jedes Instruments qualitativ und zeigt nicht nur mögliche Umkehrungen auf dem Markt, sondern auch die Ziele weiterer Bewegungen!Zerstört den Mythos, dass der Markt am Leben ist, indem er die Schematik mit Bewegungen von einem Bereich zum anderen deutlich zeigt! Professionelles Werkzeug,geeignet für die mittelfr

The Trend_Scalper_Arrows_Entry&Exit trend indicator perfectly follows the trend, indicates entry search zones, indicates entry signals with arrows, and also indicates zones for fixing market orders with vertical lines. An excellent indicator for both beginners in Forex trading and professionals.
All lines, arrows, alerts can be disabled.
See all indicator parameters on the screenshot.

Channel indicator, written according to a strategy based on indicators: BollingerBands, Moving Average, RSI and TMA. The indicator embodies arrow signals for the trend, counter-trend, and also for fixing transactions. And also all possible alerts. The indicator is ideal for working together with a trend indicator for taking profits. All settings are on screenshots.
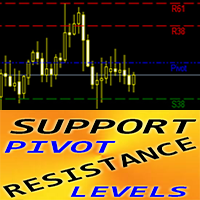
Forex Indicator "Pivot Support Resistance Levels Day Week Month" for MT4 Indicator " Pivot SR Levels D_W_M " is a very powerful auxiliary indicator for Price Action trading This particular indicator is using Fibonacci numbers in calculation. Pivot Levels are calculated as an average of significant prices from the performance of a market in the prior trading period Pivot Levels itself represent levels of highest resistance or support, depending on the overall market condition Indicator "

Subscribe to the 'MA7 Trading' channel to receive notifications about new programs, updates and other information. Ask questions in the profile on the MQL5 .
Description of work
The 'MA7 Clover' indicator is based on candle shapes. Shows the 'Pin Bar' candle pattern. Detailed information about the 'MA7 Clover' indicator.
Indicator settings
General settings: Min body size ; Max body size ; Min nose size ; Max nose size .
Message settings: Send message to the terminal (Alert) – permission
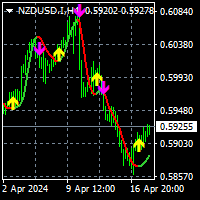
To download MT5 version please click here .
- This is the exact conversion from TradingView: " PA-Adaptive Hull Parabolic " By "Loxx".
- This is a non-repaint and light processing load indicator
- You can message in private chat for further changes you need.
- All input options are available except candle coloring.
- Buffers are available for processing within EAs.
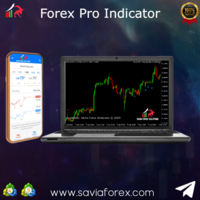
Savia Forex Pro Indicator The Savia Forex Solutions Forex Pro Indicator gives you highly accurate entries on all Forex/Currency pairs, Indices and Cryptocurrencies. The Forex Pro Indicator is dynamic and powerful and is optimized for all timeframes and ALL Currency pairs, Indices, Commodities, and Cryptocurrency pairs. Trade with improved confidence and maximize your success rate. Benefits Dynamic and Powerful. Forex Pro Indicator is fully optimized for all chart timeframes. Forex Pro Indicator

Mit diesem Handelstool können Sie 15 Märkte gleichzeitig scannen.
Einführung eines neuen Handelsindikators 2024:
️ Dashboard Multi-Währung Multi-Time-Frame Stochastic.
Es gibt mindestens zwei Gründe, warum ich dieses Handelstool entwickelt habe:
Erstens ist es mir langweilig, nur einen Markt zu beobachten. Zweitens möchte ich den Einstieg in einen anderen Markt nicht verpassen.
Deshalb möchte ich gleichzeitig auch andere Marktbedingungen kennen.
Aus diesem Grund benötige ich einen
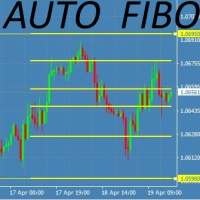
This Fibonacci Indicator is showing fibo retracement lines on chart for EA trading same as the default tool from Metatrader's menu, except this one is fully automatic and changes along with the chart (with modes B and C, then mode A is always fixed by set levels)
AND it also offers the line levels for the Expert Advisors to read (buffers) , so you can set your trades based on crossover\crossunder on those fibo lines.
You can choose from 3 modes for selecting the max HIGH and min LOW limit,
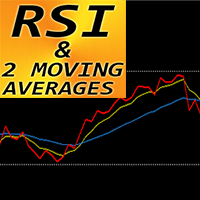
Forex Indicator "RSI and 2 Moving Averages" for MT4 This indicator is excellent for Momentum trading systems . " RSI and 2 MAs" Indicator allows you to see Fast and Slow Moving Averages of RSI itself Indicator gives opportunities to see the trend change very early " RSI and 2 MAs" can be used to catch the momentum into the trend direction It is very easy to set up this indicator via parameters (see the picture) Indicator can be used on any time-frame // More great Expert Advisors and I

The Forex Correlation Indicator is a powerful tool designed to analyze and display the correlation between different major forex pairs in the market. This indicator helps traders identify relationships and trends between currency pairs, allowing for more informed trading decisions. Key Features: Displays correlation coefficients between pairs. Visualizes correlation strength through color-coded indicators. Customizable settings for timeframes and correlation calculations. User-friendly interfac
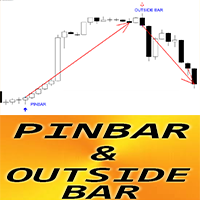
Forex Indicator " Pin Bar & Outside bar Patterns" for MT4 Indicator " Pin Bar & Outside Bar Patterns " is very powerful for Price Action trading Indicator detects Pin Bar and Outside bar Patterns on chart: Bullish pattern - Blue arrow signal on chart (see pictures) Bearish pattern - Red arrow signal on chart (see pictures) No repaint; No delays; with PC, Mobile & Email alerts Indicator "Pin Bar & Outside Bar Patterns " is excellent to combine with Support/Resistance Levels:

The Forex indicator TrendNavigator is a technical indicator. TrendNavigator is a tool that allows traders employing this strategy to better understand what is happening in the market and predict in which direction the price will continue to move. The indicator's values are calculated based on price movements of the currency pair or any other financial asset. Within the scope of technical analysis, the TrendNavigator indicator is used by traders to forecast future price values or the overall

The Trend Seeker indicator is perfectly suited for tracking long-term trends in the Forex market and can be used without restrictions on instruments or time intervals. This indicator allows attempting to forecast future values, but its main application lies in generating buy and sell signals. The AlphaTrend Seeker tracks market trends, disregarding sharp fluctuations and noise around the average price. It is based on the idea of technical analysis, asserting that the market has a cyclical n

Unser Basic Support and Resistance Indikator ist die Lösung, die Sie für die Steigerung Ihrer technischen Analyse benötigen.Mit diesem Indikator können Sie Support- und Widerstandsebenen in der Tabelle projizieren/ MT5 -Version
Funktionen
Integration von Fibonacci -Ebenen: Mit der Option, Fibonacci -Werte neben Unterstützung und Widerstandsniveau anzuzeigen, gibt unser Indikator einen noch tieferen Einblick in das Marktverhalten und mögliche Umkehrbereiche.
Leistungsoptimierung: Mit der Op

The "Trend Tandem" indicator is a trend analysis tool in financial markets that helps traders determine the direction of price movement.
Options:
RISK: Determines the level of risk taken into account in the trend analysis. The higher the value, the more aggressively volatility is taken into account. SSP (SSP Period): Defines the period of the moving average used to identify a trend. The higher the value, the smoother the trend signal will be. CountBars: Determines the number of bars on whic

The "Trend Api" indicator is an innovative tool for trend analysis in the Forex market. It has unique features and a wide range of settings that will help traders make informed decisions when trading.
This indicator is based on the analysis of the market trend and helps to identify the direction of price movement. It uses various mathematical algorithms and statistical methods to determine the strength and sustainability of a trend in the market.
One of the key features of the "Trend Api" i
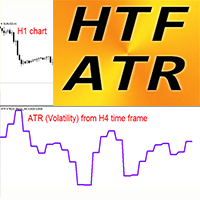
Forex Volatility Indicator HTF ATR for MT4 Average True Range itself is one of the most impotrant indicators for traders - it shows market volatility H TF ATR is a market volatility indicator used in technical analysis . HTF means - H igher Time Frame ATR is great to plan your dynamic Take Profits / SL locations: For example most optimal SL values are located in 1.2-2.5 ATR values This indicator is a useful tool to add to any trading system HTF ATR Indicator allows you t
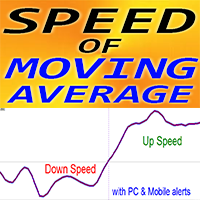
Forex Indicator "MA Speed" for MT4, No Repaint. SPEED of Moving Average - is unique trend indicator The calculation of this indicator is based on equations from physics . Speed is the 1st derivative of Moving average MA Speed indicator shows how fast MA itself changes its direction There are plenty of opportunities to upgrade even standard strategies with MA Speed . Suitable for SMA, EMA, SMMA and LWMA It is recommended to use MA Speed in trend strategies , if indic
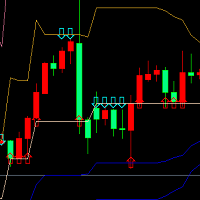
Dieser Indikator basiert auf der Goldenen Ratio-Theorie, die die hohen und niedrigen Preise der vergangenen 22 (Standard) K-Linien erhält und die Stütz- und Druckkurven durch den Goldenen Ratio-Koeffizienten berechnet. Wenn sich der Kurs zum ersten Mal oder mehrmals der Drucklinie nähert, erscheint ein Abwärtspfeil, der anzeigt, dass Druck besteht und es geeignet ist, Shortsells zu verkaufen; Wenn sich der Kurs zum ersten Mal oder mehrmals der Unterstützungslinie nähert, erscheint ein Aufwärtsp
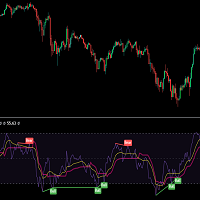
MOST is applied on this RSI moving average with an extra default option added VAR/VIDYA (Variable Index Dynamic Moving Average)
MOST added on RSI has a Moving Average of RSI and a trailing percent stop level of the Moving Average that can be adjusted by changing the length of the MA and %percent of the stop level.
BUY SIGNAL when the Moving Average Line crosses above the MOST Line
LONG CONDITION when the Moving Average is above the MOST
SELL SIGNAL when Moving Average Line crosses belo
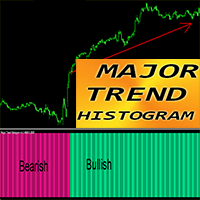
Forex Indicator "Major Trend Histogram" for MT4 Major Trend Histogram indicator designed to catch really huge trends Indicator can be in 2 colors: DeepPink for bearish trend and SpringGreen for bullish one (colors can be changed) It detects trends on the beginning stages - way more efficient than any standard MA cross M ajor Trend Histogram can be combined with any other trading methods: Price Action, VSA, other indicators Indicator has built-in Mobile and PC alerts
// More great Exper
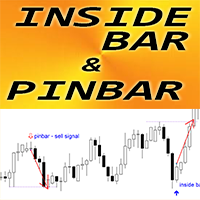
Forex Indicator " Inside Bar & PinBar Patterns" for MT4 Indicator " Inside Bar & PinBar Patterns " is very powerful for Price Action trading Indicator detects Inside Bar and PinBar Patterns on chart: Bullish pattern - Blue arrow signal on chart (see pictures) Bearish pattern - Red arrow signal on chart (see pictures) No repaint; No delays; Inside Bar itself has High R/R ratio (reward/risk) with PC, Mobile & Email alerts Indicator " Inside Bar & PinBar Patterns " is excellent t

MA Trend Following Indicator for MT4 is a simple technical analysis tool designed to follow the trend in any currency pair chosen by the trader by combining 3 moving averages on two different time frames, one long term and one short term.
It basically provides a bullish or bearish signal when the moving averages on one time frame align with the moving averages on a different time frame to have a confluence signal.
The indicator is presented as a screener with multiple currency pairs (that
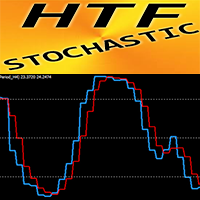
Forex Indicator HTF Stochastic for MT4 Stochastic oscillator is one of the best indicators on the market - perfect tool for many traders. H TF means - H igher Time Frame OverBought zone - above 80; OverSold one - below 20 HTF Stochastic indicator is excellent for Multi-Time Frame trading systems especially with Price Action entries. This Indicator allows you to attach Stochastic from Higher time frame to your current chart --> this is professional trading approach I n

MAXLUM SYSTEM is a Trading System that uses anti-Margin Call without using SL with a positive correlation Hedging Strategy
Simple example of BUY on EURUSD and SELL on GBPUSD at the same time This kind of trading will not occur as a Margin Call By calculating the GAP difference between the 2 pairs we can take advantage of the GAP
This indicator will be more effective if you use Data Analysis download excel file on telegram Group Please join the Maxlum System Telegram group for details t.me/m

This tool helps you to find easily and clearly when you enter trade with day time and price examples Entered Buy at Monday 20:30 with price 2150 Exited buy at Tues 10: 30 with price 2187 You can convert as local time by inputting shift hours and minutes.
Trading is a learning skill, so you have to evaluate your trading performance at the end of your day. Did you follow your rules? If you did then it was a win, regardless if you earned pips or not. If you didn't follow my rules then is a
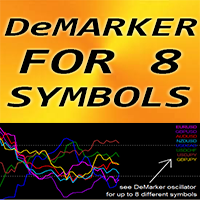
Forex Indicator "DeMarker for 8 Symbols" for MT4, No repaint DeMarker oscillator curve indicates the current price position relative to previous highs and lows during the indicator calculation period DeMarker provides the most efficient regular divergence signals among other oscillators It is great to take Sell entries with regular divergence in OverBought zone (above 0.7) and Buy entries with regular divergence in OverSold zone (below 0.3) "DeMarker for 8 Symbols" gives oppo
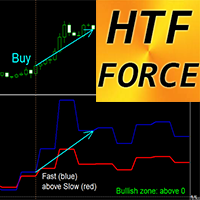
Forex Indicator HTF Force Oscillator for MT4 HTF Force is powerful indicator for Multi-Time Frame trading . HTF means - H igher Time Frame Force index is one of the top indicators that combines price and volume data into a single value Values from High time frame can show you the trend direction (downtrend - below 0; uptrend - above 0) Fast Force - Blue line, Slow Force - Red line Buy signal - Fast line crosses Slow line upward and both - above 0 (see picture) Sell signal - Fast line cr
Ist Ihnen bekannt, warum der MetaTrader Market die beste Plattform für den Verkauf von Handelsstrategien und technischer Indikatoren ist? Der Entwickler braucht sich nicht mit Werbung, Programmschutz und Abrechnung mit Kunden zu beschäftigen. Alles ist bereits erledigt.
Sie verpassen Handelsmöglichkeiten:
- Freie Handelsapplikationen
- Über 8.000 Signale zum Kopieren
- Wirtschaftsnachrichten für die Lage an den Finanzmärkte
Registrierung
Einloggen
Wenn Sie kein Benutzerkonto haben, registrieren Sie sich
Erlauben Sie die Verwendung von Cookies, um sich auf der Website MQL5.com anzumelden.
Bitte aktivieren Sie die notwendige Einstellung in Ihrem Browser, da Sie sich sonst nicht einloggen können.