MetaTrader 4용 기술 지표 - 137

Trading Dashboard is a useful tool for your multiple trades. It contain information such as : - Breakeven point(price) of your multiple trades, - Loss point(price) of your trades, - Current Trading Day and Session, - Current Time and time left of candles, - Total Lot Buy & Sell, and sum of it - Spread and ATR of current time frame and symbol - Profit-Loss in percentage of your open trade

The RPO (Relative Price Oscillator) is a technical analysis indicator used in Forex trading to measure the momentum and trend strength of a currency pair. It is derived from the Relative Strength Index (RSI) but focuses on the difference between two moving averages of price, usually the closing price, over different periods. The RPO is similar to the MACD (Moving Average Convergence Divergence) but uses relative price levels instead of absolute price levels. Key Components: Short-Term Moving Ave

Description of Fibonacci Levels for Support and Resistance (SNR) with a Statistical Model Fibonacci levels are widely used in technical analysis to identify potential support and resistance levels in financial markets. These levels are derived from the Fibonacci sequence, a mathematical sequence where each number is the sum of the two preceding ones. The key Fibonacci retracement levels are 23.6%, 38.2%, 50%, 61.8%, and 100%.

YK-Fibo Pivot Indicator: Trade Smarter with Fibonacci Pivot Points The YK-Fibo Pivot Indicator is a powerful technical analysis tool that combines the precision of Fibonacci retracements with the insights of Pivot Points. Whether you're a novice or seasoned trader, this indicator empowers you to spot profitable opportunities in the market with ease. Why Choose YK-Fibo Pivot? Pinpoint Support & Resistance: By calculating Fibonacci levels based on the previous day's high, low, and close prices, y
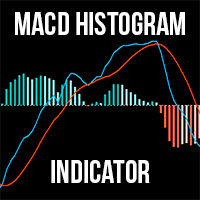
For MT5 The MACD Histogram Indicator is an enhanced version of the traditional MACD indicator, offering superior insights into market trends and momentum shifts. Unlike the default MACD in MT4, this version features a histogram , making it easier for traders to visualize and interpret market conditions. Advantages over the default MACD indicator: Enhanced Visuals: The histogram provides a bar chart representation of the difference between the MACD line and the signal line, making it simpler to i
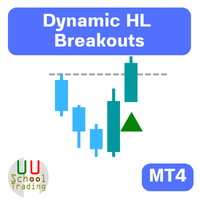
Description of Using the Dynamic HL Breakouts Indicator The Dynamic HL Breakouts indicator is a technical tool designed for trading trend-following assets. Its main purpose is to help traders identify key entry and exit points during strong trending periods of an asset. Components of the Dynamic HL Breakouts Indicator Highs and Lows This indicator calculates and displays the High and Low values for a specified period (e.g., the past 20 days) to create a price movement range for the asset. These
"Trend Finder" is a trend trading strategy that combines market noise filtration and all necessary functions in one tool! The system automatically displays entry and exit points using arrows. Only one parameter is sufficient for configuration. It offers simple, intuitively understandable, and effective trend detection. The intelligent algorithm of the "Trend Finder" indicator identifies potential market reversal points. Often, a good trend can be visually observed on the price chart. However, a

The Your Honor trend indicator is based on price divergence and is designed to analyze and determine market entry points. It can also be used as a filter in trading. The indicator has only two parameters: Period and Level. The Level parameter helps eliminate unnecessary signals. For example, for EURUSD the Level can be set, for example, to 0.0001. Your Honor can be used to both identify entry points and filter signals. The indicator displays information in a clear manner. It is important to reme

Payne Trend는 얇은 색상의 선 형태로 가능한 시장 방향을 제공하는 추세 필터 지표입니다. 이 지표는 거래자가 현재 실제 추세를 기반으로 거래 결정을 내리는 데 도움이 되며, 지표에는 추세 강도와 약점을 나타내는 많은 수준이 있습니다. 다시 칠하거나 다시 칠하지 않아도 신호가 지연되지 않습니다.
==================================================================
매개변수:
기간 : 추세기간 모드 : ma의 계산 모드 가격 : 종가/시가/고가/저가. 경고
===================================================================

SNR LEVEL INDICATOR Accurate Snr level indicator will only display Fresh Levels that are close to the Current Market Price. This indicator is very accurate in mapping Support & resistance levels. there is an alert feature when the price TOUCHES the SNR LEVEL, WHEN CLOSE CANDLE BREAK/REJECT SNR LEVEL.
INDICATOR MARKING :
- SUPPORT LEVEL = V SHAPE - RESISTANCE LEVEL = APEX LEVEL - GAP RESISTANCE & GAP SUPPORT = OPEN CLOSE CANDLE - SUPPORT BECAME RESISTANCE & RESISTANCE BECAME SUPPORT INDICATOR C

Max Payne은 화살표 형태로 신호를 제공하는 반전/추세 신호 지표입니다. 이 지표는 동일한 막대 종가에 신호를 제공하며, 이 지표는 신호의 이중/삼중 확인을 위해 다양한 기간으로 차트에서 여러 번 떨어질 수 있습니다. 표시기는 다시 칠하거나 다시 칠하지 않는 동안 모든 거래 스타일에 맞게 고도로 조정 가능합니다. 사용된 템플릿과 함께 구매 후 스크린샷에 표시된 전체 시스템을 얻을 수 있습니다. ----------------- 거래 방법: 트렌드 필터(구매 후 얻을 수 있는 Payne 트렌드)가 방향에 동의하는 동안 동일한 바에서 세 번의 확인을 받을 때까지 기다리세요. 거래를 개시하고 매수 거래의 경우 황금색 화살표(템플릿) 아래에 정지 손실을 설정하고 매도 거래의 경우 황금색 화살표(템플릿) 위에 설정하면 종료 신호는 반대쪽 첫 번째 흰색 점 신호(템플릿)입니다. ----------------- 매개변수: 신호주기 : 화살표주기 필터: 신호 필터 거리 : 양초로부터의 화살표

"Breakout Buy-Sell" 지표는 다양한 시장 세션(도쿄, 런던, 뉴욕) 동안 가격 돌파를 기반으로 매수 및 매도 기회를 식별하고 강조하도록 설계되었습니다. 이 지표는 트레이더가 매수 및 매도 영역뿐만 아니라 이익 실현(TP) 및 손절매(SL) 수준을 명확하게 시각화하는 데 도움이 됩니다. 사용 전략 이 지표는 다음과 같이 사용할 수 있습니다: 초기 설정 : 시장 세션을 선택하고 GMT 오프셋을 조정합니다. 시장 시각화 : 각 세션 시작 시 그려지는 돌파 상자를 관찰합니다. 이러한 상자는 기간의 최고점과 최저점을 나타냅니다. 매수 및 매도 신호 : 상자의 최고점을 초과하는 돌파는 매수 신호로 간주됩니다. 최저점을 밑도는 돌파는 매도 신호로 간주됩니다. 위험 관리 : TP1, TP2, TP3 및 SL 수준을 사용하여 포지션을 관리합니다. TP 수준은 다양한 수익 목표를 위해 설계되었으며 SL은 불리한 움직임으로부터 보호를 보장합니다. 적용 전략 이 지표를 최대한 활용하기 위해

The Tin indicator is designed to visually display the current trend in the market. One of the key aspects of foreign exchange market analysis is to determine the trend, which is the sustainable direction of price movement. To do this, the Tin indicator uses algorithms that smooth out sharp fluctuations that do not have a significant impact on the overall trend.
A trend can be either upward (bullish) or downward (bearish). Typically, a trend persists for a long time before abruptly changing dir
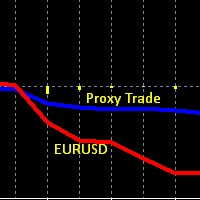
This is an obscure Hedge Fund like strategy, based one of our early indicators on EURUSD originally intended for day trading, while developing and testing the indicator we found out that the data used in this indicator (set of 4 currency pairs) follows EURUSD in a very peculiar way. On one hand these two are correlated, but the 4 currency proxy set tends to lag behind EURUSD, it lags on a day to day basis, and then catches up eventually after several days. And therefore can be used as a proxy

* Pivot Points Magic : Effortlessly Plot Pivot Levels on Any Chart**
Pivot Points Magic simplifies the process of identifying critical pivot levels on any chart, across all timeframes. With just a few clicks, traders can instantly visualize pivot points, enabling them to make more informed trading decisions.
We value your feedback! Share your experience with Pivot Points Magic and help us improve. Your reviews and suggestions are essential for shaping future updates and enhancements to the in

Why the RSI Alert Indicator is Essential for Your Trading Toolkit
In the fast-paced world of trading, timely and accurate information is crucial. The RSI Alert Indicator is a powerful tool designed to help you stay ahead of the market by providing real-time alerts when the Relative Strength Index (RSI) reaches critical levels. Whether you're a novice trader or a seasoned professional, this indicator can significantly enhance your trading strategy by pinpointing potential market reversals with

The KeyLevels Pro indicator is a powerful tool designed to identify significant support and resistance levels based on pivot highs and lows in the price action. This indicator is perfect for traders who rely on market structure and key price levels to make informed trading decisions. It features customizable parameters, automatic detection of pivot points, and visual representation of key levels with optional labels. Features Pivot Detection : Automatically detects pivot highs and lows based on
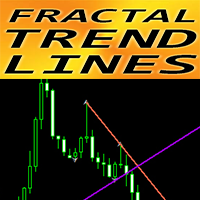
Crypto_Forex 지표 "Fractal Trend Lines" for MT4.
- 이 지표는 브레이크아웃과 함께 그래픽 분석을 사용하는 트레이더에게 매우 좋습니다!!! - "Fractal Trend Lines"는 그래픽 상승 추세선(보라색) 및 하락 추세선(빨간색)을 보여줍니다. - 상승 추세선 및 하락 추세선은 가장 가까운 두 개의 프랙탈에 기반합니다. - 지표에는 추세선 색상과 너비를 담당하는 몇 가지 매개변수가 있습니다. - 지표에는 브레이크아웃에 대한 모바일 및 PC 알림이 내장되어 있습니다.
// 뛰어난 트레이딩 로봇과 지표는 여기에서 확인할 수 있습니다: https://www.mql5.com/en/users/def1380/seller 이 MQL5 웹사이트에서만 제공되는 오리지널 제품입니다.

The “Sharp Scalper” indicator is high-frequency trading tool designed for quick, short term trades in the forex market. It focus on identifying rapid price movement and generating signals for best entry. This indicator is known for its ability to capture small profit opportunities multiple times throughout the day making it ideal for scalpers looking to capitalize on market volatility. The” sharp scalper” indicator employs advance algorithms to detect market trends and fluctuation, helping trade
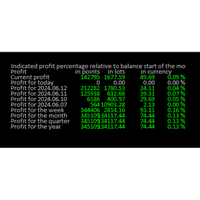
Online Diary: This indicator is designed to help traders keep track of profits and losses over various time periods, such as current profit, today’s profit, yesterday’s profit, and so on, up to the profit for the current year. The indicator offers several configuration options, such as the calculation of profit percentage relative to the balance at the beginning of the day, week, month, quarter, or year. It also allows for the customization of text placement and colors to suit the user’s needs

This is a Halftrend Scalper for MT4. Meant for Swinging markets with good volatility. Not suitable during low volatility. Features:
Wait for Price to cross Halftrend line. Select which HTF halftrend(Main Signal) Check Halftrend alignment between Higher Timeframes Check High Volume Bar (Optional) Halftrend Trends stacked (Optional) What's in the Downloads Package Extras:
- HT Scalper Scanner Dashboard (Keep in same directory as your Arrows indicator - or else won't work)
- Modified MTF Halft

The 10PIPS Dynamite is a semi-automated cutting-edge Forex indicator designed to automatically revolutionize your trading skills from a being a losing trader to becoming a profitable trader simply by Scalping 10 pips per Trade setup generated by the software. 10PIPS Dynamite Indicator once attached on the main chart it starts an in-depth market analysis based on its unique in-built advanced algorithm which seamlessly combines powerful indicators, statistical analysis, and trend recognition

The SuperTrend MTF indicator is an excellent trend tracking indicator . It can not only display SuperTrend trends within the timeframe of the chart, but also set up to display SuperTrend trends for larger time frames simultaneously . This will be beneficial for grasping trends at a larger time scale and predicting future trends . At the same time, the price of the trend line can also be displayed at a glance, making it easy to observe. Input parameters : ATR period used at chart timeframe

TMA Channel is a price channel obtained through a special calculation method based on traditional TMA . The channel has upper, middle, and lower tracks . When the price approaches or exceeds the upper track, it is already in an overbought state, and attention should be paid to the situation of reversal and decline; When the price approaches or falls below the lower track, it is already in an oversold state, and attention should be paid to the situation of reversal and rise . The indicator will d

The author's indicator is based on automatically adjusted horizontal and inclined lines from significant market points. In the settings you can specify the period, color and thickness of the lines, disable or enable slanted lines and several other graphic settings.
Recommended rules for entering the market:
Using SELL as an example:
I place a pending order for a breakout - sell stop below the horizontal line of the indicator, then I monitor the work-out, stop loss and take profit are determi

The AT Forex Indicator MT4 is a sophisticated trading tool designed to provide traders with a comprehensive analysis of multiple currency pairs. This powerful indicator simplifies the complex nature of the forex market, making it accessible for both novice and experienced traders. AT Forex Indicator uses advanced algorithms to detect trends, patterns and is an essential tool for traders aiming to enhance their forex trading performance. With its robust features, ease of use, and reliabl

The Onion Trend Indicator is a revolutionary trend trading and market data filtering solution that combines all the important features of a trend tool in one tool! It is great for any trader, be it Forex or binary options. No settings are required, everything is optimized by time and experience, it works effectively both in flat conditions and in trend conditions.
The Onion Trend Indicator is a technical analysis tool for financial markets that reflects current deviations in the price of s

Using the Likdon Forex indicator algorithm, you can quickly determine the current trend in the market. The Elephant indicator tracks long trends and can be used without restrictions on instruments or timeframes. With its help, you can try to predict future price values, but its main purpose is to generate buy and sell signals.
The indicator tracks the market trend, ignoring sharp fluctuations and market noise around the average price. It implements a technical analysis method based on the assu
The LewshaGen indicator is a technical analysis tool used in the Forex market. It helps traders make decisions when to enter or exit a trade based on analysis of market data. Let's look at how it works and why it can be useful.
How the LewshaGen indicator works: Trend Analysis: The indicator analyzes chart data and identifies key turning points and trends in the market. In the chart above, you can see how the indicator helps identify a decline of 180 points (PIP) and a subsequent rise of 330 p

Indicator for manual trading and technical analysis for Forex.
It consists of a trend indicator with the opening level of the trading day and a arrow indicator for determining entry points.
The indicator does not recolor; it works when the candle closes.
Contains several types of alerts for signal arrows.
Can be configured to work on any chart, trading instrument or time frame.
The work strategy is based on searching for price movements along the trend.
To make " Buy " transactions: The tre

The Dreadnought indicator carefully analyzes price dynamics, identifying temporary weakening of the trend and sharp changes in its direction. By monitoring this indicator, you can easily notice changes in the market and take appropriate action. Entering the market may be easy, but maintaining a position is much more difficult. With Dreadnought, you have reliable support to successfully stay ahead of the trend. This indicator analyzes historical data and provides the trader with the necessary in

Mysterium is a channel indicator without redraws, which is based on double smoothing of moving averages. Unlike channel indicators such as Bollinger, Mysterium uses double smoothed moving averages. This allows you to more accurately determine the direction of market movement, although it reduces the sensitivity of the indicator. However, double smoothing provides a clearer and more stable display of channels on the chart, which helps traders make informed trading decisions.
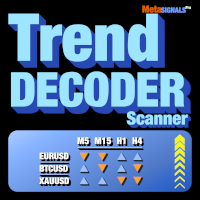
여러 자산 및 여러 시간 단위에 대한 TrendDECODER 신호 받기 | 입력하기에 가장 좋은 시간 단위 결정 | 수익 및 거래 승리 극대화 재도색되지 않는, 지연되지 않는 지표 및 스크리너 - 수동 및 자동 거래에 이상적 - 모든 자산 및 모든 시간 단위에 적합 49달러 첫 50부 - 그 이후에는 99달러 구매 후, 댓글을 남기거나 리뷰를 남겨주세요 . 그러면 99달러 상당의 추가 지표를 보내드립니다. MT5 버전: 여기를 클릭하세요
무엇에 관한 것인가요? 이 스크리너는 가장 높은 평가를 받은 TrendDECODER 의 보조 도구입니다. 이를 통해: 거래를 위한 모든 관련 시간 프레임에서 즐겨찾는 자산의 현재 TrendUP 및 TrendDOWN 신호를 받음 수익성 있는 추세 추종 또는 스윙 트레이드를 위한 가장 유리한 시간 프레임 구성을 즉시 확인
가장 유리한 시간 프레임 구성은 무엇인가요? 먼저, 하위 / 메인 / 상위 시간 단위로 멀티 타임 프레임 차트를 설정하세요

Volatility Range is an indicator that calculates the range of volatility, predicting key levels such as potential resistance above and potential support below. The indicator can display volatility forecast ranges for the latest 50 days, 10 weeks, or 4 months. By observing these ranges, you can better identify reliable levels where combining with price action enhances trade accuracy significantly.
You have the option to fill the rectangle area with color for easier observation, or leave it unfi

Price Action Scanner is an indicator that identifies price behaviors and provides alerts. This indicator can simultaneously detect signals for up to 6 different symbols across various timeframes. By setting a separator, you can add different symbol names and timeframes.
The indicator can detect multiple common signal types such as Pinbar, Engulfing Pattern, Inside Bar, Morning Star, Evening Star, Fakey, and display corresponding information in separate subcharts, indicating the direction of th

Price Action Scanner Pro is an indicator that identifies price behaviors and provides alerts, offering more features and customization compared to Price Action Scanner ( https://www.mql5.com/zh/market/product/118937?source=Site+Profile+Seller ) . This indicator can simultaneously detect signals for up to 15 symbols across different timeframes. You can configure it to detect signals during specific trading sessions such as Asian, European, and US sessions, using different timeframes. This

The Radiant Trend indicator calculates the saturation levels of the price chart. A signal to exit the oversold zone indicates a buy, and a signal to exit the overbought zone indicates a sell. For this indicator, it is usually necessary to set relative values for the overbought and oversold levels – Bottom and Top.
Often a good trend can be seen visually on the price chart. However, an experienced trader must clearly understand the current market situation before opening a position. The indic
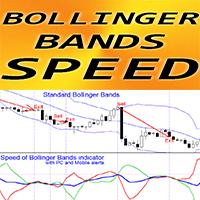
Crypto_Forex 지표 "볼린저 밴드 속도" MT4용, 리페인트 없음.
볼린저 밴드 속도 - 고유한 트렌드 지표입니다.
- 이 지표의 계산은 물리학 방정식을 기반으로 합니다. - 속도는 표준 볼린저 밴드의 1차 미분입니다. - 볼린저 밴드 속도 지표는 BB 중간선과 BB 경계가 방향을 얼마나 빨리 바꾸는지 보여줍니다. - 기본적으로: 파란색 선은 BB 중간선의 속도, 빨간색 선은 하단 경계의 속도, 초록색 선은 상단 경계의 속도입니다. - BB 속도를 트렌드 전략에 사용하는 것이 좋습니다. BB 중간선 속도 값이 < 0이면 트렌드가 하락하고 값이 > 0이면 트렌드가 상승합니다. - 다음 거래 항목을 고려할 수 있습니다.
- 파란색 선이 0보다 크고 녹색 선이 파란색 선을 위로 교차하면 매수 거래를 시작합니다. - 파란색 선이 0보다 작고 빨간색 선이 파란색 선을 아래로 교차하면 매도 거래를 시작합니다. - 지표에는 모바일 및 PC 알림이 내장되어 있습니다.
// 뛰어난
Working with the Channel Motion Tracker indicator is as simple as possible. Just react to the arrows that the indicator displays. Each arrow represents an explicit command to action. The signals generated by this indicator are accurate enough to allow you to trade based on this information.
One of the main advantages of the indicator is its ability to build high-quality channels and generate signals for entering the market. This is great for the trader who always finds it difficult to choose b

The Geliosx indicator is designed to visually display the trend. One of the key tasks when monitoring the currency market is to determine the trend - a stable direction of price movement. Geliosx uses special calculations to smooth out sharp fluctuations that do not have a significant impact on the overall picture of the price movement.
This indicator is created for those who value their time and money.
The trend can be ascending (bull trend) or descending (bear trend). Typically, the trend g

Support and Resistance Levels is an intelligent indicator that displays horizontal support and resistance levels, suitable for traders of different trading frequencies. You can select your preferred trading frequency, and the indicator will automatically calculate the support and resistance levels relevant to that frequency. Among these, the Bull-Bear Line is an interval used to distinguish the strength of bullish and bearish forces, and is an important level.
You can combine it with other ind

Product Description: Precision Pattern Indicator for Consistent Profits Elevate your trading with the Precision Pattern Indicator, an advanced tool designed to spot a highly profitable and specific trading pattern. This indicator is your key to unlocking consistent profits with minimal effort. Key Features: Accurate Entry Signals: Receive clear entry signals with green arrows for buy opportunities and red arrows for sell opportunities, ensuring you never miss a profitable trade. Defined Risk Man

The Arriator forex indicator algorithm allows you to quickly determine the current trend in the market. The Elephant indicator accompanies long-term trends and can be used without restrictions on instruments or timeframes. This indicator not only helps predict future values, but also generates buy and sell signals. It tracks market trends, ignoring wild swings and market noise around the average price. The indicator implements a type of technical analysis based on the idea of market cyclicalit

REMINDER: Early buyers hot price discount: Price subject to rise after first 20 copies. Starting price $65 and final price will be $1275. Secure your discounted copy Now!
Smart Money Analyser Indicator User Manual
1. Introduction Welcome to the Smart Money Analyser Indicator This powerful tool provides traders with comprehensive market analysis by combining various technical indicators to generate actionable trading signals. Designed to be user-friendly, this indicator helps traders of all

The Sirius X indicator reliably tracks market trends, ignoring wild swings and market noise. Suitable for trading on any timeframe, effectively filtering sudden price spikes and corrections by reducing market noise around the average price. For calculations, the indicator uses iLow, iHigh, iMA and iATR. The output based on these reliable indicators is also reliable. You can set up a sound signal and notifications, for example by email. The indicator does not redraw and works stably.
Configurab
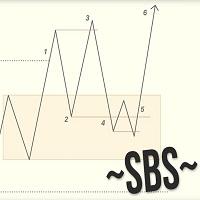
Swing Breakout Sequence | SBS presents a comprehensive trading strategy designed to help traders identify and capitalize on market swings and breakouts. The Swing Breakout Sequence (SBS) strategy is built around a series of well-defined steps to optimize trading decisions and improve profitability. Version 2.01: Add "golden entry" - entry by fib. Stoic added to it (fibo) he calls this setup gold SBS here is the video the description of the setup starts at 18min24sec Version 2: + Add BOS filter

Gann Retracements Octaves Indicator Enhance your trading strategy with the Gann Retracements Octaves indicator, meticulously designed to integrate Gann's theories with modern technical analysis. This custom indicator provides you with precise retracement levels based on Gann's octaves, helping you identify key support and resistance levels, as well as potential reversal points in the market. Key Features: 24 Indicator Buffers : Tracks multiple retracement levels (-7/8 to 15/8) with distinct colo
FX Strength Meter Pro 는 외환 시장에서 최적의 거래 기회를 찾고자하는 트레이더들을 위해 설계된 강력한 지표입니다. 우리의 지표는 실시간으로 주요 통화 쌍 (USD, EUR, GBP, CHF, AUD, NZD, JPY, CAD)의 상대적 강도를 표시하여 거래 전략을 최적화하는 데 도움을 줍니다.
주요 특징은 다음과 같습니다:
- 다중 시간대 지원: 분 차트부터 월 차트까지 (M1, M5, M15, M30, H1, H4, D1, W1, MN1), 사용자는 표시할 시간대를 선택할 수 있으며, 왼쪽에 강한 통화가 오른쪽으로 갈수록 약해집니다. - 실시간 업데이트: 초당 업데이트를 통해 사용자는 항상 최신의 통화 강도 데이터를 얻을 수 있습니다. - 명확한 시각화: 강도 관계는 강한 것부터 약한 것까지 명확하게 표시되어 신속한 거래 결정을 지원합니다. - 사용자 정의 가능한 표시: 텍스트 색상, 글꼴 크기 및 줄 간격을 개인의 취향과 필요에 맞게 조정할 수 있습니다.
MTFMA(멀티 타임프레임 이동 평균선) 지표는 여러 시간대의 여러 이동 평균선(MA)을 사용하여 주 차트와 별도의 창에서 매수 및 매도 신호(재도색하지 않음)를 제공합니다. 이 지표는 다용도이며 해석하기 쉬워 작은 시간대의 스캘핑과 큰 시간대의 장기 거래 모두에 적합합니다. 왜 멀티프레임인가요? 멀티프레임이라는 용어는 지표가 여러 시간대의 데이터를 사용하고 결합할 수 있는 능력을 나타냅니다. MTFMA는 네 개의 구성 가능한 이동 평균선(MA)에 기반하여 신호를 계산하고 표시합니다. 각 MA는 다른 기간, 계산 방법 및 가격 유형에 맞게 조정할 수 있어 트레이더가 하나의 차트에서 단기 및 장기 트렌드의 조합을 볼 수 있도록 합니다. 중요 포인트: 다용도성: 분 단위부터 월 단위까지 모든 시간대에 사용 가능하며, 스캘핑과 장기 거래 모두에 적합합니다. 재도색하지 않음: 한 번 신호(위쪽 또는 아래쪽 화살표)가 생성되면 색상이 변하지 않아 트레이더가 생성된 신호를 신뢰하고 거래 결정을
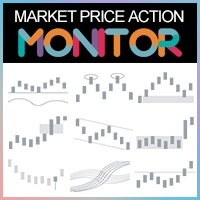
Why do I need to use the Market PA Monitor:
1.It is impossible to monitor multiple varieties and multiple TF of the market.
The market situation is constantly changing, with numerous varieties, and each variety has different timeframe from small to large. Each TF contains different market changes and trend alternations. Under numerous varieties and multiple TFs, there are countless trading opportunities every day. However, an ordinary trader cannot detect the trading opportunities of each var

Subscribe to the MA7 Trading channel to receive notifications about new programs, updates and other information. Ask questions in the profile on the MQL5 .
Description of work The MA7 Moss indicator is based on the standard Accelerator Oscillator (AC) indicator. Shows overbought and oversold zones. Detailed information about the MA7 Moss indicator.
Indicator settings General settings: Upper level ; Lower level .
Message settings: Send message to the terminal (Alert) – permission to send mess

Golden Range 2 is one of the top entry indicators securing its future with its results. Indicator settings: Points = how precise pattern detection is AlertConfirmation = turn on(true) off(false) alert CalculatedBars = how many bars will be calculated
Please leave Positive comments, reviews. Buffer 0 Buy Arrow, Buffer 1 Sell Arrow, Buffer2 Buy Signal(Value:1/0), Buffer3 Sell Signal(Value:1/0) Buy Green, Sell Red
Powerful Order Block indicator in Tradingview platform. Indicator type: Price Action indicator Introduction: The Order Block Indicator - Elevating Your Price Action Analysis. If you're seeking a comprehensive Order Block indicator on the MQL5 platform, look no further.
Firstly, according to this indicator, an OB is understood as a zone of pending orders from large institutions that haven't been fully executed, revealing themselves in the market through subtle signs. Prices react strongly whe

NextCandlePredictor 지표 NextCandlePredictor는 다시 그리지 않으며, 색상이 변경되지 않고, 이동하지 않으며, 사라지지 않으며, 지연이 없는 알림이 있는 신호 지표입니다. 모든 타임프레임에서 다음 또는 다가오는 캔들의 방향을 식별하는 데 도움이 됩니다. 뉴욕, 런던 또는 둘 다 겹치는 고변동성 시장에 매우 권장됩니다. 주요 기능: 타임프레임의 유연성: M1에서 H1 이상까지 모든 타임프레임에서 빠르고 정확한 신호를 제공합니다. 명확한 매수/매도 신호: ADX의 DI+ 및 DI- 라인을 사용하여 명확한 매수 및 매도 신호를 생성하여 최고의 거래 결정을 내릴 수 있도록 합니다. 직관적인 시각화: 신호는 차트에 직접 녹색(매수) 및 빨간색(매도) 화살표로 표시되어 빠르고 쉽게 읽을 수 있습니다. 사용자 정의 가능한 설정: 분석할 막대 수와 경고 옵션을 선호도 및 거래 전략에 따라 조정합니다. 사용하려는 TF에 따른 제안표를 아래에서 확인하세요. 캔들 종료 시
The Delphinus indicator
Welcome to my page!
Experience the Delphinus Indicator. It is an oscillator and impulse type indicator. It works on all time frames and all pairs, with rigor differences.
This indicator does not repaint.
I would indicate to be used especially on time frames D1, H4, H1, M30.
I personally use it on the H4 timeframe. Thank you
Good luck in trading!

Gann Angles Indicator The Gann Angles Indicator is a powerful technical tool based on the theory of William Delbert Gann. It helps traders identify potential support and resistance levels, as well as trend direction across various time intervals. Key features: Automatic determination of extremum within a specified time range Construction of 9 Gann Fan lines with angles of 82.5, 75, 71.25, 63.75, 45, 26.25, 18.75, 15, and 7.5 Flexible line color customization Adaptation to both upward an

Get rid of trading confusion and embrace stable income! Are you still worried about finding a low-risk and stable profit method? Are you still anxious about judging the market direction and controlling the risk of placing orders? The new cross-platform arbitrage indicator helps you easily achieve stable returns! Accurately capture arbitrage opportunities without you having to worry! The cross-platform arbitrage indicator is a powerful tool that can monitor the price differences of the same finan

"MultiSymbol & TF Chart Integrated" 지표는 단일 차트(다중 모드)에서 최대 60개의 통화 쌍을 선호하는 시간대에 따라 모니터링하거나 모든 TF에서 거래 중인 통화 쌍을 볼 수 있도록 빠르게 포괄적인 시장 전망을 제공하도록 설계되었습니다(단순 모드). 주요 장점: 완전 모니터링: 단일 차트에서 모든 원하는 쌍을 한 눈에 실시간으로 모니터링할 수 있습니다.
시간 절약: 차트 간 전환 필요 없이 각 쌍의 행동을 실시간으로 확인할 수 있습니다.
추세 분석: 추세를 따르는 트레이더에게 적합하며, 결정하기 전에 추세를 확인하기 위해 상위 시간대를 볼 수 있습니다.
극한 사용자 정의: 지표의 모든 측면을 특정 요구에 맞게 조정합니다. 극한 사용자 정의: 높은 구성 가능성 지표 매개변수:
심볼 및 시간대: 최대 60개의 다른 심볼을 구성할 수 있습니다. 각 심볼은 고유한 시간대를 가질 수 있습니다(예: M1, M5, M15, M30, H1, H4, D1, W1, MN

Fibonacci Wave Bands Indicator The Fibonacci Wave Bands indicator utilizes Fibonacci ratios to create dynamic bands around a central moving average. These bands are derived from key Fibonacci ratios (typically 38.2%, 50%, 61.8%) and adapt to market volatility, offering insights into potential support and resistance zones. Key Features: Fibonacci Levels: The indicator plots multiple bands above and below a central moving average based on Fibonacci ratios. Dynamic Support and Resistance: Bands ser
여러 차트를 전환하며 다양한 통화 쌍과 시간 프레임을 모니터링하는 것에 지치셨나요? Pairs and TF Changer 지표가 거래 경험을 혁신합니다! 모든 전략 지표를 로드한 후 Pairs and TF Changer 를 차트에 추가하십시오. 필요에 따라 위치, 색상 또는 표시할 열 수를 조정할 수 있습니다! 주요 기능: 원활한 통합: 이 지표를 거래 전략에 쉽게 통합하십시오. 클릭 한 번으로 단일 차트에서 모든 통화 쌍과 시간 프레임을 거래하십시오. 추가 차트를 전환하거나 열 필요가 없습니다. 높은 맞춤화 가능: 차트의 어느 위치에든 위치를 조정하십시오 (위, 아래, 왼쪽, 오른쪽). 1열 또는 10열의 버튼을 표시하도록 설정하십시오. 거래 테마에 맞게 색상을 맞춤화하십시오. 차트를 깔끔하고 정돈되게 유지하기 위해 버튼을 투명하게 만드십시오. 보편적 호환성: 모든 유형의 지표 및 전략과 호환됩니다. Forex, 금속, 미국 주식, 지수, 석유, 선물 및 암호화폐를 포함한 모든 심

Misio - can be used as an independent trading system. The indicator determines the market trend, ignoring sharp fluctuations and noise around the average price. It displays the trending movement with potential stop points.
Simple, clear and effective use. The indicator does not redraw and does not lag. Suitable for all currency pairs and all timeframes.
Interpretation:
The location of the rate above or below the shadows indicates the presence of a trend. A move into the shadows signals a pos

Determining the current trend is one of the most important tasks of a trader, regardless of the trading style. The Gravity Trend indicator will help you do this with a fairly high probability.
Gravity Trend is a trend recognition indicator that uses the author's calculation algorithm. The indicator readings do not change under any conditions. The indicator is suitable for any currency pair, any timeframe.
Indicator Parameters Main Settings: HistoryBars - the number of bars to display. FirstPe
The Reversal Candlestick Structure indicator detects multiple candlestick patterns occurring when trends are most likely to experience a reversal in real-time. The reversal detection method includes various settings allowing users to adjust the reversal detection algorithm more precisely.
A dashboard showing the percentage of patterns detected as reversals is also included. USAGE Figure 1 Candlestick patterns are ubiquitous to technical analysts, allowing them to detect trend continuation

To get access to MT5 version please click here . This is the exact conversion from TradingView: " WaveTrend" by LazyBear.
This is a light-load processing and non-repaint indicator. All input options are available. Buffers are available for processing in EAs. You can message in private chat for further changes you need. The filling area option is omitted to fit into MT4 graphics.

MetaTrader 4 (MT4)용 캔들스틱 패턴 지표 이 맞춤형 지표는 주요 상승 및 하락 캔들스틱 패턴을 식별하여 트레이더가 기술 분석과 의사 결정을 내릴 수 있도록 돕습니다. 주요 기능: 패턴 감지 : 상승 : 망치형, 상승 장악형, 샛별형, 세 개의 흰 병사, 상승 하라미, 역망치형. 하락 : 유성형, 하락 장악형, 석별형, 세 개의 검은 까마귀, 하락 하라미, 교수형. 맞춤 설정 : 전략에 따라 특정 패턴을 활성화 또는 비활성화할 수 있습니다. 화살표로 패턴을 표시하며(상승은 파란색, 하락은 빨간색), 크기와 간격을 조정할 수 있습니다. 이동 평균선(MA) 통합 : 선택적으로 이동 평균선을 차트에 표시할 수 있으며, 기간, 방법, 시간 프레임을 맞춤 설정할 수 있습니다. 알림 시스템 : 감지된 패턴에 대해 화면 메시지, 소리, 푸시 알림, 이메일 알림을 제공합니다. 다중 패턴 감지: 수렴 : 하나의 캔들에 여러 패턴을 표시하여 더 강한 신호를 제공합니다. 상승 수렴 : 여러

GoTrend Multi-Timeframe 지표 "GoTrend Multi-Timeframe" 지표는 여러 시간 프레임에서 통화쌍의 전체 및 특정 추세를 빠르고 효율적으로 평가하려는 트레이더에게 필수적인 도구입니다. 이 지표는 트레이더가 시장 방향에 대한 명확하고 포괄적인 시각을 한눈에 얻을 수 있도록 하여 의사 결정을 최적화하고 거래 전략의 효과를 높일 수 있습니다. 주요 특징: 다중 시간 프레임 분석: 이 지표는 M5, M15, M30, H1, H4 및 D1의 여섯 가지 다른 시간 프레임에 대한 포괄적인 분석을 제공하여 트레이더가 각 기간의 추세를 이해할 수 있도록 합니다. 통합 기술 지표: 이 지표는 RSI, SAR, MA, MACD 및 ADX의 다섯 가지 강력한 기술 지표를 사용하여 각 시간 프레임에서 추세 방향을 결정합니다. 명확하고 직관적인 시각화: 신호는 직관적인 기호와 색상으로 메인 차트의 원하는 코너에 표시됩니다. 이를 통해 트레이더는 시장 상황을 한눈에 평가할 수

Trend oscillator indicator for tracking microtrends and pullbacks. Determines even a minor change in trend . Allows you to open positions in a timely manner in accordance with market changes. Works on all timeframes, all currency pairs, metals, indices and cryptocurrencies. Can be used when working with binary options. Distinctive features Does not redraw after the candle closes; Accurately detects trend changes; Simple and clear setup; Works on all timeframes and all trading instruments; Suit
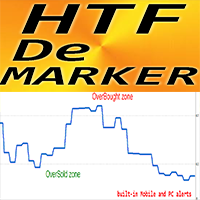
Crypto_Forex 지표 HTF DeMarker for MT4.
- 이 지표는 기술 거래자가 진입 및 종료 지점을 찾는 데 사용하는 유용한 도구입니다. HTF는 - Higher Time Frame을 의미합니다. - DeMarker 오실레이터 라인은 이전 최고가와 최저가에 대한 현재 가격 위치를 나타냅니다. - DeMarker는 다른 오실레이터 중에서 가장 효율적인 정기적 발산 신호를 제공합니다. - 매수 과다 영역은 DeMarker가 0.7 이상일 때이고 매도 과다 영역은 DeMarker가 0.3 미만일 때입니다. - 지표에는 모바일 및 PC 알림이 내장되어 있습니다. - 이 지표는 가격 액션 항목이 있는 다중 시간 프레임 거래 시스템 또는 다른 지표와 함께 사용하기에 매우 좋습니다. - HTF DeMarker 지표를 사용하면 더 높은 시간 프레임의 DeMarker를 현재 차트에 첨부할 수 있습니다 --> 이는 전문적인 거래 방식입니다.
// 뛰어난 트레이딩 로봇과 지표는
MetaTrader 플랫폼 어플리케이션 스토어에서 MetaTrader 마켓에서 트레이딩 로봇을 구매하는 방법에 대해 알아 보십시오.
MQL5.community 결제 시스템은 페이팔, 은행 카드 및 인기 결제 시스템을 통한 거래를 지원합니다. 더 나은 고객 경험을 위해 구입하시기 전에 거래 로봇을 테스트하시는 것을 권장합니다.
트레이딩 기회를 놓치고 있어요:
- 무료 트레이딩 앱
- 복사용 8,000 이상의 시그널
- 금융 시장 개척을 위한 경제 뉴스
등록
로그인
계정이 없으시면, 가입하십시오
MQL5.com 웹사이트에 로그인을 하기 위해 쿠키를 허용하십시오.
브라우저에서 필요한 설정을 활성화하시지 않으면, 로그인할 수 없습니다.

