MetaTrader 4용 기술 지표 - 132
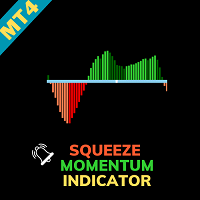
Squeeze Momentum Indicator - Unleash the Power of Market Momentum Welcome to the world of precision trading with the "Squeeze Momentum Indicator" for MetaTrader 4. This advanced tool is designed to help you harness the power of market momentum, providing you with actionable insights to make well-informed trading decisions. Basic Details : Indicator Type : Squeeze Momentum Indicator Key Metrics : Real-time analysis of market momentum. Customization : Fully customizable settings to align with your

Всем Добрый День. Вас беспокоит всех снова, я Вадим Сергеевич Лепехо. Предлагаю свой продукт на обозрение, просмотр, оценку его. Продукт(индикатор) прост в понимании сигнала(алерта), алготрейдинга. Индикатор рисует над свечами кружки, точки красного и зеленого цвета. Нужно дождаться появления череды точек одного цвета(цвет череды красный), а потом должен появиться зеленого цвета кружок, точка и обязательно сформироваться потом точка другого цвета, т.е. красного. Выставляем сетку ордеров вверх и
Всем добрый. Это снова, я, Вадим Сергеевич Лепехо. Предлагаю приобрести и протестировать кота в мешке, мяууууууу )))). Очень просится вы заметили. Данный индикатор рисует знаки на графике. Цена пробивает их и в принципе ожидаем возврата цены обратно. Индикатор работает, отталкивается от дивергенции на рынке форекс. Хотя, если вы опытные трейдер, юзеры. Рынка(форекс), как такого и нет. Это не суть Главное получать профит постоянно. Спасибо за внимание До свидания.

Description: Unlock the power of numerology in your trading with our unique Numerology Indicator. This indicator is meticulously designed to provide traders with insights based on numerology principles and 0.7 values, offering a fresh perspective on market analysis. How It Works: Our Numerology Indicator leverages the ancient wisdom of numerology, which assigns numerical significance to various aspects of life. In the context of trading, we've harnessed the mystical power of 0.7 values, aligning

Attractive Numero - Numerology Levels Indicator Description: Discover the fascinating world of numerology in trading with our "Attractive Numero" indicator. This innovative tool allows you to seamlessly integrate numerology principles into your technical analysis, helping you identify critical supply and demand levels that can significantly enhance your trading strategy. How It Works: "Attractive Numero" is designed to harness the power of numerology to pinpoint supply and demand levels. You hav

Cycle Engineering Indicator - Automatic Level Drawing Description: Step into the realm of advanced technical analysis with our "Cycle Engineering Indicator." This cutting-edge tool seamlessly combines the power of cycle engineering theory and numerical principles to automatically generate key trading levels, offering a deeper understanding of market cycles and dynamics. How It Works: The "Cycle Engineering Indicator" is based on a sophisticated theory of market cycles, which takes into account n

Daily Reverse - Day Number-Based Reversal Predictor Description: Experience a revolutionary approach to price reversal prediction with our "Daily Reverse" indicator. This innovative tool leverages day numbers to forecast potential market reversals by drawing vertical lines on the hourly timeframe, giving you valuable insights into intraday trading opportunities. How It Works: "Daily Reverse" harnesses the power of day numbers to predict price reversals. By calculating day-specific patterns, this
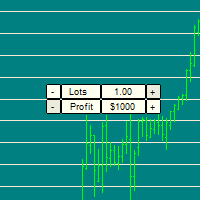
Easily manage your risk and position sizing! It can be tricky to size your trade in the moment, due to different currency / commodity values. For example, placing a 1 Lot position on XAUUSD can easily blow an account that could handle 1 lot on GBPUSD. See screenshots to see how Gold can move $500 on 1 lot much faster than GBPUSD.
THe indicator draws horizontal lines that allow you to easily compare the potential risk/reward across timeframes and symbols. ---- Inputs are: Risk Size: The Loss/Pr

The GGP Squeeze Momentum MT4 Indicator is a volatility and momentum tool designed to help traders optimize their trading performance and providing traders with actionable insights to make well-informed trading decisions. This indicator is MT4 conversion of the Squeeze Momentum Indicator by “LazyBear “ in Trading View website and some alert methods are added to provide real-time alerts when a trading signal is generated, in order to allow traders to act quickly and efficiently. For MT5 version p
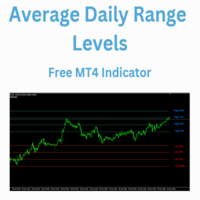
The Average Daily Range Levels indicator shows the ADR levels on the chart as if they were supports and resistances and is updated daily.
By default the indicator uses the 5-day average of the daily range. There are several strategies that suggest that these levels can be used to determine where the price can bounce and it is often said that the price can typically move 75% of the ADR.
In future versions I may add alerts at each level
Can you suggest any changes?
Greetings!

This script automatically calculates and updates ICT's daily IPDA look back time intervals and their respective discount / equilibrium / premium, so you don't have to :) IPDA stands for Interbank Price Delivery Algorithm. Said algorithm appears to be referencing the past 20, 40, and 60 days intervals as points of reference to define ranges and related PD arrays. Intraday traders can find most value in the 20 Day Look Back box, by observing imbalances and points of interest. Longer term traders c

Support and Resistance Barry Indicator - Your Path to Precision Trading Explore the world of precision trading with the "Support and Resistance Barry Indicator" for MetaTrader 4. This robust tool is designed to help you identify key support and resistance levels with exceptional accuracy, enhancing your ability to make well-informed trading decisions. Basic Details : Indicator Type : Support and Resistance Barry Indicator Key Metrics : Real-time identification of crucial support and resistance l
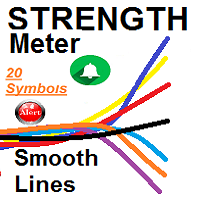
SMOOTH STRENGTH METER INDICATOR (SMOOTH LINE) it draws Currencies TREND Volatility Power / Strength lines : - Detects the 2 highly TRENDED Volatile pairs ( will be the Bold Lines ) - A very Helpful Indicator - It draws smooth lines for up to 20 currencies pairs representing Volatility strength and power - First it indicates the most powerful trended direction pairs : Strongest / Weaker - MAIN FUNCTION :it gives indication of the UP trend most Volatile Line and the

신호 거래 지표 바다 촛불은 위치를 열 신호를 생성,씨 캔들 오실레이터를 사용하여 가격 움직임의 방향을 결정한다. 상품 채널 지수[중앙 거래소]—이동 평균에서 가격의 편차를 측정합니다. 가격이 새로운 최고치에 도달하고 중앙은행이 이전 최고치를 초과할 수 없을 때 차이가 나타납니다. 이 고전적인 차이에는 일반적으로 가격 수정이 따릅니다. 일반적으로 100 이내입니다. 100 위/아래의 값은 과매 수/과매도 상태 및 시정 증가 확률에 대해 알려줍니다.
표시기에 대한 정보 이 표시기는 촛대 형태로 표시되며,이는 시장 상태에 따라 4 가지 색상으로 칠해집니다.
또한 편의를 위해 표시기에 존재하는 모든 색상이 주 메뉴에서 만들어집니다.
표시기는 터미널,전화,메일에 알림을 제공합니다. 색상 변화에 따라 트리거되는.
표시기 사용 방법 표시의 색상에 따라,우리는 구매 또는 판매. 모든 경우에 대해 알림이 제공됩니다.
당신은 색상과 그들이 스크린 샷에서 무엇을 의미하는지

The GGP Wave Trend Oscillator MT4 Indicator is a volatility and momentum tool designed to help traders optimize their trading performance and providing traders find the most accurate market reversals. This indicator is MT4 conversion of the Indicator: WaveTrend Oscillator [WT] by “ LazyBear “ in Trading View website and some alert methods are added to provide real-time alerts when a trading signal is generated, in order to allow traders to act quickly and efficiently. When the oscillator is ab

고급 암표상 외환 지표는 스캘핑 거래뿐만 아니라 과매도 및 과매 수 수준을 기반으로 한 공식입니다. 이 표시기는 모든 통화 쌍에서 작동합니다,
암호화폐,주식,지수. 귀하의 요구에 맞게 사용자 정의 할 수있는 보편적 인 지표는 어떤 거래 전략에서도 결코 불필요하지 않을 것입니다.
표시기에 대한 정보 고급 암표상 외환 표시기는 눈을 다치게하지 않는 색상 히스토그램의 형태로 제공되며 인식하기 즐겁습니다.
시장 상황에 따라 어떤 변화가 있고 시장이 어떤 상황에 처해 있는지 항상 이해할 수 있습니다.
고급 암표상 화살표 외환 표시기는 고급 매개 변수를 가지고 있으며 신호를 다시 그리지 않습니다.
나는 추세 지표와 함께 사용하고 현재 추세의 방향으로 독점적으로 거래를 여는 것이 좋습니다.
지표를 구입 한 후,저에게 연락이 표시와 함께 작동 할 수있는 좋은 추세 지표를 얻을 수 있어야합니다!
표시기 사용 방법 고급 암표상 표시기는 네 가지 유형의 신호를 제공

Std Channels The Std Channels Indicator is a technical indicator that uses standard deviation to create five channels around a price chart. The channels are used to identify support and resistance levels, as well as trends and reversals. The indicator is calculated by first calculating the standard deviation of the price data over a specified period of time. The channels are then created by adding and subtracting the standard deviation from the price data. The five channels are as follows: Upper

The Forex Smart System is a user-friendly and intuitive trading solution designed to empower traders in the complex world of forex trading. With a focus on simplicity and practicality, this system offers a streamlined approach that makes it accessible to traders of all experience levels. User-Friendly Interface: The Forex Smart system is designed with simplicity in mind, making it accessible to traders of all experience levels. Its intuitive interface ensures that users can focus on trading rath
Support Resistance Tracking Indicator The Support Resistance Tracking Indicator is a technical analysis tool that helps traders identify and track support and resistance levels. It is a valuable tool for traders of all levels, from beginners to experienced professionals. How it works The Support Resistance Tracking Indicator uses a variety of methods to identify support and resistance levels. These methods include: Historical price action: The indicator looks for price levels where the market

Auto Channel Trend The Auto Channel Trend Indicator is a technical analysis tool that automatically draws trend channels on any chart. It uses a simple algorithm to identify the trend direction and then draws two parallel lines that represent the support and resistance levels of the channel. Features: Automatic trend channel drawing Support and resistance levels Trend direction identification Customizable parameters How to use: Add the indicator to your chart. Adjust the parameters to your likin
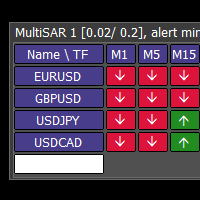
This tool monitors Parabolic SAR indicators on all time frames in the selected markets. Displays a table with signals to open a BUY trade (green) or SELL trade (red). You can easily add or delete market names / symbols. If the conditions for opening a trade on multiple time frames are met, you can be notified by e-mail or phone message (according to the settings in MT4 menu Tools - Options…) You can also set the conditions for sending notifications. The list of symbols/ markets you have entered
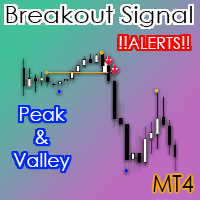
The valley and peak indicator strategy used in forex is a technical analysis approach that aims to identify potential trend reversals in the market. The strategy is based on identifying peaks and valleys in the price chart, which are points where the price reaches a high or low and then reverses direction. The valley and peak indicator is a tool that helps traders identify these patterns and generate buy and sell signals based on them. Here are the key steps involved in using the valley and pea
Welcome to the world of advanced trading with the Bollinger Bands Scanner! Maximize your trading potential with our powerful MT4 indicator designed for seamless analysis and real-time insights. Key Features: Effortless Bollinger Bands Scanning: Unlock the full potential of the Bollinger Bands Scanner by effortlessly scanning multiple assets. Receive instant alerts when specific Bollinger Bands conditions are met, ensuring you stay ahead of market movements. Comprehensive Dashboard Insights: Gai
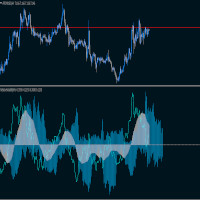
The indicator shows the deviation of the moving average relative to the volatility leading half of its period.
The red histogram shows the moving average relative to the anchor point.
The blue histogram shows volatility relative to the leading half
of the moving average.
The blue line simulates the price relative to the moving average.
The indicator is perfect for both grid trading and trend trading.
The signal does not change when the timeframe changes
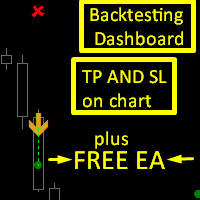
Ambitious Donchian EA can be downloaded from comment section but it need the ambitious donchian indicator to work.
Ambitious Donchian is a Donchian Channel and XO histogram based indicator that gives buy and sell signals in form of up and down arrows with tp and sl as objects on chart.
features :
1. Tp and Sl for each signal , the tp and sl can be selected as based on points or ATR value from indicator settings.
2.backtesting dashboard : the dashboard shows the following according to your i

This is the finest structure marking you will ever find in any market. indicator is coded considering the actual structure any trader would use. indicator is coded based on actual candle breaks and not coded based on any pivot or predefined values or specific number of candles high and low. please check out the screenshot. if you want me to fine tune it according to your needs then i am open for it.

The Flip Flop indicator tracks market trends, ignoring sharp fluctuations and market noise. The indicator can work both for entry points and as a filter.
The Flip Flop indicator displays information in a visual way. Helps in finding entry points during analysis. Suitable for trading on small time frames because it ignores sudden price spikes or corrections in price movements by reducing market noise around the average price.

Trend Channel is a Forex trend arrow indicator for identifying potential entry points. I like it, first of all, because it has a simple operating mechanism, adaptation to all time periods and trading tactics. Created based on a regression channel with filters. We display the signals of the Trend Channel indicator on the price function chart using a mathematical approach.
How it works: when the price breaks through the overbought/oversold zone (channel levels), a buy or sell signal is generate

거래 단말기의 현재 창에 늑대 파도를 검색하여 표시하도록 설계되었습니다. 거래에 늑대 파도를 사용하는 상인을위한 훌륭한 지표. 거래 전략에서의 적용은 효율성과 수익성을 크게 증가시킬 것입니다.
표시기에 대한 정보 다른 늑대 웨이브 지표와는 달리,웨이브 고원지 외환 지표는 크게 그 효과를 증가 기능을 가지고 있습니다:
첫 번째는 열린 창 5 점 매개 변수(진정한 값)정보 지원을 제공합니다,즉 늑대 파도가 나타난 차트의 창을 확장합니다. 예를 들어,유로화 차트가 열려 있고 각각에 웨이브 월드 표시기가 설치되어있는 경우 유로화 모델이 감지되면 해당 차트가 자동으로 다른 차트의 맨 위에 포 그라운드로 가져 오므로 많은 상품을 거래 할 때 매우 편리합니다. 두 번째 기능은 맥 디에 내장 된 발산 분석,사용자가 자신을 선택할 수있는 매개 변수(기본 설정(12,26,9))입니다. 그런데 일반적인 오실레이터의 값은 작업 창에 표시되지 않으며 점을 형성 할 때 가격 라벨의 색상에만 반영됩

The "Angel Algo" indicator, designed for the TradingView platform, is a powerful technical analysis tool that assists traders in identifying dynamic support and resistance levels in real-time. It provides valuable insights into potential breakout points and market regimes.
At its core, the "Angel Algo" indicator utilizes a rolling window of price data to calculate maximum and minimum price levels. It then dynamically identifies support and resistance levels by examining specific conditions re

Trend analysis is perhaps the most important area of technical analysis and is the key to determining the overall direction of an instrument's movement. The Quest Trend indicator determines the prevailing trend. They help analyze the market on a selected time interval. Trends are based on the principle of higher highs, higher lows (for an uptrend) and lower highs, lower lows (for a downtrend). They can have different time periods and they can be related to each other like fractals. For example,

Supreme Arrow는 RSI 및 구분 표시기 전략을 기반으로 하는 mt4용 화살표 표시기입니다.
이 전략은 인기 있는 시장에 적합할 뿐만 아니라 특히 스캘핑에 사용되는 경우 다양한 시장에서도 작동합니다.
권장 기간 : 언제든지
권장 추가 기능: 200 SMA
Supreme Arrow 표시기는 다시 칠하거나 다시 칠하지 않으며 신호가 지연되지 않습니다. --------------------------------------------------------------------------------------------------------------------------------------------------

With this tool you can create some useful data in a CSV file.
You can:
- Determine time frame - the number of candles to be loaded - Name the file whatever you want - Select additional data sets to be loaded
The following data is written to a CSV file.
- Time when the candle was created. - Open price - Close price - High price - Low price
The following selection is also available to you:
- Volume - RSI (you can also select the period) - Moving Avarage (you determine the period and m
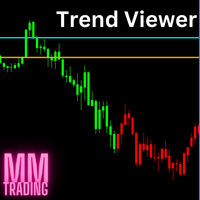
This indicator changes the color of the chart when prices are more bullish or bearish. It is recommended to use this indicator on small timeframes and only during peak trading hours. And don't forget your stop limit. This is not an oracle and not a holy grail.
In the settings, you can change the color of the candles and also their sentiment. To do this, use the Set 1 and Set 2 settings and test.
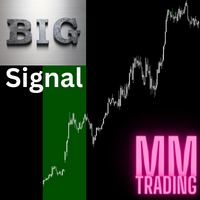
This is a multi-timeframe indicator that collects data from multiple time frames. It tries to identify the trend and predict a pullback. You have to understand that trends emerge suddenly and with that the pullback turns into a new trend. This is not a holy grail, always remember your stoploss. Use this indicator as a complement to your existing strategy.
The lines that are displayed on the chart can be changed so that they are only displayed in the indicator window and are therefore not dist
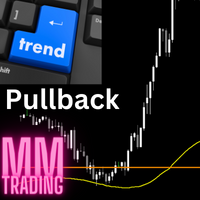
This indicator is not an ordinary moving avarage, even if it behaves similarly. I really like to use this to identify pullbacks. I only use this strategy once a day for one instrument, not more often. It is best if the price is further away from the line in the morning and when the pullback occurs, then you can create an entry setup using this indicator. Use additional indicators or use this as a supplement to your existing strategy.
This is not a holy grail. A pullback can quickly become a t
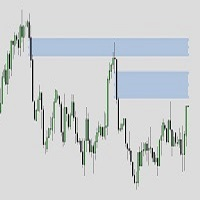
ICT Fair value gapes / Balanced price ranges it marks the fvgs i.e., bisi and sibi both filled and unfilled based on your requirements. it can work on mtf while your on any other time frame i.e., seeing on 5 min. you can watch from filled (BPRs) to unfilled (imbalances) of monthly/weekly/daily/H4/H1 to your likings It can be using multiple times using unique ID with buttons option to on and off the required TF or keeping them all.
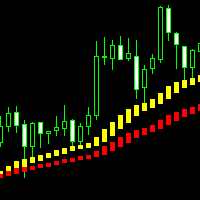
这是 一款可以直观识别波段趋势的分析指标,手工交易最佳选择,不重绘不漂移。 适应任何新手和量化交易的朋友。 参数设置(您购买指标后若不知道如何使用,请私信我): 快线: g_period_88 20
慢线: g_period_88 40
===========交易信号 ===========
快线:黄/蓝线;慢线:红/绿线 多头方向:快线上穿慢线,快线在慢线上方 空头方向:快线下穿慢线,快线在慢线下方
做多信号: 当快线上穿慢线形成一轮多头方向时,首轮多单进场条件为出现两根以上连续阴线,第3根以上K线出现一根阳线,且收盘价格在慢线上方,慢线为红线,即可成交第一单多单,同时如果满足价格回踩触碰到快线,出现一条阳线,且收盘价格在慢线上方,慢线为红线时,也可成交第一单多单;当第一轮多单结束后,此轮多头方向的多单只能满足价格回踩触碰到快线后,出现一条阳线收盘价格在慢线上方,慢线为红线时,才可继续做多进场,即不管快线是黄线或蓝线,只要阳线收盘价格在慢线上方,慢线为红线时就可以做多进场;当快线在慢线上方,阳线收盘价格在慢线上方,但慢线为绿线时,则不进场
做空信号: 当快线下穿

The indicator is the advanced form of the MetaTrader 4 standard Fibonacci tool. It is unique and very reasonable for serious Fibonacci traders.
Key Features
Drawing of Fibonacci retracement and expansion levels in a few seconds by using hotkeys. Auto adjusting of retracement levels once the market makes new highs/lows. Ability to edit/remove any retracement & expansion levels on chart. Auto snap to exact high and low of bars while plotting on chart. Getting very clear charts even though man
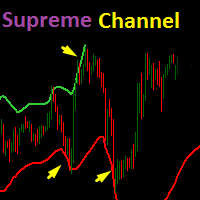
TV atr 채널 표시기를 기반으로 하는 Supreme 채널 표시기는 거래자에게 현재 추세의 잠재적 반전에 대한 힌트를 제공하는 동적 지지 및 저항 밴드입니다.
권장 시간 : 15M 이상
권장 설정: 기본값이지만 거래자는 필요에 따라 변경할 수 있습니다. ===========================================================
매개변수:
1. 채널 길이
2. 대역폭(두 채널 라인 사이의 거리)
3.Multiplier(ATR 값 승수)
4. 채널 표시(참/거짓) =========================================================================================
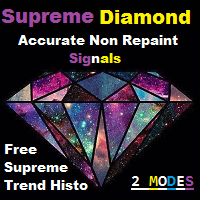
Supreme Diamond는 반전 및 추세 거래 전략을 기반으로 하는 다중 시간대 지표이며 지표는 다시 칠하거나 백 페인트하지 않으며 신호가 지연되지 않으며 지표는 경고와 함께 매수 및 매도 신호를 제공합니다.
표시기에는 (최고의 항목을 다이아몬드로 사용) 입력에서 선택할 수 있는 2가지 신호 모드가 있습니다. true로 설정되면 표시기는 일반 모드 신호를 필터링하고 가능한 최상의 신호를 다이아몬드 신호로 제공합니다. 다이아몬드 모드에서는 다이아몬드 신호를 조정할 수 없습니다. . 일반 모드는 (다이아몬드로 최상의 항목 사용) 입력이 false로 설정된 경우 스크린샷에 표시된 것처럼 밴드 설정과 볼린저 밴드 전략으로 일반 모드가 활성화됩니다. 최상의 성능을 보여주기 때문에 다이아몬드 모드 사용을 적극 권장합니다. 슈프림 다이아몬드 거래 방법: 지표에서 신호를 받으면 거래를 시작하고, sl을 이전 저점/고점으로 설정하고, tp를 최소 RRR 1:1로 설정하세요.
권장 기간
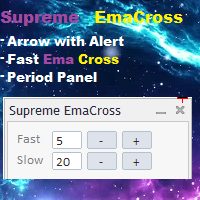
Supreme EmaCross는 두 개의 지수 이동 평균 교차를 기반으로 하는 지표이며, 에마 교차를 기반으로 매수 및 매도 화살표를 생성하고 신호 모양에 대한 경고를 제공하며 표시기가 다시 칠되지 않거나 후면 페인트 및 화살표가 지연되지 않으며 표시기가 빠릅니다. 에마 기간 변경 패널에서는 트레이더가 지표 설정으로 이동하지 않고도 에마의 값을 변경할 수 있으며 패널은 이동 가능합니다.
================================================= ====
매개변수:
빠른 기간 : 빠른 에마 기간
느린 기간 : 느린 에마 기간
알림 및 경고 설정
에마 라인 켜기/끄기
에마 라인 색상
에마 십자형 화살표 켜기/끄기
에마 십자가 화살표 색상
================================================= =========
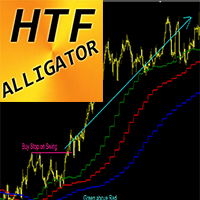
MT4의 Forex Indicator Alligator 더 높은 시간 프레임
악어 지표는 가장 강력한 추세 지표 중 하나입니다. HTF는 더 높은 시간 프레임을 의미합니다. 이 지표는 추세 거래자뿐만 아니라 가격 조치 항목과의 조합에도 탁월합니다. HTF 악어 표시기를 사용하면 더 높은 시간대의 악어를 현재 차트에 연결할 수 있습니다. 녹색 선이 빨간색 선 위에 있고 빨간색이 파란색 위에 있는 경우에만 매수 항목을 고려합니다. 차트의 최신 스윙 최대치에 대해 매수 중지 보류 주문을 정렬합니다. 녹색 선이 빨간색 선 아래에 있고 빨간색이 파란색 선 아래에 있는 경우에만 매도 항목을 고려하세요. 차트의 최소 최근 스윙에서 매도 중지 보류 주문을 정렬합니다. HTF 악어 지표는 낮은 위험으로 큰 이익을 얻을 수 있는 기회를 제공합니다.
// 더 훌륭한 전문가 자문 및 지표는 여기에서 확인할 수 있습니다: https://www.mql5.com/en/users/def1380/sell
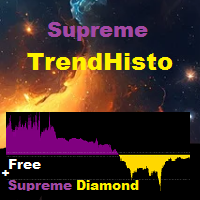
Supreme TrendHisto는 하향 및 상향 추세 신호를 제공하는 추세 표시기이며 표시기는 히스토그램 역할을 하며 표시기는 다시 그리기/뒤로 그리기/지연을 수행하지 않습니다.
전략
매수 거래: 히스토그램이 0.65 이상 교차하면 매수 거래가 시작됩니다. 청산의 경우 히스토그램이 0.70 레벨에 도달하면 퇴장하거나 웰에서 퇴장할 수 있습니다.
매도 거래: 히스토그램이 -0.65 아래로 교차하면 매수 거래가 시작됩니다. 청산의 경우 히스토그램이 -0.70 수준에 도달하면 청산하거나 웰에서 청산할 수 있습니다. ===============================
권장 기간 : 언제든지
권장기간 : 기본값
===========================================
매개변수:
1.지표 기간(스캘핑의 경우 더 낮고 스윙 트레이딩의 경우 높음)
2. 계산 유형(닫기/열기/낮음...등)
3.max bar(표시할 기록 수)
4.
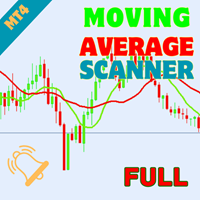
Welcome to the world of advanced trading with the Moving Average Crossover Multicurrency Scanner! Elevate your trading experience with our powerful MT4 indicator designed for seamless analysis and real-time insights. Key Features: Effortless Moving Average Crossover Scanning: Unlock the full potential of the Moving Average Crossover Multicurrency Scanner by effortlessly scanning multiple currency pairs. Receive instant alerts when specific Moving Average Crossover conditions are met, ensuring y
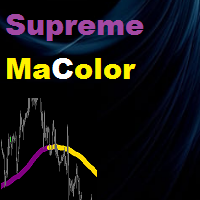
Supreme MaColor is an indicator based on moving average indicator , it gives up and down trend colors and it has different moving averages types and has multi time frame function , this indicator does not repaint/back-paint/delay signal. =================================================================================== Parameters : Timeframe (what time frame to use to draw Supreme Ma) Ma Period Ma Type Ma Price (close/open...etc) Average Shift (Ma shift) Multi Time frame on/off ===============
The presented indicator is based on a fast digital filter (RFTL) with the help of which a short-term trend is predicted. This product marks trend reversal points and support/resistance lines. The indicator has six calculation options: 1. Identifies the closing price leaving the channel; 2. Identifies the exit/entry of the closing price outside the channel; 3. Identifies the closing price leaving the channel and sideways price movement; 4. Identifies the average price going beyond the channel; 5.
The presented indicator is based on a slow digital filter (RSTL) with the help of which a long-term trend is predicted. This product marks trend reversal points and support/resistance lines. The indicator has six calculation options: 1. Identifies the closing price leaving the channel; 2. Identifies the exit/entry of the closing price outside the channel; 3. Identifies the closing price leaving the channel and sideways price movement; 4. Identifies the average price going beyond the channel; 5.
Supreme MaChannel is an indicator based on moving averages , the indicator gives dynamic support and resistance in bands format. Recommended for reversal traders , add it to your reversal strategy. Parameters : Supreme MA Period : ma periods Supreme MA Price : close/open/high/low..etc Supreme MA Type : Simple/Exponential/Smoothed/Linear Weighted Deviation : bands deviation the distance between the two band lines
Supreme Entry is an arrow signal based indicator that give buy and sell signals , the indicator gives buy/sell signals with alert on candle open/close (depends what you set it to be from inputs) . this indicator does not repaint/back-paint and signal is not delayed. Strategy : Open buy same moment buy arrow appear and open sell same moment a sell arrow appear , close on well or on opposite signal . Recommended Time frame : 15 and above this arrow is good as ? : addon to your existing strategy ,

The Datasource AC indicator is a technical analysis tool developed by the author based on the Accelerator Oscillator. Everyone knows the general principles of working with the AC indicator. Therefore, I will not describe them separately. I will focus on differences.
Differences are a purely technical implementation and expanded indicator. An important feature is that the indicator does not change its values even when using the closing price, since the indicator uses the safe calculation a
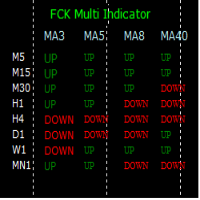
The FCK Multi Indicator for MT4 displays trend direction of multiple indicators on multiple time frames for a pair. So, forex traders can see the trend direction at a snap and trade with confluence of multiple indicators. Furthermore, it helps traders to see the trend in multiple time frames and trade in the direction of the overall market trend. Additionally, it shows the stop loss, pips to stop, pips in profit of any open position. The indicator display is very neat and is very helpful for bot
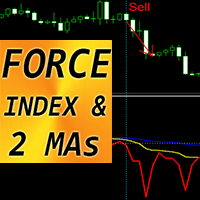
MT4용 외환 지표 "FORCE 지수 및 2개 이동 평균"
이 지표는 추세 방향으로의 모멘텀 거래에 탁월합니다. "FORCE 지수 및 2개의 이동 평균" 표시기를 사용하면 힘 지수의 빠르고 느린 이동 평균을 볼 수 있습니다. 힘 지수는 가격과 거래량 데이터를 단일 값으로 결합한 최고의 지표 중 하나입니다. 힘 지수 자체는 가격을 움직이는 데 사용되는 힘의 양을 측정하는 강력한 오실레이터입니다. 지표는 추세 변화를 매우 일찍 확인할 수 있는 기회를 제공합니다. 매개변수를 통해 이 지표를 설정하는 것은 매우 쉽고, 어떤 기간에도 사용할 수 있습니다. 매수, 매도 진입 조건은 사진에서 확인하실 수 있습니다
// 더 훌륭한 전문가 자문 및 지표는 여기에서 확인할 수 있습니다: https://www.mql5.com/en/users/def1380/seller // 또한 수익성 있고 안정적이며 신뢰할 수 있는 신호 https://www.mql5.com/en/signals/1887493에
STOCH ARROW is a long short arrow signal type indicator that is based on standard stochastic oscillator this indicator has 3 methods of giving long and short signal that are as follow : 1.whenever stochastic lines cross 2.when a cross happens in overbought and oversold zones (short arrow on overbought zone cross , long arrow on oversold zone cross) 3.when stochastic lines leave overbought and oversold zones (short arrow on leave from overbought zone , long arrow leave on oversold zone) this ind
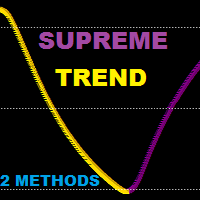
Supreme Trend is a reversal/continuation type Oscillator type indicator that is based on Moving average and stochastic indicators this indicator can be used in two methods : Reversal Method : short when golden arrow appear after arrows were above upper level (e.g 70) Reversal Method : long when Purple arrow appear after arrows were below lower level (e.g 30) Trend Method : long when arrows cross above 50 level line , short when arrows cross below 50 level line. use higher ma and stochastic peri
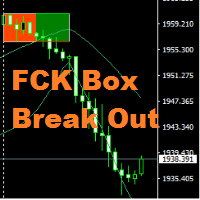
Hi All, " FCK Box Break Out " indicator is very simple indicator for new users. You can choose which indicators and timeframes you want to calculate. "FCK Box Break Out" provides the day's trend for buy/sell trades. Opposite side you the stop loss or hedging trade. NON-REPAINT Buy/Sell signals Recommendations Timeframes: Recommended - H 1 (Still, EA technically works on any Time frames ) Spread : up to 20 Recommended pairs: works on any metal, indices and currency pair

ICT Kill zone and Macros Indicator mark and display the following zone times on the chart: Kill zones Kill zone Forex Asian
London Open New York Open London Close Central Bank Dealing range
Kill zone Indices Asian London Open New York AM New York Lunch New York PM Power Hour
Macros London 1 London 2 New York Am 1 New York AM 2 New York Lunch New York PM 1 New York PM 2
Silver bullet London Open New York AM New York PM
Sessions Asian London New York
Chart The display of Kill zone ,

제목: "Daotradingfx - 7년 경험을 토대로 한 웨이브 트레이딩을 위한 완벽한 열쇠"
외환 거래는 결코 쉽지 않지만, Daotradingfx 지표를 사용하면 웨이브 트레이딩에서 성공의 문을 열 수 있는 신뢰할 만한 파트너를 찾을 수 있습니다. 내 7년의 거래 경험을 기반으로 만들어진 이 지표는 도구뿐만 아니라 시장 이해와 거래의 편의성에 대한 포괄적인 캔버스입니다.
Daotradingfx는 여러 시간 프레임을 활용하는 능력으로 두드러지며, 이는 시장 트렌드와 다양한 시각에서의 시장 움직임을 더 깊게 이해하는 데 도움이 되는 중요한 기능입니다. 여러 시간 프레임을 동시에 모니터링하면 더 정확한 거래 결정을 내릴 수 있으며 모든 전략에 대한 성공 가능성을 향상시킬 수 있습니다.
Daotradingfx의 또 다른 중요한 장점은 여러 통화 쌍을 추적하는 유연성입니다. 이 다양성은 하나의 통화 쌍에만 초점을 맞추는 것뿐만 아니라 시장 관찰 범위를 확장하고 거래 기회를
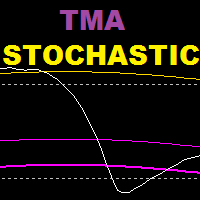
TMA 스토캐스틱은 스토캐스틱 오실레이터와 tma 밴드 지표를 기반으로 하는 지표이며, 이 지표는 반전 전략을 기반으로 합니다.
권장 시간대 : 15세 이상
권장 설정 : 스캘핑은 낮은 값, 스윙 트레이딩은 높은 값
================================================= ======================
매개변수:
tma 히스토리: 확률론적으로 tma 밴드를 표시하기 위해 얼마나 많은 막대가 다시 표시됩니까?
K 기간(확률론적)
D 기간(확률론적) S 기간(확률론적) TMA 기간
TMA 교대
Extreme tma 편차 : 원거리 대역의 편차
tma 편차 : 내부 밴드의 편차 ----------------------------------------------------------------

"Black Horse" 지표의 목표는 가격 행동과 VWAP 지표 간의 차이를 식별하는 것입니다. 이 지표는 잠재적으로 거짓된 차이를 걸러내고 고품질 및 정확한 경고를 생성하기 위해 필터를 사용합니다.
하락 차이는 양봉 위에 표시되는 빨간 점으로, 상승 차이는 양봉 아래에 있는 초록 점으로 나타납니다.
주된 차이 필터는 ATR(평균 실제 범위)와 되돌아보는 기간 내 이전 양봉의 가격 움직임을 중심으로 합니다. 가격 움직임이 ATR 곱하기 ATR 배수를 초과하는 충분한 강도로 나타날 때 차이가 확인됩니다.
계산 특성 상, 더 높은 시간 프레임에서 작업할 때 ATR 배수 및 되돌아보는 기간에 더 낮은 값을 설정하는 것이 좋습니다. 더 높은 시간 프레임에서는 가격 움직임이 보다 부드러워지므로 예를 들어 15분 차트에서처럼 급격한 가격 변동이 덜 발생하고 일반적으로 낮은 시간 프레임보다 더 적은 양봉 내에서 발생합니다. HSBC, 또는 BAC와 같이 변동성이 낮은 주식은 낮은
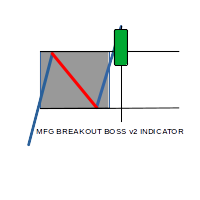
MFG breakout boss indicator is a Semi Autom ated Asian session range breakout System which seeks to identify the High and low of the asian session when the Market is ranging with no major movement, With the help of sofisticated Algorithm within the system, a breakout in either direction coupled with momentum the system gives High Accurate entries, with predefined Stop loss and 3 Take profit levels.
Elevate your trading with the JagzFX Market Regime Filter—adapt, optimize, succeed in navigating through smooth or volatile price movements. Gain a deeper understanding of market dynamics to refine your strategy and make informed decisions. KEY FEATURES Price Action Analysis: Distinguishes between smooth and volatile price movements. Trend Identification: Pinpoints bullish or bearish trends with precision. Strength Assessment : Evaluates the strength of identified trends—whether strong or weak M
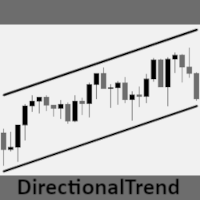
방향성 추세 트레이딩 인디케이터는 금융시장 추세를 명확하고 정확하게 볼 수 있도록 설계된 혁신적인 도구입니다. 이 지표는 과거 시장 데이터를 기반으로 특정 기간 동안 시장이 움직이는 일반적인 방향을 식별하고 표시합니다. 주요 목표는 시장의 지배적인 추세에 대한 명확한 신호를 제공하여 트레이더가 정보에 입각한 결정을 내릴 수 있도록 돕는 것입니다. 직관적 인 인터페이스로 설계된이 지표는 이해하고 사용하기 쉬우므로 모든 경험 수준의 트레이더에게 적합합니다. 신호가 차트에 명확하게 표시되므로 정보에 입각한 결정을 쉽게 내릴 수 있습니다. 트레이더는 진입 및 청산 신호 확인, 추세 반전 지점 식별, 손절 및 이익실현 수준 설정 등 다양한 방법으로 DirectionalTrend를 사용할 수 있습니다. 이 도구를 차트 분석에 통합하면 트레이더는 더 많은 정보에 입각한 결정을 내리고 시장에서 수익성을 높일 수 있습니다. 직관적이고 사용하기 쉬운 사용자 인터페이스를 갖춘 이 인디케이터는 모든 경

Доброго времени суток уважаемые трейдеры и инвесторы.
Вашему вниманию предлагается индикатор, определяющий за любой промежуток времени : Максимальную цену. Минимальную цену. 50 % от от максимума до минимума. Цену закрытия периода. Кроме того, в зависимости от настроек - индикатор может добавлять 10 процентных уровней как вниз, так и вверх, эти уровни указываются, но по стандарту начинаются от 50% с шагом 50% до 500%. В обе стороны. Индикатор реализован максимально удобно, при смене тайм-фрейма

The Waddah Attar Explosion (WAE) indicator is a potent tool in Forex trading, offering buy, sell, exit buy, and exit sell signals. It assesses trends as trend power and momentum as explosion power.
Trend Direction: - Green bars indicate a bullish trend. - Red bars indicate a bearish trend.
Signal Line: - A line serves as a threshold for momentum.
Buy Trade Setup: **Entry:** Go long when a green bar crosses above the threshold. Place a stop loss below the entry candle. **Exit:** Close the

In MetaTrader, TP & SL values aren't visible when hovering over corresponding lines. Our indicator fixes this by showing values on-screen. It displays defined SL and TP values in your account currency, facilitating easy tracking of positions. Note : The indicator estimates values, excluding commissions, and allows customization of colors and distance from SL/TP lines.
SURE REVERSAL is a histogram overbought/oversold type indicator that gives key reversal points that indicates a bull or bear market movment this indicator is fusion between moving average and the rsi indicator ,this indicator is non repainter , and is not delayed . Parameters : Ma period Ma Method Ma Price Sure Period (Rsi) Sure Price (Rsi) ==============

"추세 반전 ml4"는 가격 반전 순간을 실시간으로 결정하도록 설계된 고유한 지표입니다. 이것은 Metatrader4를 위한 기성 거래 시스템입니다. 표시기는 해당 값을 다시 그리지 않습니다! 고급 알고리즘과 기술적 분석을 기반으로 하는 이 지표는 가능한 시장 진입 및 퇴출 지점에 대한 명확한 신호를 제공하여 정보에 입각한 결정을 내리는 데 도움이 됩니다.
지표의 장점: 높은 신호 정확도. 표시기 자체는 올바르게 구성되었는지 여부를 거래자에게 보여줍니다. 제로 캔들 근처에 표시기가 TOTAL 값을 표시합니다. 값이 음수이면 지표 설정을 조정해야 하며, 값이 양수이면 설정이 올바르게 선택되어 거래를 시작할 수 있습니다. 표시기는 해당 값을 다시 그리지 않습니다. 이 지표는 모든 시간대와 모든 통화쌍에 사용될 수 있습니다. 이것은 기성 거래 시스템입니다.
특징:
반전 화살표: 빨간색 화살표는 판매 거래를 개시할 수 있는 지점을 명확하게 표시하며 향후 가격 하락을 경고합니다.

SX Currency Strength indicator allows users to analyze currency strength through a selected period, with results resetting periodically and accumulating thereafter. It displays the historical relative strength of eight major currencies (USD, EUR, GBP, JPY, AUD, CHF, CAD and NZD) across a selected timeframe. Assessing a currency's relative strength aids in evaluating its performance against a basket of other currencies. Users can select to visualize relative strength of the currencies in the shap

5부씩 판매될 때마다 가격이 30달러씩 오를 것입니다. 주요 지표는 전체 시장 트렌드를 파악하는 것을 목표로 합니다. 밝은 색과 어두운 색의 컬러 시스템은 강한 시장 조건과 약한 시장 조건을 식별하려는 노력입니다.
내 의견으로는, 이 지표는 비할 데 없이 탁월하게 작동합니다. 시장이 움직이기 시작할 때 특히 효과적입니다.
더 나은 결과를 얻기 위해 1시간, 4시간 또는 일일과 같은 더 긴 시간대에 해당 지표를 사용하고 싶다면, 그렇게 하십시오.
색상이 녹색으로 변경되면 매수 기회를 나타내며, 빨간색으로 변경되면 공매도 포지션을 열 것을 나타냅니다.
최적의 결과를 얻기 위해 트렌드가 있는 통화 쌍과 거래를 고려하십시오. 이것이 도움이 되길 바랍니다. 이를 활용할 방법을 찾게 되면, 친구와 공유해 주시기 바랍니다. 감사합니다.
MetaTrader 마켓은 과거 데이터를 이용한 테스트 및 최적화를 위해 무료 데모 거래 로봇을 다운로드할 수 있는 유일한 스토어입니다.
어플리케이션의 개요와 다른 고객의 리뷰를 읽어보시고 터미널에 바로 다운로드하신 다음 구매 전 트레이딩 로봇을 테스트해보시기 바랍니다. 오직 MetaTrader 마켓에서만 무료로 애플리케이션을 테스트할 수 있습니다.
트레이딩 기회를 놓치고 있어요:
- 무료 트레이딩 앱
- 복사용 8,000 이상의 시그널
- 금융 시장 개척을 위한 경제 뉴스
등록
로그인
계정이 없으시면, 가입하십시오
MQL5.com 웹사이트에 로그인을 하기 위해 쿠키를 허용하십시오.
브라우저에서 필요한 설정을 활성화하시지 않으면, 로그인할 수 없습니다.