Indicadores técnicos para MetaTrader 4 - 136

Super Entry es un indicador de tipo flecha todo en uno en el que proporciona señales largas y cortas solo en los niveles tp y sl que se basan en el valor ATR y se pueden cambiar y modificar. Este indicador proporciona un panel de pruebas retrospectivas que muestra la tasa de ganancias y otras estadísticas para dar una idea clara de cuánta precisión se puede esperar.
este indicador no se repinta ni se repinta y la señal se enciende con barra abierta sin demora.
Parámetros:
Configuración: v

The well-known ZigZag indicator that draws rays based on the “significant movement” specified by the pips parameter. If a ray appears, it will not disappear (the indicator is not redrawn), only its extremum will be updated until the opposite ray appears. You also can display text labels on each rays describing the width of the ray in bars and the length of the ray in points.

Review your trades is important key to succeeed in trading, with my tool it will be very easy to review all your trades. Just load my tool and load the account history.
It will show where and when entered and exited.
And one of the key ways to continually improve and iterate on our trading is to review our past trades and trading performance as a whole. Because you won’t notice the mistakes in the moment. And you can’t take a big picture view when you’re focusing on the micro aspects of eac

The indicator analyzes the chart as a mathematical function with X-time and Y-price axes. Time is presented in bars, price in pips. The purpose of the analysis is to give the user a signal to action at the moment when the function forms a recoilless movement in one direction over a certain period of time. The indicator parameters must be selected for each currency pair, since the price function is formed differently for each currency pair.
Shows favorable moments for entering the market with
Download the free USDJPY version here.
MACD Indicator The Moving Average Convergence and Divergence (MACD) is a trend following momentum indicator which shows the relationship between two moving averages that we chose and configure them on the indicator. The MACD is calculated by subtracting the 26-period exponential moving average and the 12 period D.A.M. These are the default parameters when you put the MACD indicator on the charts, and the period is usually 9 which means the last 9 candle

This indicator is, without a doubt, the best variation of the Gann Angles among others. It allows traders using Gann methods to automatically calculate the Gann angles for the traded instrument. The scale is automatically calculated when the indicator is attached to the chart. When switching timeframes, the indicator recalculates the scale for the current timeframe. Additionally, you can enter your own scales for the Gann angles. You can enter your own scales either for both vectors or for each

The ZigZag Wave Entry Alert (ZWEA) is a sophisticated technical indicator designed by Azad Gorgis, aiming to assist traders in identifying optimal entry points within the volatile forex market. This indicator specifically targets the EUR currency pairs, leveraging ZigZag patterns to predict future price movements. The ZWEA operates by analyzing historical price data to detect significant price changes that deviate beyond a predefined threshold, effectively filtering out minor price fluctuations
El indicador de señal Space signals es mi nuevo desarrollo para el comercio en los mercados de divisas y opciones Binarias. El algoritmo del indicador está escrito para que rastree la tendencia y dé señales al final del movimiento correctivo del precio.
En la configuración, puede configurar el período de las señales. Cuanto mayor sea el valor en la variable "período", más raras serán las señales. Pero naturalmente serán de mayor calidad.
También puede elegir a su gusto los códigos de flech
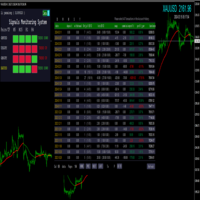
MT4 multi-variety multi-period signal monitoring system
Load to the indicators folder
Recommended loading chart: GBPUSD/XAUUSD/GBPJPY/USDJPY
Recommended loading period: M5/M15/H1/H4
Select all history by account history
- Statistics: Date, deposit, withdrawal, total number of transactions, number of transactions - long, number of transactions - short, total number of transactions, number of transactions - long, number of transactions - short, interest, commission, profit and loss, pro

Smooth Heikin Ashi provides a more smoothed signal of bull or bearish trends than regular Japanese candlesticks, or even the standard Heikin Ashi candles. Heikin Ashi as an alternative candlestick pattern that has been in use since its invention in Japan back in the 1700s. On normal Japanese candlesticks, there is a lot noise with mixed bearish and bullish candles side by side, even during trends. Heikin Ashi reduces this noise leaving an easier visual representation of trends. This indicator is

The Avia indicator analyzes the chart as a mathematical function with X-time and Y-price axes. Time is represented in bars and price in pips. The purpose of this indicator is to give the trader a signal to act at the moment when the function forms a recoilless movement in one direction over a certain period of time. Here are the main characteristics and settings of this indicator:
Peculiarities: Non-rebound movement : The Avia indicator looks for moments when the price moves in one direction

The " Vertical Levels " indicator for the Forex market is a tool for displaying vertical levels on a price chart. These levels can be useful for a trader, as they help identify significant points in price movement and potential reversal or trend continuation zones.
Peculiarities:
Vertical Levels: The "Vertical Levels" indicator allows you to display vertical lines on the chart, indicating certain levels. These levels can be adjusted using input parameters. Setting options: Length : Length o

Retracement Reversal and Support and Resistance Pro (for non pro version Click here ) is based on a formula used by Proprietary trading firms and other big institutions on WallStreet including on my Company and used by my traders here in the capital of the world. This indicator will create Red and Green arrows on a possible mayor Retracement level, Reversal Level and future Support and Resistance levels and Yellow arrows on a possible m i nor Retracement level, Reversal Level and future Suppo

Our support and resistance levels help to determine the reversal of the market price, fully track the trend, and also fix the profits in a timely manner. Support and resistance levels can also determine trading ranges. When you hover your mouse over the upper right corner of a level, a hint with a description of the level pops up. To avoid cluttering the chart, levels disappear after breaking through.
Input parameters: WPR_Period = WPR period UpLevel = WPR top l
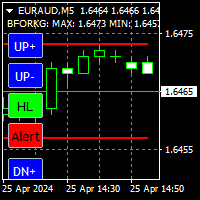
Very useful indicator, you won't be able to be without it. Essential for scalping. It shows rebound levels, top and bottom, forming a fork that surrounds the price. Each level has two blue controls associated to change it, has one green control for rebound mode: High/Low or Open/Close, and has a red breakage alert control. The values of each level, and the distance between levels in pips, are shown at the top left. Features: -T wo independent modes of operation: High/Low, Open/Close. -When on
El indicador para el comercio en el mercado de divisas y opciones Binarias está escrito sobre la base del indicador estándar MT4 de una Media Móvil Simple. Pero la diferencia con el indicador estándar es que sus líneas se repintan en diferentes colores dependiendo del estado de la tendencia. Si el color es verde, entonces la tendencia de compra. Si es rojo, a la venta. Durante el cambio de la fase de tendencia, aparece una alerta de sonido junto con un búfer en el gráfico en el medio de las líne

UPDATED VERSION INCORPERATES FIBONACCI FOR BETTER LEVELS AI Powered Price Clustering" is a custom indicator that integrates k means and Fibonacci. This powerful tool provides traders with valuable insights into price clustering patterns, facilitating more informed trading decisions. How it works: With "AI Powered Price Clustering," traders gain access to: A K means algorithm for precise analysis of price clustering patterns. Identification of key Fibonacci levels and centroids for enhanced tech
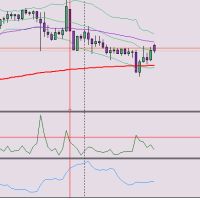
Indicadores Rango de Velas (Candle Range) y Rango Verdadero Promedio (ATR): Compara el tamaño del rango de la vela con el ATR. Ayuda a analizar el movimiento de los precios e identificar oportunidades de trading. ¿Desea saber más? Deje un comentario para compartir su experiencia. ** Sugerencias para mejorar la traducción: Proporcionar ejemplos específicos del uso del indicador. Explicar las ventajas y desventajas del indicador. Ofrecer tutoriales o videos sobre cómo usar el indicador.

Indicator Name: TrendMaster Description: TrendMaster is a powerful NONREPAINT Trading indicator designed to identify and capitalize on market trends with high accuracy. By analyzing a combination of technical indicators including Relative Strength Index (RSI), Stochastic Oscillator, and Average Directional Index (ADX), TrendMaster provides clear buy and sell signals, helping traders navigate both bullish and bearish market conditions. The indicator's advanced algorithm filters out noise and fals

The EntryHub system by MQ4.org is designed for Forex trading and is available as an indicator for the popular MetaTrader 4 (MT4) platform. Let’s delve into its details: Forex Entry Point System : The Forex Entry Point System is an MT4 indicator that assists traders in identifying potential entry points for their trades. It provides signals based on specific market conditions, helping traders make informed decisions. While it’s essential to note that no indicator is fo

The RSI Advanced tool will help traders capture trends and optimal entry points by:
- Enter a Buy order when the green line crosses the yellow line. Provided that the yellow line is near line 32 or 20 - Enter a Sell order when the green line crosses the yellow line. Provided that the yellow line is near line 68 or 80
Additionally, you can combine it with the convergence divergence that occurs at the green line. **When you purchase the Mastering the RSI MT4 or Mastering the RSI MT5 indicator

SmartSignal Sniper: Tu Compañero de Trading Definitivo Descubre el poder del trading preciso con SmartSignal Sniper. Diseñado para ofrecer señales de compra y venta precisas, esta herramienta avanzada permite a traders de todos los niveles navegar por los mercados financieros con confianza y claridad. Características Clave: Precisión Milimétrica: SmartSignal Sniper utiliza algoritmos avanzados para proporcionar señales precisas de compra y venta, ayudando a los traders a identificar oportunidade
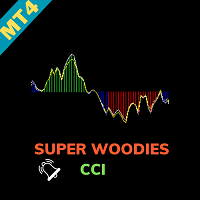
Super Woodies CCI Indicator - Enhance Your Trading Precision Step into the realm of precision trading with the "Super Woodies CCI Indicator" for MetaTrader 4. This advanced tool, inspired by Woodie's CCI, is designed to provide you with clear insights into market trends, enabling you to make well-informed trading decisions. Basic Details : Indicator Type : Super Woodies CCI Indicator Key Metrics : Real-time CCI (Commodity Channel Index) analysis for price trends. Customization : Fully customizab

Adaptive Market Dynamics Indicator (AMDI) is an innovative tool for traders across all financial markets. This indicator is designed to provide traders with a deep understanding of market dynamics and adaptive trading signals based on current market conditions. Key Features and Benefits: Adaptive Analytics : AMDI can automatically adapt to changing market conditions, allowing traders to effectively adjust their strategies in real-time. Multifactor Analysis : The indicator offers a comprehensiv
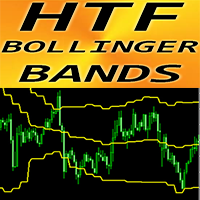
Indicador Forex "Bandas de Bollinger HTF" para MT4
Actualice sus métodos comerciales con el indicador profesional "HTF Bollinger Bands" para MT4. HTF significa - Marco de tiempo más alto Las Bandas de Bollinger son uno de los mejores indicadores del mercado: una herramienta perfecta para operar Aproximadamente el 90% de la acción del precio ocurre entre las dos bandas. El indicador HTF Bollinger Bands es excelente para sistemas de comercio de marcos de tiempo múltiples con entradas de acción
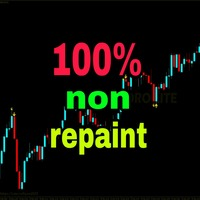
'Zoro LITE' is a reversal strategy based MT4 indicator with advance pre-alert system. Its an 100% non repaint indicator with an average accuracy of about 70-95% in a ranging market. --------------------------------------------------------- Features: Neural Network based Advance price action algorithms Pre-alert (get ready) signals Non-delay indications 24/7 signals OTC markets supported Auto-trading supported 100% Non repaint 100% No lag No recalculating Lifetime license -----------------------
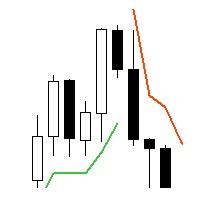
Supertrend - невероятно мощный и универсальный индикатор, предназначенный для помощи трейдерам в определении текущего тренда на конкретном торговом инструменте. С помощью двух встроенных индикаторов, Average True Range и Standard Deviation, трейдеры могут выбрать наиболее подходящий индикатор для своей стратегии торговли. Пользователи также могут настроить период этих индикаторов и выбрать цену (Close, High, Low, Open, Weighted), к которой он должен быть применен, с Typical price в качестве опци

Trop is a trend indicator that has several important advantages. It helps to pinpoint both new and existing trends in the market. One of its key advantages is its quick adjustment and responsiveness to changes in schedule. The effectiveness of the indicator depends on the set CalcBars period. The longer this period, the smoother the indicator displays the trend line. On the other hand, as the period decreases, the indicator takes into account more market noise, which can be useful in generating

In the world of trading, one of the main concerns is finding a reliable trading system. Meet the TrendEdge Channel indicator - your reliable companion in this search. Developed based on complex mathematical calculations, this indicator predicts the most likely short-term price movements.
TrendEdge Channel is designed specifically to identify trends in price movements. Thanks to it, you can quickly determine not only the direction of the trend, but also the levels of interaction between buyers
The TrendScope Pro indicator views the chart as a function with the X-axis representing time and the Y-axis representing price, expressed in bars and pips respectively. The main objective of the indicator is to provide users with signals for actions when the function forms continuous movement in one direction over a specific period of time. The indicator parameters need to be adjusted individually for each currency pair, as the price function varies for different pairs.
The indicator provides

El indicador Spread Pulse es una herramienta eficaz que proporciona a los operadores información sobre el diferencial actual en el gráfico. El diferencial es la diferencia entre el precio de compra y el precio de venta de un instrumento.
El indicador se presenta en forma de texto que se muestra en el gráfico. Esto permite al comerciante rastrear fácilmente el diferencial actual.
Una de las principales ventajas del indicador Spread Pulse es su visualización en color. Dependiendo del tama
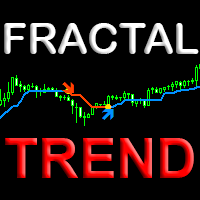
The Fractal Trend indicator visually displays trend changes in price fractals based on the Price Action (PA) principle. The unique algorithm uses the fractal principle of determining a trend change and a new proprietary method of filtering fractals, which gives an advantage in relation to other similar indicators based on MA moving averages. This new approach to trend determination helps to determine with high confidence the trend change points on any financial instrument and on any time frame

The SignalSailor indicator is your reliable assistant in Forex for quick market analysis. It not only reflects the current market condition but also provides valuable signals about the best times to open trades. Market conditions are constantly changing, and to stay ahead, a trader needs to quickly adapt their strategies. This is precisely why the Klaus indicator was created - it will help you accurately determine the direction of the trend on the price chart.
SignalSailor is an indispensable

The TrendTide indicator provides accurate signals about potential market reversals. Its primary purpose is to generate signals for entering and exiting trades. Determining the current market trend is a critically important aspect for traders. The intelligent algorithm of TrendTide efficiently identifies trends, filters market noise, and creates precise entry and exit signals.
This indicator represents an advanced algorithm for visualizing the market trend. It is designed to identify both long

The Market Sentiment Meter indicator calculates the saturation levels of the price chart. A signal to exit the oversold zone indicates a buying opportunity, and a signal to exit the overbought zone indicates a selling opportunity. Typically, for this indicator you need to set relative values for the overbought (Top) and oversold (Bottom) levels.
Often a good trend can be seen visually on the price chart. However, an experienced trader must clearly understand the current distribution of forces

USDLFX is a currency index of US dollar formulated by LiteForex broker. It is an attempt to create an indicator for USD currency power. The idea has been further extended to other major Forex currencies. These indices are not available on other brokers. There are other currencies AUD CAD EUR CHF GBP NZD JPY Thanks to this indicator, you have an objective view of the selected currency

Introducing High Probability SARs, a classic Forex indicator designed to enhance your trading strategy with its advanced analysis capabilities. High Probability SARs utilizes sophisticated algorithms to identify potential trend reversals with precision. By incorporating the Parabolic SAR indicator, it offers traders valuable insights into market dynamics, allowing for informed decision-making. This innovative tool provides traders with signals based on the Modified parabolic SARs, helping to ide

TrendTrack indicator: Stay on trend easily!
The TrendTrack indicator is designed to analyze price behavior in the Forex market, helping the trader to quickly spot temporary weaknesses or obvious changes in trend direction. Entering the market is only the first step, but maintaining a position is more difficult. With TrendTrack, staying on trend becomes easy!
Peculiarities:
Trend Analysis: The indicator analyzes historical data, providing signals to the trader. The arrow format of the indi

The Trendline Trader indicator is designed to reliably track market trends, ignoring sharp fluctuations and noise in the market. This indicator is suitable for trading on both short and long time intervals due to its ability to filter out sudden price spikes and corrections. It is based on the iLow, iHigh, iMA and iATR indicators, which makes it particularly reliable.
Parameters for setting up the indicator: Length: period for channel calculation and noise filtering. Star: period for determin

History VT Информационный индикатор. Показывает на графике, сразу после открытия сделки, стрелку именно на той японской свече, где позиция открыта.
То есть там, где появилась штрихпунктирная линия открытой сделки, в терминале.
Далее, после открытия сделки, как обычно, трейдер ставит SL и TP и ждёт итога своего выбора направления движения.
После того как сделка закрылась, по « sl » или « tp » или «вручную», индикатор отображает на графике уровни и текстовые сноски параметров сделки.
С

Introduction
One of the patterns in "RTM" is the "QM" pattern, also known as "Quasimodo". Its name is derived from the appearance of "Hunchback of Notre-Dame" from Victor Hugo's novel. It is a type of "Head and Shoulders" pattern.
Formation Method
Upward Trend
In an upward trend, the left shoulder is formed, and the price creates a new peak higher than the left shoulder peak . After a decline, it manages to break the previous low and move upward again. We expect the pric
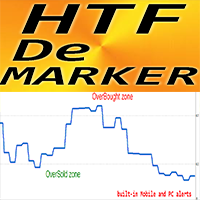
Indicador Forex HTF DeMarker para MT4
Este indicador es una herramienta útil utilizada por los operadores técnicos para encontrar puntos de entrada y salida. HTF significa: Marco de tiempo más alto. La línea del oscilador DeMarker indica la posición actual del precio en relación con los máximos y mínimos anteriores DeMarker proporciona las señales de divergencia regulares más eficientes entre otros osciladores La zona de Sobrecompra es cuando el DeMarker está por encima de 0,7 y la de SobreVe
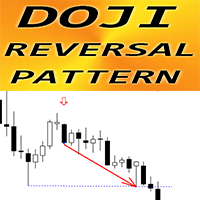
Indicador Forex "Patrón de inversión Doji" para MT4
El indicador "Patrón de inversión Doji" es pura negociación de acción del precio: sin repintado, sin demoras; El indicador detecta el patrón de inversión Doji en el gráfico donde la vela Doji está en el medio del patrón y la última vela es la de ruptura: Patrón de inversión alcista Doji: señal de flecha azul en el gráfico (ver imágenes) Patrón de inversión bajista de Doji: señal de flecha roja en el gráfico (ver imágenes) Se incluyen alertas
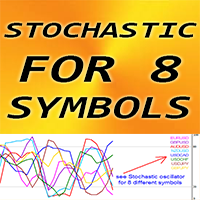
Indicador Forex "Estocástico para 8 símbolos" para MT4.
El oscilador estocástico es uno de los mejores indicadores del mercado y es una herramienta perfecta para muchos traders. Zona de sobrecompra: por encima de 80; Uno sobrevendido: menos de 20 Es fantástico aceptar entradas de venta de zonas superiores a 80 y entradas de compra de zonas inferiores a 20. "Estocástico para 8 símbolos" brinda la oportunidad de controlar valores estocásticos de hasta 8 símbolos diferentes en 1 gráfico Este ind
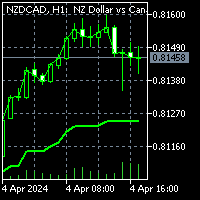
To get access to MT5 version please click here . This is the exact conversion from TradingView: "G-Channel Trend Detection" by "jaggedsoft". This is a light-load processing and non-repaint indicator. You can message in private chat for further changes you need. All input options are available. Buffers are available for processing within EAs. Highlight option is omitted as does not show good in Metatrader.
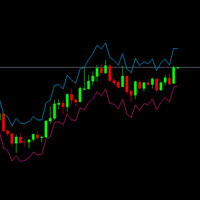
Para todas las temporalidades y todos los símbolos. Basado en el Indicador ATR. Calcula y dibuja en el gráfico los puntos adecuados para colocar el Stop Loss o el Take Profit según la volatilidad actual del mercado. Se pueden ajustar los siguientes inputs para un uso más personalizado del indicador: ATR_Period: Número de velas anteriores que se tendrán en cuenta para el cálculo. ATR_Multiplier: Número por el que se multiplicará el ATR para dibujar los puntos en el gráfico. A menor multiplicador

Forex Gump Advanced es una estrategia comercial lista para usar basada en un indicador. Forex Gump Advanced es un indicador que muestra al operador cuándo abrir operaciones, en qué dirección abrir y cuándo cerrar. Forex Gump Advanced muestra toda la información necesaria de forma clara en el gráfico.
Ventajas del indicador: sistema de comercio completamente listo no vuelve a dibujar en el 95% de los casos el precio va en la dirección de la señal. El 5% de las señales no funcionan y cierran co

APP System Signals es un indicador sofisticado diseñado para traders activos en los mercados financieros. Proporciona señales precisas de compra y venta basadas en un análisis técnico avanzado, lo que permite a los traders tomar decisiones informadas. El indicador utiliza una combinación de medias móviles exponenciales (EMA), medias móviles simples (SMA) y tendencias subyacentes para generar señales fiables. Los parámetros son completamente personalizables, lo que permite a los traders adaptar
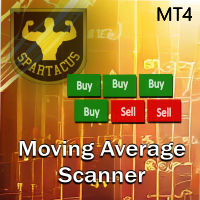
Moving Average Scanner es un escáner de múltiples períodos de tiempo perfecto para ver la tendencia en varios períodos de tiempo de un vistazo sin cambiar el gráfico. Puede utilizar hasta 4 medias móviles de su elección en 9 unidades de tiempo. Es totalmente configurable y se puede mover a cualquier parte del gráfico simplemente "arrastrar y soltar". Las medias móviles se pueden configurar en 4 métodos de cálculo diferentes. También puede configurar alertas basadas en la cantidad de promedios mó
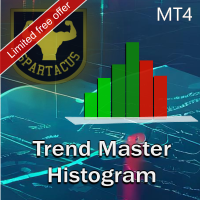
Trend Chart Histogram es un indicador basado en un algoritmo que utiliza dos medias móviles y varios osciladores. Gracias a su código de colores, permite identificar rápidamente la tendencia y aprovechar los mayores impulsos del mercado. Los colores claros indican la tendencia, los colores oscuros definen impulsos y el gris indica que no se debe ingresar al mercado.
Versión MT5 aquí.
Parámetros de entrada: - Período 1 (período rápido) - Período 2 (período lento) - Periodo del oscilador
P
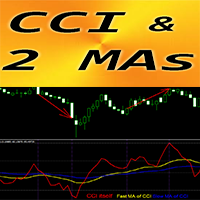
Indicador Forex "CCI y 2 medias móviles" para MT4
El Commodity Channel Index (CCI) es excelente para operar con Momentum en la dirección de la tendencia. El indicador "CCI y 2 medias móviles" le permite ver las medias móviles rápidas y lentas del indicador CCI Tendencia alcista: la MA rápida está por encima de la lenta; Tendencia a la baja: la MA rápida está por debajo de la lenta CCI es uno de los osciladores más populares para operar: mide la diferencia entre el precio actual y el precio pr
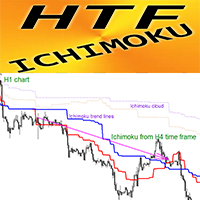
Indicador Forex HTF Ichimoku para MT4
El indicador Ichimoku es uno de los indicadores de tendencia más poderosos. HTF significa - Marco de tiempo más alto Este indicador es excelente para los operadores de tendencias, así como para combinarlo con entradas de acción del precio. El indicador HTF Ichimoku le permite adjuntar Ichimoku desde un período de tiempo superior a su gráfico actual. Tendencia ascendente: línea roja sobre la azul (y ambas líneas están sobre la nube) / Tendencia a la baja:

Patrón de barra interior del indicador Forex para MT4
El indicador "INSIDE Bar" es un indicador muy potente para el comercio de Price Action El indicador detecta patrones de barras INTERIORES en el gráfico: Barra INTERIOR alcista: señal de flecha azul en el gráfico (ver imágenes) Barra INTERIOR bajista: señal de flecha roja en el gráfico (ver imágenes) Sin repintar; Sin retrasos; Alta relación R/R (recompensa/riesgo); Se incluyen alertas para PC, dispositivos móviles y correo electrónico El i
Based on unique formulas and calculations, this indicator analyses every price move on the chart then applies its unique formulas on them to indicate the currently dominant direction. This indicator works on all instruments but best with GOLD (XAUUSD). It can also work as an entry confirmation tool and can also serves highlighting the worthy and noticeable moves on the chart. The Oppo Signals Indicator can work alongside any other strategy and can also help traders devise their own strategies u

Heiken Ashi Histo Filter: ¡es una herramienta comercial auxiliar excelente y eficiente!
Se utiliza un nuevo método de cálculo avanzado: 10 opciones para el parámetro "Precio para el cálculo" Excelente para combinar con patrones Price Action Histograma de color verde: busque entradas alcistas Histograma de color magenta: busque entradas bajistas Hay muchas oportunidades para mejorar incluso las estrategias estándar con este indicador. El indicador tiene alertas integradas para dispositivos móv

The indicator is based on the calculation of liquidity on the market and thus shows where the market can most likely turn.. It shows the places of liquidity where the price will reach sooner or later... The indicator can be set to several types of liquidity and therefore can display several levels on the graph.. It is a unique tool that can help you very well in your trading The indicator is suitable for currency pairs with the most liquidity (EURUSD/GBPUSD...)

Once upon a time, in the bustling streets of Gotham City, there lived a mysterious figure known only as the Joker. With his enigmatic grin and unpredictable nature, the Joker roamed the city's financial district, leaving chaos and uncertainty in his wake. One fateful day, a group of traders stumbled upon a peculiar artifact hidden deep within the dark alleys of Gotham. It was a cryptic indicator known as the "Joker Arrow," rumored to possess the power to predict market movements with uncanny acc

Part One : Characteristics Integrated line drawing and wave marking function Automatic adsorption( namely Auto Search High/Low )during Drawing Draw zigzag Lines and Fibo/Expansion at the same time Calculate the scale rate of Interval Spans which is called Qjt for short Continuously delete objects by click Deleting drawings in batch Show/Hide Drawings and Wave-Marks Quickly save current chart as picture to certain folder Show/Hide main panel by click certain zone of PriceAxis or by hotkey W Swi
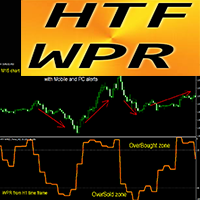
Potente indicador Forex HTF WPR Oscilador para MT4
Actualice sus métodos comerciales con el oscilador HTF WPR profesional para MT4. HTF significa - Marco de tiempo más alto WPR es uno de los principales osciladores para el especulación Este indicador es excelente para sistemas de comercio de marcos de tiempo múltiples con entradas de acción de precio de áreas de sobreventa/compra. El indicador HTF WPR le permite adjuntar WPR desde un período de tiempo superior a su gráfico actual -> este es u
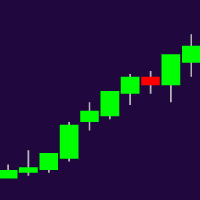
Higher Timeframe Chart Overlay will display higher timeframe candles, including the number of candles high/low you specify.
You no longer need to switch timeframes to check the candles. Everything can be shown in one chart. MT5 Version : https://www.mql5.com/en/market/product/115682 Almost everything can be change as you want. You can change/set:
- Choose different colors for the body and top/bottom wicks.
- Panel's height and width.
- The width of the body and wicks
- Change backgro

The indicator reveals key levels for gold.
The levels can be used for support and resistance, breakout, break and retest or most strategies.
The major levels can be used for intraday trades from one level to the next or reversals.
The mini levels can be used to scalp lower timeframes.
The color, line style and thickness can be adjusted as preferred.
Symbol: XAUUSD Timeframe: Major levels - M30 - H4 Mini Levels M15 - M1
The levels may enhance your current setup.

The indicator plots key levels automatically for EURUSD.
Major levels - H4,H1 Minor Levels - M30,M15 Mini Levels - M5,M1
To deactivate a level, just select color none.
It can be used to enhance your current strategy. (Please see screenshots)
The color, line style and thickness can be adjusted as preferred.
Symbol: EURUSD Timeframe: H4 and below
Enjoy! ------------------------------------------

TRADE THE BREAKOUTS like Gordon Gekko Gordon Gekko, the ruthless and iconic character from the movie "Wall Street," is renowned for his aggressive and opportunistic trading strategies. When it comes to trading breakouts, Gekko embodies the mindset of a savvy and relentless trader who seizes every opportunity to capitalize on market movements. In Gekko's trading playbook, spotting breakout opportunities is akin to identifying potential gold mines in the market. He meticulously scans the charts
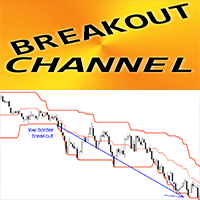
Indicador Forex CANAL DE BREAKOUT para MT4, sin repintado
Este indicador se puede utilizar como un sistema comercial completo basado en rupturas altas/bajas. Tiene solo 1 parámetro: PROFUNDIDAD HISTÓRICA, que refleja la cantidad de velas que el indicador tiene en cuenta. Parámetro PROFUNDIDAD HISTÓRICA valores recomendados: período de tiempo D1 - 20 (un mes), H4 - 30 (una semana), H1 - 24 (un día) EL CANAL DE BREAKOUT consta de 3 líneas: Borde alto: precio máximo de las últimas N velas (parám
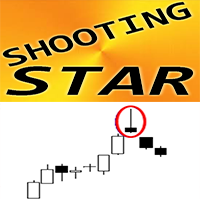
Indicador Forex "Patrón de estrella fugaz" para MT4
El indicador "Patrón de estrella fugaz" es un indicador muy poderoso para el comercio de acción del precio: sin repintado, sin demoras; El indicador detecta patrones bajistas de estrella fugaz en el gráfico: señal de flecha roja en el gráfico (ver imágenes) Se incluyen alertas para PC, dispositivos móviles y correo electrónico El indicador "Patrón de estrella fugaz" es excelente para combinar con niveles de soporte/resistencia: https://www.m
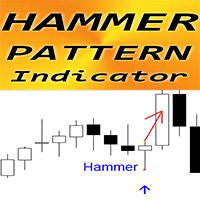
Indicador Forex "Patrón de martillo" para MT4
El indicador "Patrón de martillo" es un indicador muy poderoso para el comercio de acción del precio: sin repintado, sin demoras; El indicador detecta patrones de martillo alcistas en el gráfico: señal de flecha azul en el gráfico (ver imágenes) Se incluyen alertas para PC, dispositivos móviles y correo electrónico El indicador "Patrón de martillo" es excelente para combinar con niveles de soporte/resistencia: https://www.mql5.com/es/market/produc
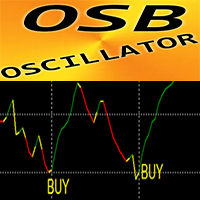
OSB Oscillator: es un indicador personalizado avanzado, una herramienta auxiliar eficiente de Price Action.
Se utiliza un nuevo método de cálculo avanzado. Nueva generación de osciladores: vea las imágenes para comprobar cómo usarlos. OSB Oscillator es una herramienta auxiliar para encontrar puntos de entrada exactos para señales de acción del precio, divergencia y sobreventa/sobrecompra. Valores de sobreventa: por debajo de 30 Valores de sobrecompra: más de 70 Hay muchas oportunidades para m

This is a correlation hedge type indicator which helps trade the obscure relationship between crude oil and natural gas markets. Which is overall an unknown trading concept to most traders, yet a very impressive one. The usual market risk is mittigated through the smooth trend of hedge tading, as well as the leading signals the indicator provides!
Pros: low risk trading, normal profits, no need to be right about either market
Cons: requires large capital
----------------------------------

"Awesome Market Prediction" is a revolutionary indicator designed to provide accurate and sophisticated market predictions to traders. Developed with cutting-edge technology and intelligent algorithms, this indicator offers deep insights into future market movements. Key features of "Awesome Market Prediction" include: High Accuracy Predictions : Utilizing in-depth data analysis and advanced prediction techniques, this indicator delivers highly accurate estimates of market direction. Multiple Ma

MASONS-una herramienta que te hace un analista profesional! El método de determinación de los movimientos de onda con la ayuda de canales inclinados,transmite cualitativamente el esquemático del movimiento de cualquier instrumento,mostrando no solo las posibles reversiones en el mercado,sino también los objetivos de otros movimientos.Destruye el mito de que el mercado está vivo ,mostrando claramente los movimientos esquemáticos de un rango a otro! Herramienta profesional, adecuado para la persp
El Mercado MetaTrader es la única tienda donde se puede descargar la versión demo de un robot comercial y ponerla a prueba, e incluso optimizarla según los datos históricos.
Lea la descripción y los comentarios de los compradores sobre el producto que le interese, descárguelo directamente al terminal y compruebe cómo testar el robot comercial antes de la compra. Sólo con nosotros podrá hacerse una idea sobre el programa, sin pagar por ello.
Está perdiendo oportunidades comerciales:
- Aplicaciones de trading gratuitas
- 8 000+ señales para copiar
- Noticias económicas para analizar los mercados financieros
Registro
Entrada
Si no tiene cuenta de usuario, regístrese
Para iniciar sesión y usar el sitio web MQL5.com es necesario permitir el uso de Сookies.
Por favor, active este ajuste en su navegador, de lo contrario, no podrá iniciar sesión.