Guarda i video tutorial del Market su YouTube
Come acquistare un Robot di Trading o un indicatore
Esegui il tuo EA
hosting virtuale
hosting virtuale
Prova un indicatore/robot di trading prima di acquistarlo
Vuoi guadagnare nel Market?
Come presentare un prodotto per venderlo con successo
Expert Advisors e Indicatori per MetaTrader 5 - 55

Announcement: All EAs (Expert Advisors) from QuanticX are currently available for free, but only for a limited time! To enjoy a Lifetime QuanticX support and continue receiving free EAs, we kindly request you to leave a review and track the performance of our EAs on Myfxbook. Additionally, don't hesitate to reach out to us for exclusive bonuses on EAs and personalized support.
Quant Yen Edge - GBPJPY Trading Bot Welcome to Quant Yen Edge - Your Precision Trading Companion for GBPJPY Step into t
FREE

Questo EA viene utilizzato per commerciare in periodi laterali Imposta l'importo del lotto, l'importo del punto di profitto (non pip), l'importo del punto di stop loss, il prezzo massimo, il prezzo minimo Quando il prezzo corrente aumenta fino a un prezzo massimo uguale o superiore, EA effettuerà un ordine di VENDITA con prezzo Lotto e T/P e prezzo S/L Quando il prezzo corrente scende pari o inferiore al prezzo minimo, EA effettuerà un ordine ACQUISTO con prezzo Lotto e T/P e prezzo S/L Pertanto
FREE

Great dashboard for market analytics. Help you to analyze the values of the Moving Average indicator and prices.
Using this dashboard you can: find signals from the Moving Average from all timeframes; find signals from the Moving Average from all symbols; check - how far the Moving Average is from the price; check - the Moving Average value has changed; 2 types of signal.
Modes of operation (switched by a button on the graph): current value of Moving Average; the difference between the curr
FREE

Volume Above Average Indicator - MQL5 Introduction The Volume Above Average Indicator is a custom indicator for the MetaTrader 5 (MQL5) platform that helps traders identify the current trading volume compared to the historical average. The indicator uses three different sensitivity levels to classify volume into weak, medium, and strong, providing a clear visualization of market momentum. Key Features Displays trading volume in a separate window. Compares the current volume with the historical a
FREE

A Fibonacci Panel tool to facilitate your trading with Fibonacci indicator. Simple and easy to use! Magnificent Design (Adjustable) Sound Effects (This will make trading much more fun) Five Fibonacci Levels (freehand movable) Acoustic and graphic signals (adjustable for each level) Integrated narrow trading panel also with risk and money management If you need silence while trading, you can deactivate the sounds in the settings.
Parameter
Language English Magic number Commentary (for all posi
FREE

Индикатор PivotPointSuperTrend отлично показывает данные Тренд на основе мат данных от Pivot и ATR и очень удобен для входа в сделку и выставления стопов. Если кто то сможет добавить в код мултитаймфрем, я и многие пользователи будут очень Благодарны, то есть чтобы ондикатор показывал значение старшего таймафрема на графике младшего таймфрема, Заранее Спасибо!
FREE
The Tickerly TV Connector allows seamless integration between TradingView strategies and your MT5 terminal. With this tool, you can automate trade execution by linking TradingView’s powerful scripting environment to your MetaTrader Terminal.
Features include fast trade execution via Tickerly’s engine and easy setup using webhooks. This EA is perfect for traders who want to deploy custom TradingView strategies on MT5, keeping their terminals in sync with real-time market conditions.
Requires mini
FREE
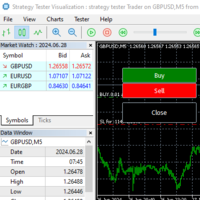
Gives you a trading environment where you can do forward testing without the use of a live trading account. You will be able to trade the same Market without having to wait for the next day, but by just fast forwarding on the strategy tester and going straight to that session. You can trade it over and over again without having to just look at the charts and have a bias analysis when back testing on a chart that is not moving
FREE

SPREADEX e' un indicatore per MT4 e MT5 che indica la distanza dell'ASSET dal GP. il GP e' il prezzo del vero valore dell'ASSET sottostante ottenuto per stima. Il GP e' come una calamita, attira il prezzo dell'ASSET con alta probabilita' ed all'interno della stessa giornata di trading. Quindi SPREADEX indica quali sono gli asset piu distanti dal GP al momento in tempo reale. Fornendo un punto di vista al TRADER su quali asset concentrarsi e cercare eventuali segnali di inversione dei prezzi per
FREE

MFI_Expert is structured based on a specific technical analysis indicator ( Money Flow Index ). It has many parameters so that each user can find the appropriate settings that suit their investment profile. It can work on 28 different pairs, one pair per chart. The default parameter settings are indicative, I recommend that each user experiment to find their own settings.
FREE

Santa Donchian Indicator is an efficient way to detect support, resistence and break outs in any market.
The Donchian channel measures the high and the low of a previously defined range. Typically, a trader would look for a well-defined range and then wait for the price to break out to either one side for a trade entry trigger. Advantages Never repaints, never backpaints, never recalculates. Works in all symbols and all timeframes. Perfect trend filter for any strategy or expert advisor. Full
FREE

Rebate System performs a large number of trades with the minimum profit, which gives the opportunity to earn from receiving rebates (returning part of a spread). It is based on two grids (buy and sell), when one of them is in a drawdown, the other one can enter with an increased lot size, keeping the account away from the drawdown. Differences from the usual EA Rebate System in the mode of closing long-term losing trades in one of the grids due to the previously received profit. Input parameters

Make simple your trading strategy used PDH & PDL to get funding "faster!"
2 signal entry methods for Breakout or Reversal PDH-PDL. We recommend doing a backtest first on your demo account before using it on a real account. For BreakOut OpenPosition = true. For Reversal OpenPosition = false. Tutorial ->> Here Contact us ->> Here Include Reset All Variable For New Day. EA PDH-PDL.
Chat us for any question.

Description This is a Utility tool for MT5 which will make our chart analysis task quite more efficient and save large amount of time. As for chart analysis, some are watching out several symbol simultaneously with single timeframe and others are trading only one single pair with multi timeframe analysis. For both, a common troublesome issue is “scroll chart to look back” or “draw chart objects” in multi charts at the same time. Especially for those who are trading with multi timeframe soluti
Protect My Trades is an EA (expert advisor bot) that automatically put stop loss and take profit on market trades and pending orders. You can specify if want it to do this only on actual symbol trades or in all others. Its configuration is very simple. Functions: Take profit: distance to TP (0 = disabled, no TP will be created).
Stop loss: distance to SL (0 = disabled, no SL will be created).
Price type: price type in pips or pipets/points (pips is common in Forex).
Actual symbol only: manage th
FREE
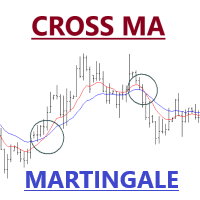
Expert Advisor of Cross two moving averages accompanied by stop loss, take profit, martingale and multi timeframes on each moving averages. You can change all the parameters contained in the moving averages
Please use as appropriate, hopefully can be useful and assist you in the transaction Don't forget to give a review if this product helps you
MA Method 0 = simple 1 = exponential 2 = smoothed 3 = LW
FREE

Sei stanco di perdere le tendenze di mercato redditizie? Vorresti avere uno strumento affidabile in grado di identificare le continuazioni del trend con precisione e accuratezza?
Non guardare oltre! Il nostro indicatore di continuazione del trend è qui per potenziare la tua strategia di trading e aiutarti a stare al passo con il gioco.
L'indicatore di continuazione del trend è un potente strumento, creato appositamente per assistere i trader nell'identificazione e nella conferma dei modelli d
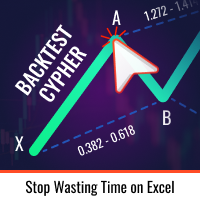
Non è mai stato così facile testare le tue idee di trading e vedere come si comportano sul mercato. Basta selezionare qualsiasi pattern "Cypher" dal passato con 4 clic sul tuo grafico, aggiungerlo alla lista di backtesting e voilà! Otterrai una completa analisi dei dati per ogni simbolo e timeframe.
Tutorial sulla strategia Cypher
Si prega di notare che il robot non funziona nel tester di strategia Selezione del pattern Cypher con soli 4 clic Regolazione automatica dei livelli di stop loss e ta
FREE

MT5 Gold Trader One – AI-Powered Algorithmic Trading for XAUUSD Gold Trader One is an AI-driven algorithmic trading strategy designed for MetaTrader 5. It has been optimized and rigorously backtested on XAUUSD (Gold) using the 1-hour timeframe from January 1, 2020, to December 31, 2024. It has also been forward-tested with the latest data to ensure reliability. Live Signal & Pricing Live Signal: Click Here to track real-time performance. (+13747 pips now) Introductory Price – First 5 Copies at $

The Big Mac B MQL5 expert advisor is a based off a Bollinger breakout strategy. The MACD indicator is used to confirm either a buy or sell trend. The MFI indicator to act as a trading range to ensure that the buy or sell is not activated when the price is in an overbought or oversold condition.
Trades will only be entered if the current price is within the trading range of the MFI indicator. Default settings are for the USDJPY on the 5 minute time-frame.
To work with the news server, you must a
FREE

This is a very simple multiple moving average indicator.
It can display 12 moving averages. The time axis of the moving averages can be changed in the input field of the indicator. The process is faster than the 12 moving averages included with MT5.
We also have a buffer set up so you can access it from an Expert Advisor. *For advanced users.
If you have any questions or requests, please message me.
Thank you.
MT4 Version: https://www.mql5.com/en/market/product/122857
FREE

Overview Auto TPSL is a sophisticated MetaTrader 5 Expert Advisor designed to revolut ionize how traders manage their risk and protect profits. This powerful tool automatically sets and adjusts Take Profit (TP) and Stop Loss (SL ) levels, eliminating emotional decision-making and ensuring disciplined trading practices. The EA operates through two core systems:
Auto TPSL System The Auto TPSL system automatically calculates and sets appropriate Take Profit and Stop Loss level
FREE

Benvenuti a HiperCube DonChian Codice sconto del 20% su Darwinex Zero: DWZ2328770MGM_20 Questo indicatore fornisce informazioni molto utili sul prezzo, mostrando quando il prezzo probabilmente salirà o scenderà.
Caratteristiche: Indicatore nelle finestre principali Personalizza i colori delle tue candele Personalizza il periodo dell'indicatore Imposta Off Imposta i parametri
Come interpretare: Trend rialzista: se alcune candele salgono dalla banda superiore, significa che è possibile che si s
FREE

40% off. Original price: $50
Ichimoku Trend Finder is a multi symbol multi timeframe trend dashboard that helps traders to monitor and identify potential market trends from one chart. This panel scans the Ichimoku Kinko Hyo indicator in 28 configurable instruments and 9 timeframes for classic Ichimoku trend signals with a deep scan feature to scan all market watch symbols (up to 1000 instruments!).
Download Demo here (Scans only M1 and M6) Settings description here MT4 version here

Magnified Price Experience trading like never before with our Magnified Price indicator by BokaroTraderFx , designed exclusively for MetaTrader 5. This revolutionary tool provides traders with instant insights into price movements, offering a clear advantage in today's fast-paced markets.
Key Features: 1. Real-time Precision: Instantly magnify price action to uncover hidden trends and patterns. 2. Enhanced Visibility: Clear visualization of price movements with adjustable zoom levels. 3. User
FREE

Este EA No funciona para Fundednext
Por el momento, tenemos que hacer las pruebas de lugar
--------------------- Nota 1 --------------------- Si tiene alguna duda. Telegram. @arisonzorrilla t.me/arisonzorrilla --------------------- Nota 2 ------------------- Solo Recomiendo US30.
--------------------- Nota 3 ------------------- RECOMENDADO Para la version DEMO y LIVE Por favor poner los parámetros que aparecen más abajo. ------------------------------------------------------
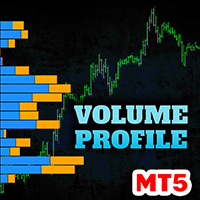
Contact me after payment to send you the user manual PDF file. Download the MT4 version here. Volume Profile Indicator A functional and useful tool that can improve your trading plan.
This indicator calculates volume in price levels(typical volume indicator shows only candle volumes).
With the volume of price levels, you can identify important areas that have the potential to reverse. You can also see the volume of support and resistance levels and decide on them.
Using volume profiles along
The "Cycle Extraction" indicator for MetaTrader 5 uses the Fast Fourier Transform (FFT) to discern cycles in financial time series. It facilitates the configuration of parameters such as the maximum number of bars, moving average settings, and specification of frequency thresholds, optimizing the analysis of repetitive market phenomena. Instructions Input Settings : Adjust variables such as Bar Count, Period, Method, and Applied to Price to customize the analysis to the user's needs. Data Visual
FREE

The VPS Sentinel Expert Advisor will be your ally to protect your trading capital and keep you updated of the status of your trading terminal (MT5) running on your remote VPS (Virtual Private Server). With the VPS Sentinel running on your terminal, you will have a first line of defence against any problem that could occur. You will also be able to: Define a Global Stop level (Stop-Out), decide if you want to receive notifications and also enable an automatic closing of working positions an
FREE

Displays a USD DXY chart in a seperate window below the main chart. YOUR BROKER MUST HAVE THESE SYMBOLS FOR THE INDICATOR TO WORK Based on EUR/USD, USD/JPY, GBP/USD, USD/CAD, USD/CHF and USD/SEK All these pairs must be added to Market Watch for the indicator to work correctly As this is calculated using a formula based on the 6 pairs it will only work when the market is open.
YOUR BROKER MUST HAVE THESE SYMBOLS FOR THE INDICATOR TO WORK
Displays a USD DXY chart in a seperate window below the m
FREE

Introduction to the Candle Time Indicator The Candle Time Indicator for MetaTrader 5, helps users know how much time on a candlestick is remaining.
Overview of Candle Time Indicator settings. TextColor: set the color of the countdown clock; FontSize: set the size of the font; Installation Guide Copy and paste the CandleTime.ex5 indicator files into the MQL5 folder of the Metatrader 5 trading platform. You can gain access to this folder by clicking the top menu options, that goes as follows: Fil
FREE

SWING EXCHANE BOT & SWING BOT Description
The bot is based of capturing the gains from fluctuation or swings, and exchange them in 4 pairs on 44 Exponential moving averages, period by allowing the orders to execute in differences between quoted prices in the market on open price. Also can be used without exchange and based only on fluctuations on the markets for any pair. Settings Swing bot exchange-Trading style (Arbitrage) (true/false)(Chosen in 4 pairs) Swing bot-Trading Style (Trend) (true
FREE

Se hai bisogno di un indicatore che mostri i punti di ingresso nel mercato, allora questo è il tuo indicatore.
L'indicatore non viene ridisegnato. Mostra i punti di acquisto e vendita per qualsiasi TF (intervallo di tempo) e qualsiasi coppia di valute. Le impostazioni sono regolabili per tutti gli strumenti. Puoi configurare ciascun parametro per qualsiasi broker, per qualsiasi account.
Questo è un CUSCINO comodo :)) Dai un'occhiata.....

Questo indicatore multi time frame e multi simbolo identifica formazioni alto/basso doppie o triple o un successivo breakout della scollatura (confermato alto/basso). Offre RSI, pin bar, engulfing, tweezer, filtri a stella del mattino/sera e opzioni di filtro di divergenza che consentono di filtrare solo le configurazioni più forti. L'indicatore può essere utilizzato anche in modalità grafico singolo. Si prega di leggere di più su questa opzione nel prodotto blog . Combinato con le tue
Get FREE Advanced Online Course and Learn About Our Advanced Trading System, Link in the Bio! Click Here. Our Mission and Vision: Why Am I Even Here? Here is The Deal Brother, We Offer:Premium Quality Indicators: The Highest Quality Possible Algorithms. Unlimited Activations: Can be used on Unlimited number of Computers, MT4s and MT5s for lifetime. Inexpensive Prices: 30$ is the lowest price possible, Knowing that more than 50% of our Indicators are 100% FREE.
But Why Am I telling You this?

The Supertrend Indicator for MT5 is a powerful trend-following tool designed to help traders identify market direction with precision. Based on the Average True Range (ATR), it dynamically adjusts to price movements, making it suitable for various trading styles, including scalping, day trading, and swing trading.
Key Features: • Accurate Trend Detection – Clearly identifies bullish and bearish trends with a color-coded trend line. • ATR-Based Volatility Adjustment – Adapts to market conditi
FREE

This Expert is using free indicator, please download BBMA MT5 here. This indicator use for exit strategy. Download BBMA and extract to folder MQL4/Indicators. Expert is using Nick Shawn Dollar Cost Averaging and Random Buy or Sell at new High or new Low of the trend. Very simple and effective, please remember to use lot size as small as possible. Example AutoLotDivide = 2000, you will have lot 0.01 each 1k of your balance. Or Just set manually at fixlot.
Backtest only for EU pair for now, pleas
FREE

The Magic LWMA indicator is of great help in determining trend direction. It can be an excellent addition to your existing strategy or the basis of a new one. We humans can make better decisions when we see better visually. So we designed it to show a different color for rising and falling trends. Everyone can customize this in the way that suits them best. By setting the Trend Period, we can optimize it for longer or shorter trends for our strategy. It is great for all time frames.
IF YOU NEE
FREE

Trade Sentiment or trade assistant is a MT5 Indicatior. That show buy or sell signal of different indicator to assist to take trades. That will help you to take right trades or to get confirmation for your trade. You don't need to have this indicators. Including indicators like RSI , STOCH , CCI. And the signals are Based on different Timeframes like 5M , 15H , 1H and 4H.
FREE

ATR Moving Average draws a moving average of the standard Average True Range( ATR ) in the same window.
Settings Name Description ATR period
Set Price per iod for ATR calculation
ATR level Set ATR value for thresholding( only whole number, ignore leading zeros e.g. 0.00089 = 89 ) MA Period Set moving Average Period MA Method Set moving average method( Simple, Exponential, Smoothed and Linear Weighted ) MA Shift
Set moving average shift
Enable Alerts ? Generate Alert when ATR crosses Moving
FREE

This powerful tool ensures you never miss important trading signals by providing instant Alerts whenever specific indicators generate signals. With its sleek and user-friendly interface, you can effortlessly stay on top of market opportunities. Once an alert is received, you have the flexibility to decide your next move, putting you in full control of your trading decisions.
Does not work in the Strategy Tester!
Indicator Alert Features Automatically get alerted when a chosen indicator produce
FREE
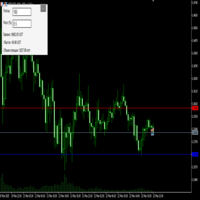
Преимущества и принцип работы индикатора "Risk end Lot Size Calculator" Преимущества : Простота использования :
Индикатор автоматически рассчитывает все необходимые параметры, вам нужно только ввести количество пипсов и риск.
Управление рисками :
Помогает определить, сколько вы можете потерять в сделке, и какой объем позиции (лот) выбрать, чтобы не превысить допустимый риск.
Визуализация :
На графике отображаются линии стоп-лосса для Buy и Sell, что позволяет быстро оценить уровни.
Удобство :
О
FREE

The indicator is based on the relationship between two sets of Stochastic lines. The first set consists of 6 Stochastic with periods: 5, 8, 10, 12, 14, 16. The second set consists of 6 Stochastic with periods: 34, 39, 44, 50, 55, 60. These periods are customizable. Input parameters Stochastic MA Method Method of calculation ===== Short-term ===== Stochastic #1 %K Period Stochastic #2 %K Period Stochastic #3 %K Period Stochastic #4 %K Period Stochastic #5 %K Period Stochastic #6 %K Period Short
FREE

OTTIMIZZA SU MENSILE O ANNO PRIMA DEL TEST E UTILIZZA PER I MIGLIORI INPUT
HFT Gold Scalper negozia XAU/USD ed è un trading a frequenza più alta il più possibile. Durante il test ha eseguito 6400 operazioni nel 2022 in 11 mesi, quindi opera attivamente. La più grande richiesta e lamentela è che un EA non commercia così spesso per le persone. Molti vogliono vedere i risultati giornalieri e non hanno pazienza per il trading a lungo termine. Questo EA è per quel commerciante. Gli input di ottimiz

Indicator to create and manage your own watchlists. It allows you to load one symbol to multiple charts with just one click.
There is an addon to save objects from drawings (lines, fibos etc.) and load when the symbol is changed.
Functions
Supports Multi-Timeframe-Usage
Load one symbols to multiple charts with just one click
Automatically created list with all tradeable symbols
Custom watchlists can be created
Symbols can be added and deleted from the created watchlists
Sortfunction to sort a

This EA offers features:
Stoploss (Risk Management), Take Profit (Money Management), Tralingstop and Tralling-Step (after candles), breakeven (strategy), partial sale (strategy), closing the order (strategy), Customizable settings:
1: magic number 2: Commentary 3: Risk, Riskmin and Riskmax 4: total orders 5: SL-(Strategy) 6: TP (true/false points) 7: Initial sale end Breakeven 8: Day positive end trading 9: day range 10: Trailing stop Normal end Intelligent (Candles strategy) 11: Trading Star
FREE

The VWAP Level indicator is a technical analysis tool that calculates the weighted average price for the traded volumes of a specific asset. The VWAP provides traders and investors with the average price of an asset over a specific time frame.
It is commonly used by investors to compare data on "passive" trading operations, such as pension funds and mutual funds, but also by traders who want to check if an asset has been bought or sold at a good market price.
To calculate the VWAP level we us
FREE

Menora (All In One) Indicator.
This is the advanced and premium indicator for the Magic Trend, a free indicator. It has 3 output signals driven by different market conditions. This indicator has a double function of working as an indicator and utility at the same time.
Specifications
1] 3 output signals a) Slow Moving Average with color change - The MA has a non-repaint color change, which makes it perfect for entry signals. b) Fast Moving Average (the original Magic Trend line) - Gives a
FREE

HiperCube Protector è qui! Codice sconto del 20% su Darwinex Zero: DWZ2328770MGM_20 HiperCube Protector è il limitatore di DrawDown più semplice e facile per ottenere il controllo del tuo account!, questo strumento mira a proteggere il tuo account in tempo reale, usa un drawdown massimo o un'impostazione StopLoss.
Caratteristiche: Controlla il DrawDown in percentuale o denaro, in base al saldo del tuo account Interfaccia amichevole ed elegante per vedere i dati in tempo reale Invia notifiche a
FREE
Get your hands on Immutable Trader and start making money in the markets with ease! Our innovative EA is powered by a smart algorithm that detects trends, filters out market noise, and places orders with pinpoint accuracy. You'll never have to worry about capital security again with our built-in Stop-Loss feature. And with 5 powerful indicators at your disposal - Directional Indicators, Stochastic, RSI, ADX and Bollinger Bands - you'll be able to confidently trade in any market condition. Get Im
FREE

Join Nexus Community Public Chat Stock Index Scalper is a short term scalping EA that trades Stock Indices exclusively. It will close all trades at end of day to avoid overnight risk and only consider opening new trades when there is an active market. Powered by the same AI engine that created Market Cycles Order Flow, Mito Velocity and Nexus Portfolio aka contrarian trading based on retail trader sentiment. It is designed for both scalper trader and long term trader who wants a long term stab

Remote Trade Copier is an advanced tool designed for efficiently copying trades between accounts in both local and remote modes. It allows for lightning-fast order replication from a master account to a slave account. In local mode, trades are copied instantly, while in remote mode, the copying process takes less than 1 second. Local mode refers to both MetaTrader platforms being installed on the same system, whereas remote mode enables copying between MetaTrader installations on sepa
FREE

This indicator sums up the difference between the sells aggression and the buys aggression that occurred in each Candle, graphically plotting the waves of accumulation of the aggression volumes. Through these waves an exponential average is calculated that indicates the direction of the business flow.
Note: This indicator DOES NOT WORK for Brokers and/or Markets WITHOUT the type of aggression (BUY or SELL). Be sure to try our Professional version with configurable features and alerts: Agre
FREE

This indicator draws the Parabolic SAR. Top and bottom lines with customizable colors. With an additional parameter called “Validate Signals”, which identifies false breakouts and changes the color of the line to gray.
Input Parameters: Step ( default is 0.02 ) Maximum ( default is 0.2 ) Applied Price High ( default is High price) Applied Price Low (default is Low price) Validate Signals (boolean value to filter out false breakouts, default is true)
FREE

MultiTrend Detector: System Overview The MultiTrend Detector is a comprehensive trend analysis tool that combines multiple technical indicators to identify trend direction, strength, and potential reversal points. Here's how the system works and how it can benefit traders: How the System Works Multiple Indicator Approach The system analyzes market trends using five key technical indicators: Supertrend: A volatility-based indicator that identifies the current trend direction and potential suppo
FREE

Orca EA ΜΤ5 è un Expert Advisor completamente automatizzato. Il suo algoritmo avanzato basato sull'azione dei prezzi sta cercando di prevedere la direzione della candela successiva e apre (o meno) il trade appropriato. Dispone di un numero unico di impostazioni che lo rendono estremamente versatile in tutte le condizioni di mercato. Orca EA ΜΤ5 viene fornito con file di set forniti per il 2025, appositamente ottimizzati per gli account ECN Raw Spread ICMarkets (server di fuso orario GMT+3
Session Bias This Strategy of bias useful for those who follow TRADESHARE on youtube. This script is designed by BokaroTraderFx for traders who want assistance in determining their session bias, particularly for those who trade within sessions typically represented by a single 4-hour candle. The method involves using price action to establish a daily bias, guiding decisions on whether to focus on buys, sells, or both. The analysis is based on the previous daily and 4-hour candle closes, fo
FREE
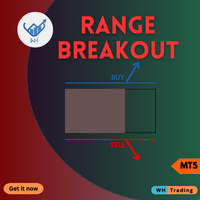
Sblocca una nuova dimensione del trading con il nostro indicatore MQL5 all'avanguardia, Range BreakOut MT5
Questo potente strumento è progettato per identificare e sfruttare i movimenti dei prezzi quando escono dagli intervalli stabiliti,
fornendoti la precisione e la sicurezza necessarie per prosperare nel dinamico mondo dei mercati finanziari.
Versione MT4 : WH Range BreakOut MT4
Caratteristiche:
Rilevamento accurato della portata. Segnali di breakout in tempo reale. Parametri personali

Trading the currency markets is a complex business, not least since we are dealing with pairs of currencies, and by inference, pairs of economies. All economies around the world are interlinked, and reflected in the constant ebb and flow of currency strength and weakness. The problem for us as traders is monitoring so many pairs simultaneously, since every pair does not move independently, but reflects the interrelated nature of this market.
The Quantum Currency Heatmap delivers the information

Historical Equity Flow Indicator (HEFI)
Description HEFI is an indicator for MetaTrader 5 that visualizes the dynamics of account balance and floating balance in real time. It helps traders analyze the historical effectiveness of their trading, as well as assess the current state of open positions.
What is it intended for?
Account balance tracking, taking into account closed transactions for the selected period.
Displaying a floating balance (balance + uncovered profits/losses).
Analysis o
FREE

CustomRSI50 - Indicatore RSI Personalizzato con Livello 50 Descrizione CustomRSI50 è un indicatore tecnico personalizzato basato sul popolare Relative Strength Index (RSI). Questo indicatore offre una visualizzazione chiara e personalizzabile dell'RSI, con un'enfasi particolare sul livello 50, cruciale per molti trader nell'analisi del momentum. Caratteristiche Principali Periodo RSI configurabile Livello di riferimento 50 evidenziato Tipo di prezzo applicato personalizzabile Visualizzazione in
FREE

10 copie rimaste a 49,55 Prezzo successivo $ 65,77
The Big Market Trader è lo strumento di assistenza al trading AI definitivo che può aiutarti a rimanere al passo con il mercato. È progettato con la migliore tecnologia e ha un tasso di risposta ad alta frequenza per un trading tempestivo.
È dotato di automazione AI dinamica, che vedremo presto. Abbiamo un sistema di gestione del rischio avanzato. Opzione Equity Stop, sistema trailing stop, tecnologia time stop e spread utilizzata dai trader d
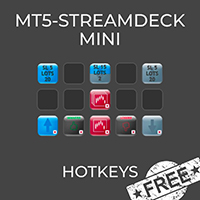
MT5 Streamdeck Mini is a free reduced version of the MT5- Stream Deck Expert advisor
MT5-StreamDeck offers the possibility to use a certain number of pre-programmed Hot-keys with a clearly defined role. So by the push of a button you can open a trade with a pre-defined lot size, stoploss and take profit. Close all your trades, close the ones in profit, or in loss, (set Break-even or set a trailing stop-ONLY IN FULL VERSION) All this with a Hot key button. See the feature list for all the actio
FREE

Indicator "Fair Value Gap" (FVG) - Scopri il Potere delle Aree di Sbilanciamento nel Mercato Il mondo del trading è pieno di opportunità nascoste, ma solo chi ha gli strumenti giusti può identificarle e sfruttarle al meglio. Il nostro Indicatore FVG è stato progettato per aiutarti a fare proprio questo. Se sei un trader che cerca di migliorare la sua capacità di leggere il mercato e di trovare i migliori punti di ingresso e uscita, l'Indicatore FVG è l'alleato perfetto per te. Cos'è un Fair Valu

The technical indicator Trend Strength Analyzer measures the deviation of the price of an instrument from average values over a specific period of time. A comparative analysis of the relative strength of bulls and bears underlies the indicator. If bulls prevail, an upward trend. If bears are stronger - a downward trend.
Settings:
Strike Energy (2 solid lines) = 14.
Influence Power (2 dotted lines) = 50. The TSA oscillator is effective in an active market. The most commonly used indicator
FREE

The TradeQL Indicator is a customizable tool that highlights specific trading patterns on candlestick charts. Users can define patterns through TradeQL queries, which the indicator then applies to the chart, visually representing matches and captured groups. Ideal for identifying complex trade setups in real-time.
TradeQL queries are specified using the TradeQL Language. See https://github.com/abdielou/tradeql for more details. This language is expressed as a regular expression. The language al
FREE

Attempts to recover losing trades.
If a trade moves in the wrong direction, the Zone Recovery algorithm begins.
An alternating series of Buy and Sell trades at two specific levels take place, with two Exit Points above and beyond these levels.
Once either of the two exit points is reached, all trades close with a combined profit or break even.
To use
1) Place the EA on a chart and select how the first trade will open (Manual/Via EA strategy/Use EA panel/External EA)
2) Configure your recovery
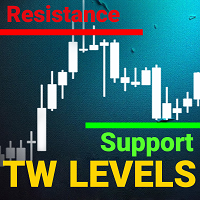
support resistance levels indicator mt5:
Questo strumento è un indicatore multi-timeframe che identifica e traccia le linee di supporto e resistenza, così come i livelli di Fibonacci, su un grafico con la stessa precisione dell'occhio umano. I livelli di supporto e resistenza TW per il forex hanno un algoritmo complesso che scansiona il grafico per identificare i precedenti livelli di stabilizzazione dei prezzi e rimbalzi, registrando il numero di tocchi.
Sei stanco di disegnare manualmente i

The Prospector Scalper EA is a fully automated Expert Advisor that scalps during high volatility periods using a hybrid lot multiplication algorithm. The EA trades using market orders and hides its decision making from the broker. This EA will work on any pair but works best on EURUSD and USDJPY on the M5 timeframe. A VPS is advisable when trading this system. Check the comments for back test results and optimized settings. Please note: I have made the decision to give this EA away and many more
FREE

Trend Reversal alert: The concept of the EA is to give you a message/alert when something happens in the market, so you will never pass a tradechance for a trendreversaltrade. The EA give you the message when the chance is higher for a trendreversal, but it is important to say that this doesn`t mean that you should trade every signal. The advantage provided by the program is that you don`t need to sit the hole time for the PC and look at the chart because you get a message when a good trendrever
FREE
Il MetaTrader Market offre un luogo pratico e sicuro dove acquistare applicazioni per la piattaforma MetaTrader. Scarica versioni demo gratuite di Expert Advisors e indicatori direttamente dal tuo terminale e testali nello Strategy Tester.
Prova le applicazioni in diverse modalità per monitorare le prestazioni ed effettuare pagamenti per i prodotti desiderati, utilizzando il sistema di pagamento MQL5.community.
Ti stai perdendo delle opportunità di trading:
- App di trading gratuite
- Oltre 8.000 segnali per il copy trading
- Notizie economiche per esplorare i mercati finanziari
Registrazione
Accedi
Se non hai un account, registrati
Consenti l'uso dei cookie per accedere al sito MQL5.com.
Abilita le impostazioni necessarie nel browser, altrimenti non sarà possibile accedere.