YouTubeにあるマーケットチュートリアルビデオをご覧ください
ロボットや指標を購入する
仮想ホスティングで
EAを実行
EAを実行
ロボットや指標を購入前にテストする
マーケットで収入を得る
販売のためにプロダクトをプレゼンテーションする方法
MetaTrader 5のためのエキスパートアドバイザーとインディケータ - 24

This indicator implements the logic behind Traders Dynamic Index to the classic MACD Indicator. It helps to find powerful trende changes and ignore meaningless ones. It is simply the classic MACD indicator plotted with volatility bands on top designed with the sole purpose of being able to ignore trend changes that do not follow an over-extension or over-contraction of the market. The indicator alerts on trend changes after the volatility bands have been breached and implements alerts of all ki
FREE

You get a moving average indicator with different methods (exponential, linear, smoothed and linear weighted) calculated on smooth Heikin Ashi candles included in 'Examples' folder of Meta Trader 5. This program is dedicated for everyone trader in the market who is collecting necessary indicators designed for work with reduced market noise to better identify trends and buy opportunity.
FREE

Simple ATR (Average True Range) Channel to find your Stop Loss and/or Take Profit. Indicator allows to draw a second multiplier if you need different values for SL and TP. Leave the second multiplier to 0 if not used.
Settings + Length
+ Smoothing
+ Multiplier #1 (default 1.5)
+ Multiplier #2 (set to 0 if not used)
+ High price
+ Low price
+ show price line
+ colors can be changed
Please leave wishes in the comments. Reviews are also welcome.
FREE

Grammy — is: Instant messages to your Telegram on any trade events , Commands to control all your terminals from one Telegram chat, Price alerts (crossing horizontal or trend lines), Daily, weekly and monthly reports . You can't test this utility in the Strategy Tester.
Please, contact me to get your free demo version. Why is Grammy better : Fully customizable messages templates , Emoji and "smart" substitution to the messages, Commands to control all your terminals from Te

It is the MQL5 version of zero lag MACD that was available for MT4 here: https://www.mql5.com/en/code/9993 Also there was a colored version of it here but it had some problems: https://www.mql5.com/en/code/8703 I fixed the MT4 version which has 95 lines of code. It took me 5 days to write the MT5 version.(reading the logs and testing multiple times and finding out the difference of MT5 and MT4!) My first MQL5 version of this indicator had 400 lines of code but I optimized my own code again and n
FREE

Sunは EURUSD M1 用に設計されたアグレッシブなマルチサイクルスキャルパーです。
各サイクルは独立しています。それは注文のシーケンスを使用し、独自のTPとSLを持っています。このEAはマーチンゲールシステムを使用しています。
このEAは、ポジションを取るために過去の強い再帰を使用しており、高い成功率を達成しています。 事前に ブログ記事 を読んでおくことはとても重要です。 最低入金額は100ドルで、レバレッジは1:500です。オートロットシステムが搭載されています。
低スプレッドで高速なVPSを備えた1:500のECNアカウントを使用することをお勧めします。
このEAは正常に動作するために、チャートあたり少なくとも1000MB(1GB)の空きRAMを必要とします。 セットアップ・設定ファイル : https://www.mql5.com/en/blogs/post/747168 信号: https://www.mql5.com/en/users/myxx/seller Sun ペア: Sun (EURUSD): https://www.mql5.com/en

このライブラリは、できるだけ簡単にMetaTrader上で直接OpenAIのAPIを使用するための手段として提供されます。 ライブラリの機能についてさらに詳しく知るには、次の記事をお読みください: https://www.mql5.com/en/blogs/post/756098 The files needed to use the library can be found here: Manual 重要:EAを使用するには、OpenAI APIへのアクセスを許可するために、次のURLを追加する必要があります 添付画像に示されているように ライブラリを使用するには、次のリンクで見つけることができる次のヘッダーを含める必要があります: https://www.mql5.com/en/blogs/post/756108
#import "StormWaveOpenAI.ex5" COpenAI *iOpenAI(string); CMessages *iMessages(void); CTools *iTools(void); #import これが、ライブラリを簡単に使用するた

Hi. I guess you came to this page hoping you might find an EA you can trust!
If so, give me your attention. CPT is a shortcut for three words. a name that explains a purpose.
I will tell you a little story about why I created this EA...
Get the standard edition CPT Standard MT5 . Get the MT4 version CPT Standard MT4 . Subscribe to the public channel for the last important news and updates.
Years ago, I passed from the phase of losing every account I opened to the phase of... Let's

[ZhiBiDW Trend]は、トレンドとショックのシンプルで直感的で効果的な指標です。 これは、15分以上4時間未満のチャート期間に適しており、すべての市場の種類に適しています。
買いシグナル:青い上向き矢印が表示され、その矢印にストップロスとテイクプロフィットのプリセット価格が表示されます。
売りシグナル:赤の下向き矢印が表示され、矢印がストップロスとテイクプロフィットのプリセット価格と共に表示されます。
パラメータ設定の説明
[Send_Alert]:これはアラームスイッチで、trueに設定されていて、矢印が表示されていれば自動的にプロンプトに警告し、falseに設定されていれば警告しません。 [Send_Email]:これはメールを送信するためのスイッチで、trueに設定します。矢印が表示されればMT4で設定したメールボックスにメールを送信し、falseに設定されたらメールを送信しません。 [Send_Notification]:インスタントメッセージを送信するためのスイッチで、trueに設定します矢印が表示されている場合はモバイルデバイスにメッセージを送信し
FREE

The Hybrid Stochastic indicator is a Stochastic RSI described by the famous Tushar Chande and Stanley Kroll in their book called " The New Technical Trader" . The main goal of this indicator is to generate more Overbought and Oversold signals than the traditional Relative Strength indicator (RSI). Combining these 2 indicators expands the range of the overbought and oversold territory. The idea behind it is to use the Stochastic formula over RSI values. If you want to know more about its internal
FREE

Trade Informer HVZ is a utility that allows you to display trading results (open and closed positions) using filters for trading instruments and Magic Numbers of Expert Advisors. The results are displayed as a horizontal or vertical table or as separate blocks. Full list of displayed parameters:
List of analyzed instruments List of Magic Balance of open positions Result of closed positions for today The result of closed positions for the previous day
The result of closed positions for the

VR ティックは、 スキャルピングベースの戦略のための特別なインジケーターです。このインジケーターのおかげで、トレーダーは金融商品のメインチャート上でティックチャートを直接見ることができます。ティック チャートを使用すると、できるだけ正確に市場にポジションを入力したり、市場でポジションを決済したりできます。 VR Ticks は、方向に応じて色が変わる線の形で目盛りデータをプロットします。これにより、目盛りの状況を視覚的に理解し、評価することができます。ティック チャートの利点は、時間枠を考慮せず、価格の変化に基づいて構築されることです。 VR Ticks は可能な限り最小限のチャートを作成します。 設定、設定ファイル、デモ版、説明書、問題解決方法は [ブログ] でご覧いただけます
[リンク] でレビューを読んだり書いたりできます。
[MetaTrader 4] のバージョン ティックは 1 つの値動きです。 1 つの価格変動に対して、価格は 1 ポイントまたは数ポイント変化する可能性があります。 ティックは動きである ことを理解することが重要です。 このインジケーターには、右下に
FREE

This is a multi-currency Expert Advisor with an intelligent order opening function, a news filter and dynamic drawdown control.
The Expert Advisor analyzes the price of each candle and its dynamic deviation in the flow of quotes and makes a decision only when the candle closes. A series of orders is closed only when a positive result is achieved.
A system of algorithms is used in combination with risk control technology to reduce account drawdown. Champion EA is suitable for beginners and

Hello, I would like to tell you a little bit about EA. Before the EA opens an order, it measures the volume strength. If the volume is set, the EA will open the 1st order and can increase the open order by using MaxOrder function, will make your profit grow enormously. However It depends on the number of Maxlots that the broker can open as well. You can optimize to get the best settings for this EA. I may be miscommunicating some things. Because I don't speak English very well. I'm sorry . Thank

Daily session open lines shows the traders three important trading session opens. By default it is set up to show you: Zero GMT Open Line London Open Session Line New York Open Session Line The default times are set according to GMT+2 and as such you are able to change and customise according to your specific time zone. The Indicator is usefull specially for the trader who trades the London and NewYork sessions.
FREE

この指標を使用すると、日中の範囲のローカルトレンドの強さに対する価格変化のダイナミクスを追跡することができます 推薦された期間:M5-H1 価格チャネルPROインジケータは再描画されず、レベルは変更されません 指標を使用した取引は非常に簡単です
販売取引を開くには、方法:
1. 新しい現地価格の最大値を待ちます 2. 価格はチャネルの中央にロールバックする必要があります(緑色の線) 3. 新しいろうそくの販売マークを開く 4. ストップロスをチャンネルの上限より上に設定します(青い線) 5. 価格が反転してローカル最小値が更新されたら、収益性の高いゾーンの注文を閉じます
購入取引を開く方法:
1. 新しいローカル最低価格を待ちます 2. 価格はチャネルの中央にロールバックする必要があります(緑色の線) 3. 新しいキャンドルの購入トラックを開きます 4. チャンネルの下の境界線(赤い線)の下にストップロスを設定します。 5. 価格が反転してローカルの最大値が更新されたら、収益性の高いゾーンの注文を閉じます
Price Channel PRO指標を他
FREE

CommunityPower EA — is the Expert Advisor for MetaTrader 4/5, created by community and for community. It is free, versatile and very powerful, and allows to trade a wide range of strategies. The idea is simple Your suggestions + my code = a win-win for everyone!
Is it a ready-to-use money-making machine? No, it is definitely not. It is a tool, which allows you to create and run your own trading strategy, and it is up to you to find profitable settings and take the responsibility for your tr
FREE

Dedicated for FTMO and other Prop Firms Challenges 2020-2023
Trade only GOOD and checked PROP FIRMS Default parameters for Challenge $100,000 Best results on GOLD and US100 Use any Time Frame Close all deals and Auto-trading before US HIGH NEWS, reopen 2 minutes after
Close all deals and Auto-trading before Weekend at 12:00 GMT+3 Friday Recommended time to trade 09:00-21:00 GMT+3 For Prop Firms MUST use special Protector https://www.mql5.com/en/market/product/94362 ------------------
Trade donchian breakouts with complete freedom. This EA can trade any breakout period, any timeframe, with pending or market orders- as desired- and implements many other useful features for the exigent trader, like customizable trading sessions and week days, a martingale mode and inverse martingale mode. [ Installation Guide | Update Guide | Troubleshooting | FAQ | All Products ] Easy to use and supervise Customizable trading direction Customizable donchian breakout period It can trade using
FREE

This is actually just a combination of 3 classic TTM_Squeeze indicators, nothing special. As I know exactly this is implemented in original TTM_Squeeze PRO indicator. It shows strong, middle and weak squeeze. If someone interested, TTM_Squeeze is not completely John Carter's invention. Concept of squeeze is commonly known as well as the method of squeeze search using Bollinger Bands and Kelthner Channels. How to use
As always there is a lot of variations. For example here is simple strategy Us
FREE

The ICT Concepts indicator regroups core concepts highlighted by trader and educator "The Inner Circle Trader" (ICT) into an all-in-one toolkit. Features include Market Structure (MSS & BOS), Order Blocks, Imbalances, Buyside/Sellside Liquidity, Displacements, ICT Killzones, and New Week/Day Opening Gaps. It’s one kind of Smart money concepts. USAGE: Please read this document ! DETAILS Market Structure Market structure labels are constructed from price breaking a prior extreme point. T

Description: Strategy based around Open-Close Crossovers. Setup: I have generally found that setting the strategy resolution to 3-4x that of the chart you are viewing tends to yield the best results, regardless of which MA option you may choose (if any) BUT can cause a lot of false positives - be aware of this. Don't aim for perfection. Just aim to get a reasonably snug fit with the O-C band, with good runs of green && red. Option to either use basic open && close series data or pick your pois
FREE
This EA finds technical analysis patterns that often appear before a trend reversal: Double Bottom, Triple Bottom, Head and Shoulders and their opposite counterparts. The Expert Advisor is able to identify them on the chart of a currency pair and trade when the pattern has been formed and it has been broken through. Also, in order to trade excluding unnecessary signals (for example, with weak volatility), you can adjust and optimize the readings of some indicators (Stochastic, ADX) and the filte

Market Cycle and Trading Sessions Indicator
Introducing our Market Cycle and Trading Sessions Indicator, a tool designed to provide you with a comprehensive view of the financial market like never before. Observe the market's pulse with our exclusive indicator. Gain a deep understanding of market phases, from accumulation to distribution, to make informed, strategic decisions with a high probability.
What makes our indicator?
1. Date Range for Calculations: Customize the start and end da
FREE

MomoPointsは、チャート上にロングとショートのエントリー/追加ポイントを表示するインジケーターです。
MomoPoints は、勢いとトレンドの強さに基づいて、リスク対報酬の比率が良好なエントリー/追加を表示します。
設定
----------------------------------
デザイン: 信号の色、サイズ、ウィングディング (グラフィック シンボル) を調整できます。
シグナル設定: 移動平均期間、トレンドの強さ、移動平均から価格までの距離、RSI期間を設定できます。
信号値をコメントとして表示して、資産に正しい値を設定できます。また、インジケーターはあらゆる取引ペアまたは資産に適合します。
適切なエントリを表示するには、すべてのアセットに独自の設定が必要です。特定のペアの設定が必要で、自分でそれを見つけることができない場合は、私がお手伝いします。
アラーム:プッシュ通知とサウンド音声アラートを有効にすることができます。
シグナルはリアルタイムで発生し、再描画は必要ありません
ご質問や追加情報や機能
FREE

The ICT Silver Bullet indicator is inspired from the lectures of "The Inner Circle Trader" (ICT) and highlights the Silver Bullet (SB) window which is a specific 1-hour interval where a Fair Value Gap (FVG) pattern can be formed. A detail document about ICT Silver Bullet here . There are 3 different Silver Bullet windows (New York local time):
The London Open Silver Bullet (3 AM — 4 AM ~ 03:00 — 04:00)
The AM Session Silver Bullet (10 AM — 11 AM ~ 10:00 — 11:00)
The PM Session Silver Bulle

ICT Kill zone and Macros Indicator mark and display the following zone times on the chart: Kill zones Kill zone Forex Asian
London Open New York Open London Close Central Bank Dealing range
Kill zone Indices Asian London Open New York AM New York Lunch New York PM Power Hour
Macros London 1 London 2 New York Am 1 New York AM 2 New York Lunch New York PM 1 New York PM 2
Silver bullet London Open New York AM New York PM
Sessions Asian London New York
Chart The display of Kill zone ,

I'm sure after a lot of research on the internet, you haven't found any indicator that can help you with forex or binary trading in the latest probability strategy created by famous trader Ronald Cutrim. The strategy is based on a simple count of green and red candles, checking for a numerical imbalance between them over a certain period of time on an investment market chart. If this imbalance is confirmed and is equal to or greater than 16%, according to trader Ronald Cutrim, creator of the pro
FREE

The provided code is an example of an Expert Advisor (EA) written in MQL5, a programming language used for creating algorithmic trading systems in MetaTrader 5. Here is a breakdown of the code:
The code begins with various input parameters and settings defined using the input keyword. These parameters allow customization of the EA's behavior, such as entry lots, stop loss, take profit, and indicator parameters.
Several constant values and variables are declared, including session time setti
FREE

指標は、毎日現状の傾向や目標を示す。 また、インジケーターは市場状況の正しい定義をカウントするため、損失決定の取引回数を減らす。 一日で分析や取引を行うように設計。
使い方
ブルーラインは、当日の目標を定めた専用4行公式にセットした当日のオープン価格を表示。 トレンドに向かって、オープンな取引ができます。
グレーのラインが先制点。 これらの水準のコストで辿り着いたら、ポジションの一部を閉鎖して取引を守るのがベストだ。 こうした価格ゾーンでは、トレンド取引のオープンに十分注意できます。
1046年代、「妄想」が最終的な目標である。 そのレベルに価格が近づくと、ボリュームの大半を閉じて取引を守ったり、トレンド取引を完全に締めたりする価値があります。 これらの分野では傾向を取るのは推奨されていない。
1046年代:「雄蕊はかなり長い道のりを抜けることができるが、滅多にない。 ボーナス増益です。
鳩ゾーンの価格を1日以内に到達すると、上記のすべてを繰り返すことができる。
取引が開くと、インジケーターが左上隅でどのようなアドバイスをするのかを見てみよう。 指標との取引
FREE

XXXX ATR (Average True Range) Position Manager: ATR StopLoss, ATR Target, ATR Breakeven, ATR Trailing StopLoss, with Risk % Calculation / Position.
Fully automated advanced ATR EA is now available:
https://www.mql5.com/en/market/product/94895
Key takeaways One click does it all: SELL and BUY button automatically places ATR stoploss, ATR target, ATR breakeven, ATR trailing stop and Risk % calculation of equity Entire position is calculated based on ATR No more manual position calculati
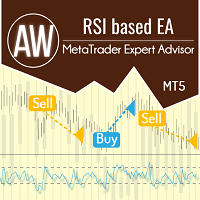
EA は、売られすぎまたは買われすぎの状態からの価格リターンで取引し、RSI オシレーターからシグナルを受信するとポジションを開きます。システムには多くのシナリオと柔軟な構成があります。平均化、最初と最後のバスケット注文をクローズする機能、および自動ロット計算機能を使用します。高度なダッシュボードと 3 種類の通知があります。 問題解決 -> こちら / MT4版 -> こちら / 説明書 -> ここ 利点:
簡単なセットアップと直感的なパネル インターフェイス 構成可能なインジケータ信号 あらゆる種類の商品とあらゆる時間枠に適しています 必要に応じて平均化を使用 組み込みの自動ロット計算 最初と最後のバスケット注文を閉じるための組み込みシステム 3 種類の通知: プッシュ、メール、アラート ストラテジー: EA は、売られ過ぎまたは買われ過ぎの状態からの価格リターンで取引し、RSI オシレーターからシグナルを受信するとポジションを開きます。 取引動作のさまざまなオプションを実装します: オシレーターラインが下から上に下のレベルを突破した場合、取引を購入し

Worried about weekend price crashes wiping your account? Tired of adverse news releases stopping your positions? Trade with peace of mind with Smart Hedge.
Smart Hedge protects your positions from weekend gaps and news spikes. MT4 version: https://www.mql5.com/en/market/product/113290
Description : Have you ever feared that some breaking news during the weekend could wipe your account? Did you ever have your positions stopped by an adverse news release during the market open hours? I did, a

Welcome to the presentation of the AI Channel indicator, a powerful tool that uses artificial intelligence for price channel analysis in the financial market. In this session, we will explore how this revolutionary indicator can assist investors and traders in making more informed and strategic decisions. Let's get started! I. What is the AI Channel indicator? AI Channel is an indicator developed based on advanced artificial intelligence algorithms. It utilizes historical price data of financial
FREE

TILLSON MOVING AVERAGE Also known as TMA or T3 indicator. It is a moving average that uses EMA and DEMA in its formula and is calculated with the 3rd degree Binomial expansion. ... int handle1; //Handle of the Tillson TMA T3.EX5 custom indicator double euBuff1[]; int TMAperiod= 12 ; int TMSshift= 0 ; double VolumeFactor= 0.618 ; int OnInit () { ... handle1= iCustom ( NULL , PERIOD_CURRENT , "Market\\Tillson TMA T3.EX5" ,0,TMAperiod,0,0,TMSshift,0,0,Vol
FREE
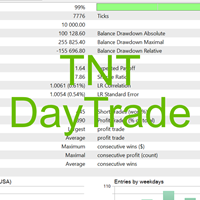
This EA is the EA I am developing in my series on youtube called developing a daytrader. With every new video this EA is going to be updated.
Always use the set files I published in the comment section
Check it out here: https://www.youtube.com/watch?v=Hqe8HNum7_k&list=PLnPDvgMHrRiCxOqcsG8eADXOovmEvWssp Download the set files from here: https://www.mql5.com/en/market/product/117263?source=Site+Profile#!tab=comments&comment=53384111
Introducing TNT DayTrader EA – your reliable, safe, and

PREDICTOR MASTER(プレディクターマスター):
商品紹介:Predictor Master エキスパートアドバイザー
Predictor Master エキスパートアドバイザーは、効率的かつ精度の高い金融市場での取引を目指した先進の自動取引システムです。この強力なEAは、カスタム指標とインテリジェントな戦略の組み合わせを活用して、収益性の高い取引機会を追求します。
カスタム指標「Predictor」: Predictor Masterの中心は、革新的なカスタム指標である「Predictor(プレディクター)」です。この指標は、過去の市場パターンから学習する最新のニューラルネットワークによって駆動されています。上昇トレンド(bull)と下降トレンド(bear)の情報を使用することで、Predictor Masterは将来の市場方向をより確率的に特定し、正確なエントリーや出口のシグナルを提供します。
サポート&レジスタンス戦略とオーダーグリッド: Predictor Masterは、サポートとレジスタンスに基づく戦略を採用し、取引のエントリーポイントと出口ポ
FREE

LSTM ForexAlpha is an advanced trading Expert Advisor (EA) that uses LSTM (Long Short-Term Memory) artificial intelligence to optimize market operations. This bot has been trained on several years of historical data to adapt to all market trends, ensuring continuous adjustment to current market conditions. Key Features: LSTM Intelligence : We use LSTM neural networks to analyze and predict market movements. LSTMs are designed to handle data sequences and store long-term relevant information, mak

INFOPadはMetaTrader 5ターミナルで選択された通貨ペアに関する情報を作成する情報パネルです。 この指標には5つの機能があります。 選択したシンボルの主および主な情報を表示します。売値、スプレッド、ストップレベル、スワップ、ティック値、コミッション価格。 SL目標とTP目標(確立されたストップロスとテイクプロフィットのポイント数、ドル額)の将来の目標を示します。 今日、週、月、年、選択した通貨の総利益などの期間に受け取った利益が表示されます。 それは現在のオープンポジション、そのロット(ボリューム)、ポジション数、ポイントでのポジションの利益、ドル、パーセントを表示します。 オープンディールのチャートに追加情報を表示します。それはストップロスを示し、利益レベルとこれらのストップレベルの目標を取ります。 トランザクションがシンボルに対して開かれたとき、トランザクションが閉じられたとき、トランザクションが変更されたときに、ログファイルに情報を書き込みます。 取引の開始時、取引の終了時、取引の変更時にサウンドファイルを再生します。 トランザクションを開くとき、トランザクション
FREE

This is a simple and very effective utility for closing orders with one click. You will need it if you have a number of open orders on your balance and it takes too long to close them manually, which might lead to an extra loss of money on the account. The utility consists of an external panel with two buttons " Close by Filter" and " Close ALL" , which is convenient to move around the graph. You can set the Close ALL utility so that orders are closed as soon as the specified profit or loss va

The FXTT Trendline EA for MT5 is a robot that helps you trade using the trendlines drawn on your chart. It basically allows you to set pending orders using trend lines . Something that Metatrader does not allow you to do by default. Easy to set up Choose default Lot size , Stop Loss and Take Profit Allows action on Touch, Pullback, Breakout or False Breakout of trendline The usage and configuration of the Expert Advisor is as follows: Load the EA Draw your trendlines on the chart Add Buy or Sell

SUPER SALE! --> -50% OFF + BONUS EA: NEWS Scope EA PRO with AMAZING results! NOTE: Promo price: $247 ( Regular Price: $487) - The offer ends today! Click here to check News Scope EA PRO results and learn more about the promotion! For Settings, Instructions and LIVE Results Click Here! Forex Trend Detector is an automated trading strategy which is developed to follow the money… or "follow the market impulse" resulting in reliable and consistent performance. I built Forex Trend Detector on a tr
Unlock the power of synchronized chart analysis with Chart Sync, your ultimate solution for harmonizing technical objects across multiple charts on the same trading symbol,
ChartsSync Pro MT5 is a groundbreaking MetaTrader 5 utility designed to streamline your trading workflow, enhance analysis precision, and amplify your trading decisions.
Features:
Effortless Object Synchronization.
Multi-Chart Harmony.
User-Friendly Interface.
Real-Time Updates.
Sync Objects Color,Width and Style.
FREE

MAFiA Scalper -Bill Williams (BW) expert advisor with a control panel for trading.
!!! Advisor will work ONLY on accounts like HEDGE . The type of account can be seen in the upper left corner of the terminal. Example - there
Detailed instructions with illustrations in English, in PDF file format.
- You will find a link to the instruction under the video
- The video is in Russian, but you can turn on subtitles and choose the translation into your language.
The main task of the advise

This indicator displays Point & Figure charts (PnF charts) in the indicator window. PnF charts show only price movements that are bigger than the specified box size. It helps to eliminate noise and allows focusing on main trends. Time is not a factor here. Only price movements are taken into account. That is why PnF chart is not synchronized with the main chart it is attached to. More about PnF charts: http://stockcharts.com/school/doku.php?id=chart_school:chart_analysis:pnf_charts Indicator wor
FREE

Ronal Cutrim has been a dedicated mathematician for 14 years and has more than 10 years of experience in the financial market.
The concept of the theory is simple, find imbalance between buyers and sellers. Which makes a lot of sense, because nothing goes up forever, nothing falls forever. When you find an asset with a mathematical probability of unbalanced equilibrium, it is a great way to get into trading: TUTORIAL: Turn on the subtitles, the video is subtitled

Master Nasdaq FTMO MT5 is a very accurate expert advisor for Nasdaq/ US100/ USTEC/ NAS100/ NDX index. This EA is designed with MACD divergence, RSI divergence, RSI, Moving Average, and other secret indicator/ method for entry position. This EA is a single entry method use stop loss and take profit with ATR.
Propfirm & FTMO no longer supported, I am sorry about that.
This EA has been rigorously tested at several backtest levels, but past results do not guarantee future results. Please do y

You can see Binance Spot data instantly in Metatrader 5 and it allows you to use all the features that Metatrader has provided to you. You can access the data of all symbols listed on Binance Futures. Don't forget to set the timezone. Binance it's 00:00 UTC. You need to fix it according to your own country You need to install the free Binance Spot Symbol List plugin. https://www.mql5.com/tr/market/product/83507 After loading, it automatically downloads the data of the cryptos in the market obser

A simple panel to help you to place orders on the chart using the mouse. Hold Left Shift or Left Ctrl and the panel will show the lines where it will place the order already with stop loss and take profit. Use Shift to place buy orders and Ctrl to place sell orders, the panel will switch between stop or limit orders depending if the mouse is above or below the price. Please be aware that Ctrl key is used by Metatrader to copy an object, try to avoid using this panel with charts where you copy ob

MACD divergence signals MACD is called Convergence and Divergence Moving Average, which is developed from the double exponential moving average. The fast exponential moving average (EMA12) is subtracted from the slow exponential moving average (EMA26) to get the fast DIF, and then 2× (Express DIF-DIF's 9-day weighted moving average DEA) Get the MACD bar. The meaning of MACD is basically the same as the double moving average, that is, the dispersion and aggregation of the fast and slow moving a

Description: The indicator of tick volumes Better Volume MT5 allows you to assess the general mood of the market and quite accurately catch the moments of the formation of large movements. The indicator is a color histogram in an additional window. In the calculation of Better Volume MT5 the Price Action combinations are taken into account, the values of the volumes with the height of columns and color marking are displayed. Input parameters: MAPeriod - period for calculating the moving average

RTS5Pattern-touch-mouse -EN is a revolutionary statistical indicator designed for the MetaTrader 5 platform, bringing an innovative approach to technical analysis and market movement prediction. This indicator combines advanced mathematical methods, including normalization and historical data analysis, with a user-friendly interface and precise trading capabilities. RTS5Pattern-touch-mouse -EN is an ideal tool for traders looking to improve their trading strategies and achieve better results.
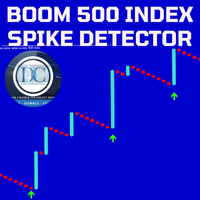
Our Spike Detector is specifically engineered to cater to the unique needs of traders in the Boom and Crash indices markets. This tool is optimized for M1 (1-minute) and M5 (5-minute) timeframes, ensuring you receive timely and actionable insights.
Key Features:
1. Non-Repainting**: Our detector guarantees accuracy with non-repainting signals, ensuring your data remains consistent and reliable. 2. Push Notifications**: Stay updated with real-time push notifications, so you never miss a cr

OPTMIISE THE EA BEFORE TEST AND USE. Gold Rush 15 is an Expert Advisor (EA) designed for trading the XAU/USD currency pair on 15-minute charts. This EA is programmed to identify and take advantage of trends in the XAU/USD market, which involves trading the value of gold (XAU) against the US dollar (USD). The primary objective of Gold Rush 15 is to automate trading decisions based on a predefined set of rules and algorithms. It continuously monitors the price movement of XAU/USD on 15-minute time

This indicator Displays current spread in the main window of the chart. You can modify the font parameters, indicator's position and the normalization of the spread value. The spread is redrawn after each tick, ensuring the most current and active spread value. This can be useful for brokers with variable spreads or with spreads that are widened often. You can also enable a spread label to be shown near the current Bid line. you can also set alert : Email, and push notifications.

To download MT4 version please click here . - This is the exact conversion from TradingView: "Linear Regression Candles" By "ugurvu". - The overall look of the indicator is like Heiken Ashi. - It can be used as a trend confirmation indicator to detect the right trend direction. - This indicator lets you read the buffers for Candles' OHLC. - This is a non-repaint and light processing load indicator - You can message in private chat for further changes you need. Thanks

The Spots Expert Advisor is the automated trading bot was created using the Spots indicator based on the common candlestick patterns such as: engulfing, hanging man, doji etc. The main objective for creating this EA is to have a fully automated and low drawdown bot. I'm sharing the first set file on the website, please feel free to optimize it for other pairs and with your forex broker using the preset parameters.
Risk Calculator is a panel for order size calculation according to stop loss and allowed risk per trade. The calculation is performed for the symbol the expert is launched at. Risk Calculator tells you how many cost to trade based on: Given stop-loss take-profit levels for "Instant Execution" and "Pending Order" Account currency Price of the quote currency (when different from account currency) Risk Calculator can place order like one click trading

The Multitimeframe-Candles (MCandles) - Indicator for MT5 shows the contour of an higher, free selectable, timeframe as an overlay on the current timeframe. You can freely choose the timeframe, number of candles and color of the overlays. The indicator only calculates the current candle frequently, so it saves computing capacities. If you like the indicator, please left a comment.

Offer 249 down from 350 for the next 1 copies. then back to 350 $
Are you tired of using outdated indicators that leave you guessing where to set your profit targets? Look no further than the AK CAP Opening Range Breakout Indicator. This powerful tool is backed by a US patent and has already helped countless traders pass funded challenges like FTMO. We use it daily on our prop traders and internal funds, and now it's available to you as well. The calculation behind the indicator is incredibly

Higher Timeframe Chart Overlay will display higher timeframe candles, including the number of candles high/low you specify.
You no longer need to switch timeframes to check the candles. Everything can be shown in one chart. MT4 Version : https://www.mql5.com/en/market/product/115680 Almost everything can be change as you want. You can change/set:
- Choose different colors for the body and top/bottom wicks.
- Panel's height and width.
- The width of the body and wicks
- Change backgrou

The indicator looks for the "Fifth dimension" trade signals and marks them on the chart. A detailed description of the chart patterns that generate the trade signals can be found in Chapter 8 "The Balance Line Trades" in the book Williams' "New Trading Dimensions". Signal levels with indication of the position entry or stop loss placement price are indicated directly on the chart. This feature creates additional convenience for the trader when placing pending orders. A solid horizontal line is d

NO GRID, NO MARTINGALE, NO HEDGE, NO SCALP, Expert Advisor for Gold
Introducing the cutting-edge expert advisor designed by RoyalPrince This innovative tool is packed with features to revolutionize your trading experience: Tailor your trading strategy with customizable settings for Timeframes, Lots, Slippage, and Chart Symbol Selection. Utilize advanced functionalities like setting Take Gain and Stop Loss levels based on ATR calculations. Choose from various Trailing Stop methods such as Clas
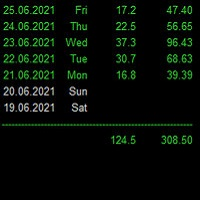
Statistics for each day
Индикатор показывает статистику - итоговую конечную прибыль/убыток по каждому отдельному торговому дню с учетом свопов и комиссий. Параметры : Dey - количество анализируемых дней; Weekday color - цвет будних дней; Weekend color - цвет выходных дней; Loss color - цвет убытка; font_size - размер шрифта; font_face - название шрифта; Для удобства просмотра статистики за большие временные периоды, при инициализации индикатор выгружает данные в Statistics.csv
Созданный файл и

The indicator plots charts of profit taken at the Close of candles for closed (or partially closed) long and short positions individually. The indicator allows to filter deals by the current symbol, specified expert ID (magic number) and the presence (absence) of a substring in a deal comment, to set the start time and the periodicity of profit reset (daily, weekly or monthly) to calculate the profit chart. The indicator also displays the floating (not fixed) profit of the opened positions at th

Automatic calculation of lot size based on the StopLoss level: it calculates the lot with consideration of the risk percentage. Enter the deposit percentage and set the line to the planned StopLoss level. The lot size for the entry will be output as a result. The TakeProfit will also be calculated with taking into account the profit/loss ratio, and their profit/loss in the deposit currency. Thus, the end result of the trade can be seen immediately, which is an integral part of successful trading

Introducing a cutting-edge trading indicator, specifically designed to predict and signal upcoming spikes in Boom 1000 and Boom 500 markets. This innovative tool provides traders with timely alerts, enabling them to capitalize on market movements with precision. Key Features: Accurate Spike Prediction : The indicator utilizes advanced algorithms to identify potential spike occurrences in Boom 1000 and Boom 500 markets. User-Friendly Signals : The indicator generates clear buy signals, allowing t

IceFX VelocityMeter Mini is a very unique indicator on MetaTrader 4 platform which measures the speed of the Forex market . It is not a normal volume or other measurement indicator because IceFX VelocityMeter Mini is capable to understand market speed movements which are hidden in ticks and those valuable information cannot be read in an ordinary way from the candles. The software monitors the received ticks (frequency, magnitude of change) within a specified time range, analyzes these info and

Royal Wave is a Trend-Power oscillator which has been programmed to locate and signal low-risk entry and exit zones. Its core algorithm statistically analyzes the market and generates trading signals for overbought, oversold and low volatile areas. By using a well-designed alerting system, this indicator makes it easier to make proper decisions regarding where to enter and where to exit trades. Features Trend-Power Algorithm Low risk Entry Zones and Exit Zones Predictions for Overbought and Over

This indicator can be considered as a trading system. It offers a different view to see the currency pair: full timeless indicator, can be used for manual trading or for automatized trading with some expert advisor. When the price reaches a threshold a new block is created according to the set mode. The indicator beside the Renko bars, shows also 3 moving averages.
Features renko mode median renko custom median renko 3 moving averages wicks datetime indicator for each block custom notificatio
MetaTraderマーケットはMetaTraderプラットフォームのためのアプリを購入するための便利で安全な場所を提供します。エキスパートアドバイザーとインディケータをストラテジーテスターの中でテストするためにターミナルから無料のデモバージョンをダウンロードしてください。
パフォーマンスをモニターするためにいろいろなモードでアプリをテストし、MQL5.community支払いシステムを使ってお望みのプロダクトの支払いをしてください。
取引の機会を逃しています。
- 無料取引アプリ
- 8千を超えるシグナルをコピー
- 金融ニュースで金融マーケットを探索
新規登録
ログイン