Watch the Market tutorial videos on YouTube
How to buy а trading robot or an indicator
Run your EA on
virtual hosting
virtual hosting
Test аn indicator/trading robot before buying
Want to earn in the Market?
How to present a product for a sell-through
Expert Advisors and Indicators for MetaTrader 5 - 55
This EA trades with the trend using several methods to identify and enter a trade. For example, it uses trendlines, Gator and Stochastic indicators to analyze the market. In addition to trading, it can also display trend lines that it trades based on. It has filters for ADX and MA indicators, as well as a sufficient number of settings to be able to optimize on various currency pairs and timeframes.
The EA sets stop loss and take profit for each trade, does not have risky trading methods. It i

Introducing Backtest Simulator , an essential Expert Advisor designed to help you thoroughly test your trading strategies using historical data. Unlike the standard Strategy Tester in MetaTrader 5 , Backtest Simulator provides a user-friendly graphical interface that allows manual control over trades and positions within the Strategy Tester . The Strategy Tester in MetaTrader 5 lacks the capability for manual trade execution , limiting your ability to open orders manually, set pending orders, o

The RFOC Mini Chart was created to project a macro view of the market, which the option to select the timeframe of interest other than the main chart, it is possible to include 2 indicators: 1 - Moving average channel On the mini chart, the moving average will be created based on the prices of the selected time frame for the RFOC Mini Chart. The moving average period must be selected in the indicator settings pannel.
2 - Boillinger Band In the mini chart, a boillinger band will be created base
FREE

This indicator get all events/countries/values from metatrader terminal calendar and print veritical lines at chart, you can configure anything with inputs (string to filter names/url/code/countries/currencies), select period to filter, nws interval before and after current time (every information about time is seconds based), you can filter importance, type, sector, unit, multiplier, impact, timemode, frequency, forecast/previous % increase/decrease interval, actual/previous % increase/decrease
FREE

Transaction Data Analysis Assistant: This is a statistical analysis tool for transaction data, and there are many data charts for analysis and reference. language: Support language selection switch (currently supports Chinese and English active recognition without manual selection) The main window shows: Balance display Total profit and loss display Now the position profit and loss amount is displayed Now the position profit and loss ratio is displayed The total order volume, total lot size, and
FREE

Finally, the interface has become convenient. Now you can control the indicator period with the mouse. Just click on the button and scroll the mouse wheel to increase or decrease the CCI period. The button can be placed in any convenient place, fixed and used with one click. You can set several indicators on one chart and manage them individually or all at once. A simple installation on the chart allows you not to worry about renaming or changing the parameters of each indicator, the automatic
FREE

The FREE version works on Demo account and only CADCHF and NZDCHF pairs.
The indicator predict the future candles direction, by scanning past candle movement. Based on the principal: “ The history repeat itself”. Programmed according to Kendall Correlation. In the settings menu, different scanning options are available. When the indicator find a match, start painting future candles from the current candle to the right, also from the current candle to the left as well, showing you the candle
FREE

We at Minions Labs always like to defy the stablished systems and beliefs trying new things and new ways of seeing and interpreting the Market Data. And all starts with the following question...
WHAT IF...
You give more relevance and focus on the Wicks/Shadows on the candlesticks? And Why? In volatile markets wicks play an important role on determining who is winning the the fight between Bulls and Bears , and more than that, Higher and lower wicks can present you with a good status of the cu
FREE

Position Closer is advisor used to close all orders when the profit will cross specified value either above or below. You can close all orders with one button click.
On panel on chart you have options: Deactivate after close - If Deactivate after close is checked the advisor will disable Close above profit and Close below profit options after orders are closed either on crossing the profit or on hitting the CLOSE ALL button. Close above profit - If Close above profit is checked, the advisor wi
FREE

M ulti Cross Alert! on your smartphone. Use multiple indicators to get a crossover signal on chart as well as on MetaTrader app. You can use all crossovers at the same time but it is not recommended cause your chart will look messy. Instead use combination of two indicators which will be better. IMP NOTE:- More indicators will be added in future updates. Any suggestions regarding indicators are welcome! Indicators List: 1. MA (Cross) 2. RSI (OB/OS) 3. MACD Lines (Main Line & Signal Line Cross)
FREE

The RSI (Relative Strength Index) scanner is a powerful technical analysis tool designed to help traders and investors identify potential trading opportunities in the forex, stocks, and cryptocurrency markets. RSI is a popular momentum oscillator that measures the speed and change of price movements and helps determine overbought or oversold conditions in an asset. The scanner takes advantage of this indicator to streamline the process of finding trading signals and opportunities. The RSI value
FREE

Pairs Navigator is a simple and easy-to-use tool that allows you to view all of your charts in a single window. This eliminates the need to open multiple charts from the Market Watch window, saving you time and effort. Pairs Navigator is also very lightweight, so it will not put a strain on your RAM or cause your MT4/5 platform to hang. To use Pairs Navigator, simply drag and drop the currency pairs you want to view into the Pairs Navigator window. You can then easily switch between charts by
FREE
This is the script needed to use The News Filter . This script selects any chart that you want to filter and sends the inputs to The News Filter program. Every input is specific to that chart, so you have the flexibility of setting different inputs for every chart. Links to The News Filter (free demo) can be found below: The News Filter Guide + Download Links
News selection News source is Forex Factory's economic calendar . Selection can be based on any number of currencies . Se
FREE

The indicator ColorCandlesDaily draw candles with different colors depending on the day of the week.
FREE
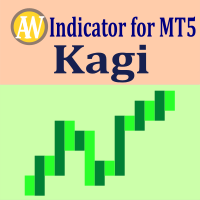
Description. The basis for the formation of the Kagi chart is the price range, always the reverse of the movement. If the price goes beyond its limits, a box is displayed on the chart. Boxes are formed of different sizes and are always alternating, that is, after the "up" box, a "down" box will be built. Time is not involved in the construction. Features. For use in conjunction with the Expert Advisor, an additional buffer is implemented-a box counter. For convenience and to increase the speed
FREE

A simple and efficient indicator that plots and updates the 50% of the current day, for those who use this point as a reference in day trading.
On trend days the 50% region tends to be a good resistance point, ideal for making new entries.
On non-trend days (sideways) the 50% region is great for carrying out positions.
In addition, for study or back-testing criteria, you can define the amount of previous days to be plotted by the indicator.
For questions or suggestions, please contact u
FREE

产品介绍 这是款非常简单有效的EA , 该EA使用布林带、AO指标以及斐波那契回调线的组合而进行工作。产品的核心理念为市场情绪的惯性交易。该EA是不考虑趋势方向的,适用于市场振幅始终的产品,多数直盘货币对均可试用。白银以及股指类慎用。
适用品种: GBP/USD JPY/USD EUR/USD
联系我: 知乎:https://www.zhihu.com/people/maysen-30 微信:maysen55
参数 介绍 开仓分数 BB、AO指标打分高于多少开仓 幻数 交易标识 布林带周期 周期,建议考虑最近5天以上数据 内偏移 偏移指数 外偏移 偏移指数(要大于内偏移) 开仓类型 固定值、资金比例 开单比例 资金比例开仓百分比 最小开仓量 固定值开仓手数 回调线观察柱数 超过柱数不再进行回调线划线
FREE

This EA automatically closes all Open Trades and Pending Orders at your specified Net Profit or Net Loss. The TP and SL for a single trade can easily be set in Meta Trader, on individual basis and on hitting that TP or SL, the trade is automatically closed. However, if you have multiple trades and you want to set a Net TP and Net SL (in terms of profit & loss) for all of them, then Meta Trader cannot help you. Here comes this EA “Net TP Net SL Setter” using which you can set a Net TP and Net SL
FREE

BeST_Hull Single MA Strategy is an Metatrader Indicator based on the famous indicator Hull Mov.Average . This indicator can display the Single HMA Strategy of just 1 Hull MAvg. It uses added internal filters locating the most likely Entries while it can be used as a standalone system or as an add-on to other ones.
Generally the Hull Moving Average (HMA - developed by Alan Hull) is a directional trend indicator . It captures the current state of the market and uses recent price action to determi

Less is more. Find the strongest trends! This expert scans ALL currency pairs for a strong trend combined with a breakout.
Requirements for a trend report: 1. Up-trend or down-trend must be found in all of the following timeframes (D, H4, H1, M30) 2. Breakout in the daily timeframe (the upper or lower band of the Bollinger band must be broken)
The correctness of the trend is confirmed to 90%
FREE

This is a multi frame stochastic indicator, you can attach any time frame of stoch indicator on one chart. It is very useful if you like to check multi time frame stoch data. If you are interested in EA,click below links to take a look: https://www.mql5.com/en/market/product/80170 https://www.mql5.com/en/market/product/81136
How to use: > Atach the first time frame you want on to the currency pair's chart > Atach the second time frame you want on to the currency pair's chart > Atach the thir
FREE

HM (Horizontal Markup) is designed for manual marking of horizontal levels. The markup contains the level and its price value. The thickness and color of the line and the price value are set in the settings. Levels can be placed locally on timeframes, or set publicly for all timeframes.
His job is very simple:
1) – press the key that you set in the settings to mark up the level;
2) – we bring the line to the desired location;
3) – click the right mouse button and the level is lin
FREE

Smart Trend Line Alert , available for MT5 is a unique professional Trend Line, Support Line and Resistance Line Touch and Break out Alert with awesome Alert History feature, designed to help traders easily manage many charts and symbols without staring at the monitor.
Features Candle Break Out Alert, Price Touch Alert and Time Line Alert; 1 click for converting any drawn line into an alert line (Trend line and Horizontal line or Trend Line By Angle); Alerts History able to re-open closed char

Limited Time Offer! Only $ 5300 USD ! The price will increase by $100 USD after every 10th purchase ! Final price: $ 15 000 USD DESCRIPTION : Attention! Contact me immediately after purchase to receive setup instructions!
The Expert Advisor (EA) is designed for capital distribution. We have made every effort to ensure that the minimum deposit is $100 USD.
This advisor is intended for trading with the broker Deriv. The EA has been optimized over the past year, startin

TradeCopy is an efficient MT4, MT5 trade copy software,using as EA on MT4 real account. You can download the Demo unlimit version to test on Demo account: Trade Copy MT4 Demo Free Trade Copy MT5 Demo Free
Features: 1.Can achieve cross-MT4 and MT5 trade copy . 2. The Sender and the receiver are in the same file, which is convenient to use. 3.Can achieve cross-broker trade copy. 4.More trade copy style, you can copy by balance,equity, lot ratio or fixed lot . 5.Can enlarge or reduce the amou

BeST_Hull MAs Directional Strategy is a Metatrader Indicator based on the corresponding Hull Moving Average.It timely locates the most likely points for Entering the Market as well as the most suitable Exit points and can be used either as a standalone Trading System or as an add-on to any Trading System for finding/confirming the most appropriate Entry or Exit points. This indicator does use only the directional slope and its turning points of Hull MAs to locate the Entry/Exit points while it

The RFOC Mini Chart was created to project a macro view of the market, which the option to select the timeframe of interest other than the main chart, it is possible to include 2 indicators:
In the full version it is possible to include 2 indicators: 1 - Moving average channel On the mini chart, the moving average will be created based on the prices of the selected time frame for the RFOC Mini Chart. The moving average period must be selected in the indicator settings pannel. 2 - Boillinger Ba
FREE
As a paid version, but only for JPY pairs.
Paid version: https://www.mql5.com/en/market/product/109302 Enjoy it, enjoy it, enjoy it, enjoy it, enjoy it, enjoy it, enjoy it, enjoy it, enjoy it, enjoy it, enjoy it, enjoy it, enjoy it, enjoy it, enjoy it, enjoy it, enjoy it, enjoy it, enjoy it, enjoy it, enjoy it, enjoy it, enjoy it, enjoy it, enjoy it, enjoy it, enjoy it, enjoy it, enjoy it, enjoy it, enjoy it, enjoy it, enjoy it, enjoy it, enjoy it, enjoy it, enjoy it, ...
FREE

Free version of https://www.mql5.com/en/market/product/44815 Simple indicator to calculate profit on fibonacci retracement levels with fixed lot size, or calculate lot size on fibonacci levels with fixed profit. Add to chart and move trend line to set the fibonacci retracement levels. Works similar as default fibonacci retracement line study in Metatrader. Inputs Fixed - select what value will be fix, lot or profit (available in full version, lot is set on free version) Fixed value - value tha
FREE

T-Wallpaper. This is a very useful wallpaper that comes with trade manager panel. You can choose any wallpaper of your choice. Must add the WallPaper file to your MQL5 Data Folder. Follow this easy steps: Download the WallPaper files from our channel https://www.mql5.com/en/channels/transitbk98 Open MT5 Select files Open Data Folder Open MQL5 Open Files and past the Wallpaper folder Now the wallpaper will display. Wallpaper settings are found on the user input. Trade panel settings are found on
FREE

This indicator implements the original “ Average True Range (ATR) ” developed by John Welles Wilder Jr. , as described in his book— New Concepts in Technical Trading Systems [1978] . It uses Wilder’s moving average , also known as the smoothed moving average (SMMA) , instead of a simple moving average (SMA) as used on MetaTrader’s built-in ATR indicator. The default period applied is 7, instead of 14, as per the description in his book.
FREE

This indicator displays the spread Simple and easy to use and fully customisable: View as Pips or Pipettes Chart symbol can be hidden Text display can be changed Change color and text styles Add or hide a decimal point Spacing options between inputs Default screen positions Screen position inputs
How to use 1. Simply use the default settings; or 2. Choose to show pips or pipettes; 3. Choose to display symbol, text or decimal; 4. Choose where to place it on the screen; 5. Save settings or save
FREE

This indicator is able to determine the price levels at which there was the most volume for the specified period of history. In the future, the price often bounces off such levels, and this can be successfully applied in trading. They are displayed as lines, some parameters for determining the levels can be adjusted. This indicator is simple, therefore, it does not report signals, and only builds levels on EUR/USD. Parameters
HistoryBars - the number of bars to determine the near volume levels;
FREE

The BWmfi Bar indicator is designed to work with the Bill Williams system The indicator displays MFI signals on the chart, highlighting candles the corresponding MFI signals
You can choose 4 options for the indicator operation by setting the corresponding number 1,2,3,4 in the settings, in the "Input parameters" tab:
Normal graph without MFI signals In this mode, the bars will be painted in the colors of the MFI bars
This regime is used in his trading by Justin Williams, the daughter of Bi

Bill Williams' divergent bar with angulation. The angle between the green line and the top/bottom of the bar is used as an angle, which basically corresponds to the updated recommendations from Justin Williams Angulation for the Wiseman Bullish and Bearish Divergent Signal Bar - YouTube . The default settings of the angle of 85 and 21 bar from the moment of crossing the lip line of the Alligator work quite well. If you use this indicator in real trading, I highly recommend not to engage in day
FREE
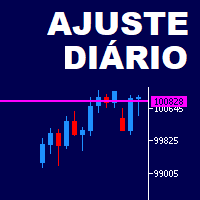
This is a tool in script type. It shows in chart the actual and/or past day ajust price in a horizontal line. The symbol name and it expiration must be set up according to the actual parameters. The lines appearance are fully customizable. You need to authorize the B3 url on MT5 configurations: www2.bmf.com.br. You need this to the tool can work. This is a tool for brazilian B3 market only!
FREE

516/5000 Average volume indicator to calculate the average volume for a given period. Useful as a filter to measure the strength of a trend, or false breaks in support or resistance.
It does not give a signal to buy or sell, it only acts as a filter to avoid entering into transactions with a drop in volume, or below-average volume, which may indicate disinterest in trading at the price level.
It has only the parameters of period, method of calculating the average and type of volume.
FREE

A professional tool for trading - the divergence indicator between the RVI and the price, which allows you to receive a signal about a trend reversal in a timely manner or catch price pullback movements (depending on the settings). The indicator settings allow you to adjust the strength of the divergence due to the angle of the RVI peaks and the percentage change in price, which makes it possible to fine-tune the signal strength. The indicator code is optimized and is tested very quickly as p
FREE
DESCRIPTION 3 Bar Break is based on one of Linda Bradford Raschke's trading methods that I have noticed is good at spotting potential future price volatility. It looks for when the previous bar's High is less than the 3rd bar's High as well as the previous bar's Low to be higher than the 3rd bar's Low. It then predicts the market might breakout to new levels within 2-3 of the next coming bars. Must also be traded during the active hours of the market you want to trade. EG EURUSD 7am - 5pm This
FREE

If you are looking for a safe ea to start trading BTCUSD this is your ea
BITCOIN MT5. It is an Ea that seeks the best window of opportunity to enter the market.
If the entry is wrong, the system exits by stop lost and take profit.
The system detects the best moment to enter the BTCUSD and at that moment places a market order with its stop loss and its take profit.
Once the order is placed, the exit is only by stop lost or by take profit.
There is only one order at a time reducing the r
DYJ Follow Me is an EA that follows the virtual transaction record of any dyj indicator to actually open and close positions.
It can display the name and status of the indicator of the single signal source; At present, it is only the DYJ SignalSourceOfWPR MT5 indicator, and more indicators will be expanded in the future.
It can receive real-time trend direction of indicator.
It can receive the latest admission time of the indicator.
It can receive the latest admission price of

Color Candle Indicator. The indicator implements a breakout system using the channel. When price exits the gray channel, the candlestick color changes to the color corresponding to trend direction. Blue for growth, yellow color for fall. Bright colors denote coincidence of trend direction and direction of a candlestick. Dark colors correspond to the situation when the direction of a candlestick is opposite to trend.
FREE

A script for closing positions If you need to quickly close several positions, this script will make all the routine for you! The script does not have any input parameters. Allow AutoTrading before running the script. Usage:
Run the script on a chart. If you need to specify the maximal deviation and the number of attempts to close positions, use the script with input parameters https://www.mql5.com/en/market/product/625 You can download MetaTrader 4 version here: https://www.mql5.com/en/market
FREE

It is utility for working Real Time Binance Futures Ticks Data and Real Time Binance Spot Ticks Data . It is designed to pull data faster and stay within the boundaries of Binance Future. Working logic: Global Variables records the time information it receives from Binance Check Server Time. In other programs, they do their work faster and more efficiently by using this time information.
You should allow WebRequest from Tools menu >> Options >> Expert Advisors and add URL: https://api.binanc
FREE

The VR Object Delete All script solves the problem of garbage on the chart. it is often necessary to completely clear the chart of everything that is put on it, comments, lines, objects. The script completely deletes everything, even those objects that are not visible. When working, VR Object Delete All writes everything it does in the terminal log, as well as the names of objects to delete. Displays the number of deleted objects as a separate line. in case of any errors, it will display an erro
FREE

The ICT Concepts indicator regroups core concepts highlighted by trader and educator "The Inner Circle Trader" (ICT) into an all-in-one toolkit. Features include Market Structure (MSS & BOS), Order Blocks, Imbalances, Buyside/Sellside Liquidity, Displacements, ICT Killzones, and New Week/Day Opening Gaps. It’s one kind of Smart money concepts. USAGE: Please read this document ! DETAILS Market Structure Market structure labels are constructed from price breaking a prior extreme point. T

What is The Waiter ?
It is an automated system to always be ready to catch the big movements of the market
How does it work?
Set the mode (stop or limit) Set the pending orders distance Set Take Profit / Stop Loss Wait for the big candle
settings:
entry : 0.OFF (the expert advisor won't operate. only for chart info purposes.) 1.New candle, new STOP orders (each new candle two stop orders are placed. If they are not activated by the end of the candle, they will be cancelled) 2.New candle
FREE

ICT Kill zone and Macros Indicator mark and display the following zone times on the chart: Kill zones Kill zone Forex Asian
London Open New York Open London Close Central Bank Dealing range
Kill zone Indices Asian London Open New York AM New York Lunch New York PM Power Hour
Macros London 1 London 2 New York Am 1 New York AM 2 New York Lunch New York PM 1 New York PM 2
Silver bullet London Open New York AM New York PM
Sessions Asian London New York
Chart The display of Kill zone ,

The spread in trading is the difference between the purchase price and the sale price of a financial instrument on the market. The spread is a commission fee that traders pay brokers for the opportunity to trade.
It's no secret that each broker offers its own terms for trading. The size of the spread is important. There are a lot of advisors (especially scalpers) who show different results at different brokers. We have repeatedly encountered this. Therefore, using this utility, find out what
FREE

MovingInWL The Expert Advisor is designed to move the stop of open positions to no loss when they reach a certain predetermined profit level. Description of the advisor settings: MagicNumber - order identifier LevelProfit - The level of profit in points that the position must reach in order for its stop to be moved to the level without loss. LevelWLoss - The level without loss in points, to which the stop position will be transferred after its profit reaches the LevelProfit level in points
FREE

The Grid Builder MT5 utility is designed for placing a grid of pending orders of any complexity and will be an excellent tool in the hands of a trader who trades grid trading strategies. The tool has numerous settings that allow you to quickly and easily build a grid of orders with the specified parameters. All types of pending orders are supported:
Buy Stop; Buy Limit; Sell Stop; Sell Limit. The script also allows you to delete a previously placed grid of orders in one click. If the "Delet

Indicator that show candlestick bars with an different sampling method than time fixed. Real time data is sourced to the indicator and it may be used as substitute of the default graph. Each bar is formed when a predefined amount of ticks is received, showing in the graph the OHLC of this clusteri of ticks. The input variable is the amount of ticks of each bar. It's a different approach of sampling, the amount of bars is proportional to the amount of negotiations insted of a sample in a fixed am
FREE

Demo heging tool: Create a panel on chart show detail and button support
- Show detail orders running (Buy/Sell):
+ Total orders
+ Total profits
+ All Commission
+ All Swap
- Action(Button):
+ Close All Orders
+ Close All Orders Buy
+ Close All Orders Sell
+ Proactive heged all orders running
- Auto Mode:
+ Close all order when profit reach target
+ Heged order follow target
FREE

Combining the best of Price Action , Directional Movement , and Divergence / Convergence analysis, the Candle Color Trend is the easy and reliable way to identify the direction of the trend. The indicator automatically paints the candles according to the premise that the upward trend is defined by prices that form a series of ascending tops and bottoms. On the other hand, the downward trend is defined by prices that form a series of descending tops and bottoms.
Color Trend is certainly one
FREE

Order Book, known also as Market Book, market depth, Level 2, - is a dynamically updated table with current volumes of orders to buy and to sell specific financial instument at price levels near Bid and Ask. MetaTrader 5 provides the means for receiving market book from your broker, but in real time only, without access to its history. This expert adviser OrderBook History Playback allows you to playback the market book events on the history using files, created by OrderBook Recorder . The exper
FREE
This Renko is: Live : constantly updated on the market prices Dynamic : updating on each new ATR value Backtestable : Generating the chart during backtest, allowing Real Ticks Accuracy and Time Period Accuracy Guppy Built-in : GMMA with 12 EMA built-in This is what you are looking for! RENKO A Renko chart is a type of chart, developed by the Japanese, that is built using price movement rather than both price and standardized time intervals like most charts are. It is thought to be named a

The indicator calculates the inclination angle between the Highs, Lows and Closes of adjacent bars. The angle can be measured in degrees or radians. A linear graph or a histogram is drawn in a subwindow. You can set the scale for the calculation — floating or fixed. For use in Expert Advisors or indicators, you need to specify a fixed scale.
Parameters Angular measure — degrees or radians. Scale mode for calculation — scaling mode. Free scale — free transformation, the indicator will calculate
FREE
MA strategies EA is a moving average cross EA that can support multiple MA cross strategies that involve two or three moving averages. Purchasing this EA can save you the time taken to automate your existing MA strategy through coding a custom EA and it also helps you discover profitable moving average strategies as its fully compatible with the strategy tester and all settings are editable. The EA supports both scalping, short term and long term strategies. The various supported settings are ex

XXXX ATR (Average True Range) Position Manager: ATR StopLoss, ATR Target, ATR Breakeven, ATR Trailing StopLoss, with Risk % Calculation / Position.
Fully automated advanced ATR EA is now available:
https://www.mql5.com/en/market/product/94895
Key takeaways One click does it all: SELL and BUY button automatically places ATR stoploss, ATR target, ATR breakeven, ATR trailing stop and Risk % calculation of equity Entire position is calculated based on ATR No more manual position calculati
TDO is a free utility for optimizing the Trading Direction indicator. In addition to signals for trading, the indicator also has an information vector that fully provides all the statistical information on the operation of the indicator; this effect can be used to ensure that the indicator is automatically optimized. You just need to select the instrument and timeframe and specify the hourly interval in the utility settings and drop it on the chart chart. That's all, now we are waiting for the
FREE

Midnight Scalper is based on a sound trading principle. It is made to trade during times when the market is at low volatility. From 23:00 to 00:00 is best. It uses multiple indicators for precise entry and exits with a basic fixed stop loss and take profit as part of its money management strategy.It does not put your funds at high risk with such methods as martingale, grid, averaging positions or no stop loss trading. ECN broker is required with a tight spread and low commission. NOTE : After a

Have you thought about sharing your EA trading signals with your friends? Or your EA signal can trade cryptocurrencies, but it cannot trade Binance Futures directly in MT5? Or you have an excellent EA, but it cannot be applied to other quantitative trading platforms without source code? Hook EA is to solve these problems. Regardless of whether you trade with a real account or a Demo account, Hook EA can monitor the Order or Deal submitted by any EA in real time, and send the information to the

Hello This EA (expert advisor) will open orders from Telegram "Auto Open orders from Telegram" (Telegram to MT5). Please watch our video for more details: https://www.youtube.com/watch?v=p06o1xgsD5c
download instructions from here https://drive.google.com/file/d/1rwZnvgaWoi3gSkEwsi7s5jeatjJLGTWc/view?usp=sharing
Good luck -------------------------------------------------------------- السلام عليكم هذا الاكسبيرت سيفتح صفقات آلية وفورية من تليجرام (Telegram إلى MT5) يرجى مشاهدة الفيديو لمزيد من
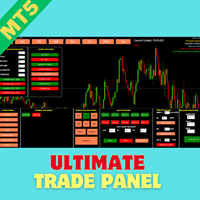
Introducing the Ultimate Trade Panel MT5 - Your All-in-One Trade Manager for MQL5 Trading Are you a trader looking to streamline your trading activities and gain a competitive edge in the market? Look no further! The Ultimate Trade Panel MT5 is here to revolutionize your trading experience on the MQL5 platform. With a plethora of unique and time-saving features, this expert advisor is designed to be your reliable companion for day-to-day trading activities. Key Features: Indicator Manager: Say g

MACD Histogram tracks the difference between the MACD line and the Signal line (which is the exponential moving average of the first line). For better visibility, when plotting the lines and the histogram in the same window, we scale up the histogram by a factor of 2. Furthermore, we use two separate plots for the histogram, which allows us to color-code the bars for upticks and downticks. The MACD Combo overlays MACD lines on MACD Histogram. Putting both plots in the same window enables you to

iVolX indicator horizontal volumes for all time periods
Main settings of the indicator: VolumeSource - select data for volumes (tick or real) PeriodMinutes - selection period for rendering of volumes PeriodsNumber - number of periods to show on the chart StartDate - the start date of the calculations ClusterPoints - cluster width Color - color MaxVolColor - maximum volume color ValueArea - the value of the zone of balance ValueAreaColor - color of the balance zone MaxVolFontSize - font size Ma

This utility allows to switch among symbols. You have to insert in the input your favorite tickers. it is possible to customize up to 5 symbols
Shortcut Keys : Switch among Symbols : A -Forward D -Backward
Inputs You can setup your favorite keys to switch among symbols.
You can customize the color of background and the edge of the buttons .
You can customize the labels : dimension and font.
FREE

The indicator displays the delta and the cumulative delta based on the "Time & Sales" deals list data. In addition to the standard timeframes, the indicator displays data regarding the seconds timeframes (S5, S10, S15, S20, S30) to choose from. Using the rectangle, user can select an arbitrary area in the indicator subwindow to view the ratio of the volumes of deals of buyers and sellers within this area.
Indicator features:
The indicator works correctly only on those trading symbols for whi

MACD indicators https://mql5.com This MACD indicator looks slightly different from the MACD indicator found in many other charting software. When the value of the signal line parameter is greater than the value of the MACD parameter, the indicator will give a buy prompt, and when the signal line parameter is less than the value of the MACD parameter, the indicator will give a sell prompt.
FREE

Dynamic Theoretical Stop
Histogram indicator that dynamically analyzes the theoretical Stop levels in real time.
Operation :
The DTS - Dynamic Theoretical Stop does a mapping of fractals in previous candles and suggests two levels of Stop: For purchase and for sale.
Suggested reading :
It is necessary to make the definition of Maximum Stop in points in the Trading Plan. In this way, the trader can decide the best entry point by analyzing the theoretical stop levels:
Stop for sales: S
FREE
Do you know why the MetaTrader Market is the best place to sell trading strategies and technical indicators? No need for advertising or software protection, no payment troubles. Everything is provided in the MetaTrader Market.
You are missing trading opportunities:
- Free trading apps
- Over 8,000 signals for copying
- Economic news for exploring financial markets
Registration
Log in
If you do not have an account, please register
Allow the use of cookies to log in to the MQL5.com website.
Please enable the necessary setting in your browser, otherwise you will not be able to log in.