Watch the Market tutorial videos on YouTube
How to buy а trading robot or an indicator
Run your EA on
virtual hosting
virtual hosting
Test аn indicator/trading robot before buying
Want to earn in the Market?
How to present a product for a sell-through
Free Expert Advisors and Indicators for MetaTrader 5 - 6

The " YK Find Support And Resistance " indicator is a technical analysis tool used to identify key support and resistance levels on a price chart. Its features and functions are as follows:
1. Displays support and resistance levels using arrow lines and colored bands, with resistance in red and support in green.
2. Can be adjusted to calculate and display results from a specified timeframe using the forced_tf variable. If set to 0, it will use the current timeframe of the chart.
3. Uses
FREE

Closing Price Reversal is a very well known and traded candlestick pattern. This little indicator paints with specific (user-selected) colors the Closing Price Reveral Up and Down patterns, as well as the Inside Bars (as a bonus). Higher timeframes are more effective as with all other candlesticks patterns. Do NOT trade solely on this indicator. Search the web for "Closing Price Reversal" to learn about the several approaches that can be used with this pattern. One of them is combining short/me
FREE

Free automatic Fibonacci is an indicator that automatically plots a Fibonacci retracement based on the number of bars you select on the BarsToScan setting in the indicator. The Fibonacci is automatically updated in real time as new highest and lowest values appears amongst the selected bars. You can select which level values to be displayed in the indicator settings. You can also select the color of the levels thus enabling the trader to be able to attach the indicator several times with differe
FREE

Synthetic indeces are one of a kind of forex markets. Specially, on boom and crash indices on M1 timeframe is really interesting. I always thought that it was impossible to catch spikes safely until today. Everything has it's limits. This EA is based on martingale strategy with low drawdown. Max grid level is 3. When each trades goes on drawdown, the next trade will be multiplied by 2. The EA does not use take-profit or stoploss . So the backtesting will show the same results as real-time tradi
FREE

Что такое Heiken Ashi? Heiken Ashi — это метод построения графиков, который можно использовать для прогнозирования будущего движения цены. Он похож на традиционные свечные графики. Однако в отличие от обычного свечного графика, график Heiken Ashi пытается отфильтровать часть рыночного шума для лучшего определения трендовых движений на рынке. Как рассчитать Heiken Ashi?
Heiken Ashi использует формулу COHL, которая означает «Закрытие, Открытие, Максимум, Минимум». Это четыре компонента, кото
FREE

Divergence RSI Trader is based on divergences in the chart and indicator (RSI Level 14). Divergence RSI Trader's strategy to find lows and highs on the chart and RSI indicator, analyze them and then open positions. EA was tested in the EURUSD H1 in the strategy tester and adjusted to this currency by default. EA has also been tested with other settings at GBPUSD M5 for 10 years and completed with good results. Because this is a free version, there will be no more tests and only updates. Please
FREE
The Higher timeframe candle tracker is used to get a glimpse of what the selected higher time frame candle is like. It plot the candle after the current price. It can come in handy for day traders and short term traders that often worry about how the current higher timeframe candle may look like. You can select the higher time frame or lower time frame from the options provided: By default the color for bears is red and for bulls is green. You are able to change the width of the candle, its wick
FREE

This indicator finds Double Top and Double bottom Example : What is Double Top When price establishes a new high and then falls, then reverse to the same candle area of High then its considered a valid double top and vice versa for double bottom. 1. It plots and high and low on visible chart if ChartChange is set to true else it searches on new bar opening
2. If there is double top and double bottom found in visible chart window then it plots a line 3. It has options to customize text color, te
FREE

Trade the Ichimoku Kinko Hyo Indicator with complete freedom using a powerful and flexible EA. It implements many entry strategies and useful features, like customizable trading sessions and a martingale mode. [ Installation Guide | Update Guide | Troubleshooting | FAQ | All Products ] Easy to use and supervise It implements several entry conditions Customizable break-even, SL, TP and trailing-stop settings Works for ECN/Non-ECN brokers Works for 2-3-4-5 digit symbols Implements a martingale fea
FREE
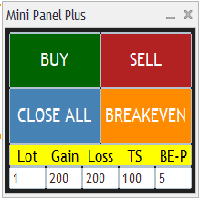
Remodeling the BoletaMiniPanel, the Mini Panel Plus has the same functionalities, but is now in the form of a box that allows it to be minimized and placed anywhere on the chart. Simple Panel with Stop loss (Loss), Stop gain (Gain), Trailing stop (TS) and Breakeven (BE-P). The Lot is the number of contracts to be traded. Gain is the number, in points, at which the stop gain will be positioned. If you don't want to place a stop gain, just put 0 (zero) in its place and when you open the order it w
FREE

This is a derivative of John Carter's "TTM Squeeze" volatility indicator, as discussed in his book "Mastering the Trade" (chapter 11).
Gray dot on the midline show that the market just entered a squeeze (Bollinger Bands are with in Keltner Channel). This signifies low volatility, market preparing itself for an explosive move (up or down). Blue dot signify "Squeeze release".
Mr.Carter suggests waiting till the first blue after a gray dot, and taking a position in the direction of the mo
FREE

The RenkoChart tool presents an innovative and highly flexible approach to visualizing market data in MetaTrader 5. This expert creates a custom symbol with Renko bricks directly on the chart, displaying accurate prices at the respective opening date/time for each brick. This feature makes it possible to apply any indicator to the Renko chart. Furthermore, this tool also allows access to historical brick data through native methods in the MQL5 programming language, such as iOpen, iHigh, iLow and
FREE
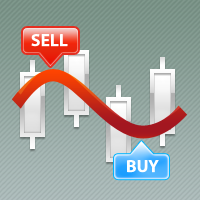
The strategy is based on price crossover with Moving Average indicator, confirmed by ADX indicator. The trade signals: Buy: closing price of the last completed bar is higher than moving average, the moving average increases at the current and last completed bars. Sell: closing price of the last completed bar is lower than moving average, the moving average decreases at the current and last completed bars. To filter the false signal, it checks the trend power (ADX>ADXmin) and trend direction usin
FREE

UPDATED The Non-Repaint zones is a time base indicator that scans for possible reversal of the market for perfect entry. It read the history and draws the possible zone for our comfort. The indicator possesses four different zones that read the history of the market over 10,000 previous bars and predict the possible entry point. It rescans every market trend change to give us the possible zone, it is used for trading all types of markets and does not repaint. The indicator has the following inp
FREE

Tired of plotting trendlines? The PZ TrendLines MT5 indicator applies a mechanical approach to the construction of trend lines for you! [ Installation Guide | Update Guide | Troubleshooting | FAQ | All Products ] It can draw up to 18 trendlines Trendlines can be optionally based on fractals Each line represents a breakout level Each trendline can be broken or rejected Configurable amount of lines Configurable colors Support I am happy to provide free products but given my limited time, they com
FREE

The indicator displays volume profiles based on the nesting principle. Profiles periods are pre-set so that each subsequent profile has a length twice as long as the length of the previous profile. In addition to profiles, the indicator displays volume clusters sorted by color, depending on the volume they contain.
Indicator operation features The indicator works on typical timeframes from M5 to MN, but for calculations uses historical data from smaller timeframes: M1 - for timeframes from M5
FREE

For Demo, Competition and Real Account. Valid until 20/12/2025 Combined with artificial intelligence. Build your EA, so you can build your strategy with available indicators and tools. Build EA Simple does not have any set strategy, but with it you can use a combination of indicators and use them as signals or filters and build your strategy!
Indicators available: Price Action Fast Moving Average Slow Moving Average Adaptive Moving Average Triple Exponential Moving Average Relative Strength In
FREE

SUPERTREND; It is a trend following indicator based on the SuperTrend ATR created by Olivier Seban. It can be used to detect changes in trend direction and locate stops. When the price falls below the indicator curve, it turns red and indicates a downtrend. Conversely, when the price moves above the curve, the indicator turns green, indicating an uptrend. Like other indicators, it works well on SuperTrend when used in conjunction with other indicators such as MACD, parabolik SAR, Bollinger Band
FREE

This indicator is a personal implementation of the famous Traders Dynamic Index, which uses RSI, moving averages and volatility bands to find trends, reversals and price exhaustions. However, this particular implementation supports not only RSI, but many others. It is suitable for scalping, day trading, and swing trading and aims to provide a full picture of the current market conditions. [ Installation Guide | Update Guide | Troubleshooting | FAQ | All Products ]
It is a complex but very use
FREE

If you have the opportunity to read the book " Trend Trading - A Seven-Step Approach to success " by Daryl Guppy, you will have a great deal of information about how to "read" the market. In his book Daryl show, among other things, how can we use a visual tool to measure the volatility and trend between Long and Short-term periods: The GMMA - Guppy Multiple Moving Averages .
Instead of using his original idea of having 12 Exponential Moving Averages in your chart - which could be very CPU-dem
FREE

Use this indicator to get alerts on trends developing within the market. Using this indicator, you will be able to get alerts about trends that are developing in the market as they develop. This indicator can be used to identify entries or exits within a trend. The indicator combines information from higher timeframes, with price movements of the current timeframe to output a buy or sell signal. The indicator can identify trend changes, or continuations of the dominant trend. Note: Trend followi
FREE

This indicators automatically draws the support and resistances levels (key levels) for you once you've dropped it on a chart. It reduces the hustle of drawing and redrawing these levels every time you analyse prices on a chart. With it, all you have to do is drop it on a chart, adjust the settings to your liking and let the indicator do the rest.
But wait, it gets better; the indicator is absolutely free! For more information: https://youtu.be/rTxbPOBu3nY For more free stuff visit: https
FREE

Chart Symbol Changer for MT5 is an indicator/utility that offers you the option to change the current chart symbol that is attached onto with a click of a symbol button on its panel. Chart Symbol Changer for MT5 gives you the option to configure the 32 symbol buttons to your personal preference, by adding the pairs you want to keep any eye on and trade the most. This way you will never miss an opportunity, because you can have a faster view of the market on your chart with just a few clicks.
FREE
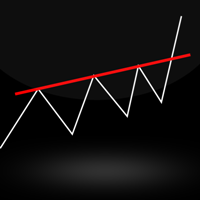
Free TrendLine EA opens trades whenever the price on the chart interacts with or crosses your trend line. You simply draw the trend line manually then let the EA do the trading automatically according to the rules you give it. The settings available in the EA are explained below: Lots : The lot size for trading. RiskPercentage : Set a value other than zero to activate lot sizing by use of percentage of margin. TrendLineName: The name of the line to track. You can either * rename the trend li
FREE

The "SMC Trading Strategy" or "Smart Money Concept" is a trading strategy that focuses on understanding and following the movements of "large capital" or "Smart Money", which usually refers to institutional investors or major players who can influence the stock or asset markets. This strategy relies on technical and behavioral market analysis to predict market or stock price directions by observing the actions of Smart Money. These investors are believed to have more information, resources, and
FREE

Introducing HydraAlchemist, an innovative automated trading tool. This cutting-edge Expert Advisor (EA) skillfully combines multiple technical indicators to pinpoint promising trading opportunities in financial markets. We aim to maximize profits by scrutinizing signals obtained from indicators such as MACD, stochastic, and RSI using our own logic and accurately grasping market trends and turning points. The real strength of 'HydraAlchemist' is that it is based on real trading strategies. While
FREE

Sessions are very important in trading and often good area where to look for setup. In SMC, ICT we will look for Asian session to serve as liquidity
This indicator displays: High & Low of the Asia session Midnight New York time opening line
Congifuration Line Style, color Label position, size, color Start of the level (Start of the day, Start of the session, Highest or Lowest point in the session)
Any questions or comments, send me a direct message here https://www.mql5.com/en/users/mvonl
FREE

Ultimate Pivot Levels indicator for MetaTrader 5 Ultimate_Pivot_Levels is versatile tool designed to enhance your trading experience by accurately plotting pivot levels on your charts. It allows entering your desired values manually or using well known pivot calculation methods to create pivot levels. It draws the levels in the background and allows you to customize levels, size and colors of areas, and it keeps your adjustments while extending the levels to every new bar. Whether you are a novi
FREE
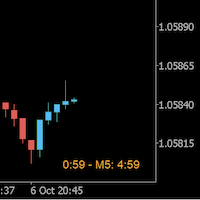
Always wanted to know when the M5 candle closes when you are in M1 ? This indicator allow to display a candle timer (countdown) on the current time frame as well as any higher time frame you have configured for this time frame. So this is easy now to see when the H4 candle closes when you are in H1.
Congifuration Label position, size, color HFT time frame per time frame Any questions or comments, send me a direct message here https://www.mql5.com/en/users/mvonline
FREE

Understanding the levels of the previous day or week is very important information for your trading.
This indicateur allow to draw Previous day High/Low Previous week High/Low
Congifuration High & Low for: Previous day, week Line Style, color Label position, size, color Any questions or comments, send me a direct message here https://www.mql5.com/en/users/mvonline
FREE

The Clean Trading Sessions indicator shows the most significant trading sessions for the Forex market, such as London, New York, Tokyo. The Clean Trading Sessions indicator is a simple and, at the same time, quite functional Forex sessions indicator, developed for the MT5 terminal. It is available to download for free.
How is this Forex market session indicator used? Traders normally use trading sessions to determine the volatile hours throughout the day, since the trading activities vary
FREE

Display Order box list from Trading box Order Management tool. Find contacts and manual links on my profile . This dashboard gives you an edge in forex trading because in few seconds you can decide which pair and timeframe is worth to watch more closely. This is how you will not be distracted by all other forex pairs that you trade, and you will not miss great opportunities to trade the best price.
Trading Dashboard (order box overview panel and Trading box Order management extension) Tr
FREE
This utility tool shows the ticker symbol, timeframe, and description information as a watermark on the chart. Text resizes automatically according to chart size. It is useful to identify the correct chart when multiple charts are shown on the screen. Want more control over text apperance? Check out our Chart Watermark MT5 Premium utility. See the demonstration video below!
Inputs: Font Size: Initial font size for the ticker symbol and timeframe text (Default; 50). Description text font siz
FREE

ChannelRSI5 The Relative Strength Index (RSI) indicator with dynamic levels of overbought and oversold zones.
Dynamic levels change and adjust to the current changes in the indicator and prices, and represent a kind of channel.
Indicator settings period_RSI - Averaging period for calculating the RSI index. applied_RSI - The applied price. It can be any of the price constants: PRICE_CLOSE - Closing price, PRICE_OPEN - Opening price, PRICE_HIGH - Maximum price for the period, PRICE_LOW - Minim
FREE

The "Trend Fishing Indicator" is a powerful custom indicator designed to help traders identify potential trend reversal points and capitalize on market momentum. This indicator uses multiple moving averages of varying periods to evaluate short-term and long-term market trends. By comparing the short-term moving averages against the long-term ones, it generates clear buy and sell signals that can guide traders in making informed trading decisions. Key Features: Multiple Moving Averages : Incorpor
FREE
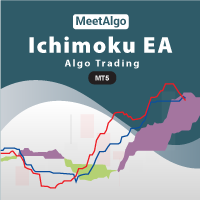
CAP Ichimoku EA MT5 trades using the Ichimoku Kinko Hyo Indicator. It offers many customizable Ichimoku trading scenarios and flexible position management settings, plus many useful features like customizable trading sessions, a martingale and inverse martingale mode. [ Installation Guide | Update Guide | Submit Your Problem | All Products ]
Functions Easy to use and customizable Ichimoku setting. Customizable indicator settings Built-in money management Grid trading when trade in Los
FREE

Graph configuration and buy and sell signals based on Stormer's (Alexandre Wolwacz, Brazilian trader) swing, position and day trade strategy, described on his youtube channel (https://www.youtube.com/watch?v= 0QZ_NjWkwl0)
The buy and sell indications are based on 2 candle patterns ( Inside Bar [Yellow] and Reversal Closing Price [Blue and Red] ), 3 Moving Averages and 1 Stochastic .
Indicators: Inside Bar - Candle pattern indicating trend continuity, or reversal Reversal Closing Price - Ca
FREE

IMPORTANT : When testing the EA or running it live, make sure to set "Activate MNG Martingale" to "True"
Hello & Welcome To MNG
MNG is a martingale EA that allows you to configure a lot of features that I'll detail below.
But first, I'd like to insist on the fact that a martingale EA is never safe, no matter if it has a good track record for 5+ years, if it shows incredible backtest results, if it's marketed as the best EA or whatever its price is ($30,000 or $50). A martingale EA might bl
FREE

This indicator analyzes price action patterns and helps you to make positive equity decisions in the binary options market. [ Installation Guide | Update Guide | Troubleshooting | FAQ | All Products ] Easy to trade Trade both call and put options No crystal ball and no predictions The indicator is non-repainting The only strategy suitable for binary options is applying a mathematical approach, like professional gamblers do. It is based on the following principles: Every binary option represents
FREE

A very simple indicator, but one that cannot be missed when carrying out your operations.
Fast and accurate Spreed information before entering a trade as well as the time to start another candlestick.
Spread refers to the difference between the buy (purchase) and sell (offer) price of a stock, bond or currency transaction.
Come and see our mql5 signals too. https://www.mql5.com/pt/signals/899841?source=Site +Signals+From+Author
FREE

Jackson trendline scanner it a powerful price action tool which draw accurate trendlines and alert a breakout signals . As we all know that trendlines it a most powerful tool in price action by providing us with different chart patterns. e.g. Bullish flag, Pennant, Wedges and more...It not easy to draw trend lines, Most successful traders use trendlines to predict the next move based on chart pattern and breakout. Drawing a wrong trendline it a common problem to everyone, wrong
FREE

Build Your Strategy Yourself This tool allows you to develop your strategies using all the indicators available natively in MetaTrader and any indicators downloaded from the internet that use buffers to display data on the screen. This tool is another reason for you to consider MetaTrader to automate your trading strategies. With it, you can create your own strategy signals in a simple and intuitive way, using any MetaTrader indicator. How Do I Know If My Internet-Downloaded Indicator Uses Buffe
FREE

MASpeed is a universal moving average, with an indication of the speed of movement. Points on the line appear when the average moves faster than the threshold value. The threshold value can be specified in the settings. Based on this indicator, you can build a wide variety of trading strategies. The indicator has huge opportunities to adjust the moving average - 10 types of smoothing. 12 price options to build. Added the possibility of sampling the resulting moving. Additional advantages are: fa
FREE

REMINDER: DO NOT USE THE DEFAULT SETTING,PLEASE FOLLOW THE RECOMMENDED PARAMETERS BELOW!!!
SNIPER SACLPER EA - is the ultimate high win rate , the only expert advisor has single entry strategy uses fix and dynamic trail tp & stop loss
- The Backtesing was realistic using high latency and maximum 250 POINTS STOP LOSS to cover market slippage
- It can be tested on multiple time frame from M1 to H1 to see different results but
FREE

The original author is David Weis, an expert in the Wyckoff Method. The Weis Wave is a modern adaptation of the 1930's Wyckoff Method, another expert in Tape Reading techniques and Chart Analysis. Weis Waves takes market volume and stacks it into waves according to price conditions giving the trader valuable insights about the market conditions. If you want to learn more about this subject you can find tons of videos in YouTube. Just look for "The Wickoff Method", "Weis Wave" and "Volume Spread
FREE

The indicator allows you to instantly determine the current trend by color and FIBO levels. Higher Timeframe the panel shows the current trend of higher periods, helping to determine the strength of the trend. Trade according to the trend when changing the color of candles or trade against the trend when the price hit the extreme levels of the FIBO Trend PRO indicator Advantages of the FIBO Trend PRO
Indicator never repaint and does not change their values Very easy to use and intuitive App
FREE

The Pivot Point indicator automatically calculates and displays the pivot point line and support and resistance levels. Pivot can be calculated according to the Classic, Floor, Fibonacci, Woodie, Camarilla or DeMark formula. It is also possible to select the period for calculating the indicator. A trader can choose from daily, weekly, monthly, or user-defined periods.
Types of pivots Classic Floor Fibonacci Woodie Camarilla DeMark
Main features The indicator shows the current and histor
FREE

This indicator uses the Zigzag indicator to identify swing highs and swing lows in the price chart. Once it has identified the swing highs and swing lows, it can use them to determine potential support and resistance levels. A support level is formed when the price drops and bounces back up from a swing low, indicating that there is buying pressure at that level. A resistance level is formed when the price rises and reverses downward from a swing high, suggesting selling pressure at that level.
FREE

The Inside Bar pattern is a very well known candlestick formation used widely by traders all over the world and in any marketplace. This approach is very simple and adds a little confirmation candle, so it adds a third past candlestick to the count to confirm the direction of the move (upward or downward). Obviously, there is no power on this candlestick formation if the trader has no context on what it is happening on the market he/she is operating, so this is not magic, this "radar" is only a
FREE

This indicator is based on the famous fractal indicator but with much customization and flexibility ,
this is a powerful tool for identifying trend reversals and maximizing your profit potential.
With its advanced features and user-friendly interface, it's the ultimate choice for traders of all levels. MT4 Version : Ultimate Fractals MT4 Features :
Customizable Fractal Candle count. Reversal Lines. Customizable Settings. User-Friendly Interface. Main Parameters: Candles On Left - numb
FREE

The indicator displays a renko chart and a supertrend indicator in real time. After installing the indicator, the window will display the Renko chart and the supertrend indicator in the same window. This allows you to more clearly and visually see the entry and exit points when a trend reversal occurs. The signal to open a position is the intersection of the Renko candlestick of the supertrend indicator point and the appearance of the opposite signal of the supertrend indicator.
The indicator
FREE

This is RSI with alarm and push notification -is a indicator based on the popular Relative Strength Index (RSI) indicator with Moving Average and you can use it in Forex, Crypto, Traditional, Indices, Commodities. You can change colors to see how it fits you. Back test it, and find what works best for you. This product is an oscillator with dynamic overbought and oversold levels, while in the standard RSI, these levels are static and do not change.
This allows RSI with alarm and push notific
FREE

Using the Stochastic Oscillator with a Moving Average is a simple but very efficient strategy to predict a trend reversal or continuation.
The indicator automatically merges both indicators into one. It also gives you visual and sound alerts.
It is ready to be used with our programmable EA, Sandbox, which you can find below: Our programmable EA: https://www.mql5.com/en/market/product/76714 Enjoy the indicator!
This is a free indicator, but it took hours to develop. If you want to pay me a c
FREE

Amiguinho's Bar Counter is a price action indicator to display the bar count (candles) with some interesting options.
About the "Period of analysis" parameter: if the current timeframe is in minutes, then the analysis period will be considered in days; if the current timeframe is in days, then the analysis period will be considered in months; or if the period of analysis will be considered in years.
FREE

CPR Pivot Lines It Will Draw Pivot Point R1,R2,R3 S1,S2,S3 Tc Bc Best Part Is That You Can Even Add Values Of High,Low,Close Manually Also To Get Your All Levels On Chart.So If Your Broker Data Of High ,Low ,Close Is Incorrect Then You Don’t Have To Depend On Them Anymore. You Can Even Modify All Lines Style. It Will Show Line In Floting Style And Not Continues Mess.
FREE

This indicator detects inside bars of several ranges, making it very easy for price action traders to spot and act on inside bar breakouts. [ Installation Guide | Update Guide | Troubleshooting | FAQ | All Products ] Easy to use and understand Customizable color selections The indicator implements visual/mail/push/sound alerts The indicator does not repaint or backpaint An inside bar is a bar or series of bars which is/are completely contained within the range of the preceding bar. A blue box is
FREE

Institutional Levels / Bank levels ... Psychological levels / Quarters theory. This indicator will automatically draw at levels, "000, 200, 500 and 800", what I know as 'Institutional Levels', OR, can also draw levels "000, 250, 500 and 750", onto the chart.
Depending where you have learnt Institutional Level trading / Quarters theory, you may know them as different names, essentially the core idea is that these levels act as strong support & resistance points in most forex markets. Group chat
FREE

This robot works with crossing of moving averages. Moving averages are used mainly to follow trends, the strategy of crossing moving averages has the main purpose of taking advantage of large bullish and bearish movements. All parameters are editable and easy to use, this is an experimental project. Use this robot to carry out studies and share with us the bes information you find. Aurélio Machado.
FREE

We value your feedback and believe that your experience with the Hull Moving Average (HMA) is essential to us and other traders. Help us continue to improve and refine our product by sharing your thoughts and insights through a review!
The Hull Moving Average (HMA) Indicator – Your Key to Smoother Trends and Profitable Trades! Are you tired of lagging and choppy moving averages that hinder your ability to spot profitable trading opportunities? Look no further! The Hull Moving Average (HMA) is
FREE

VR Color Levels is a handy tool for those who apply technical analysis using elements such as trendline, rectangle and text. It is possible to add text directly to the chart and take screenshots. You can find settings, set files, demo versions, instructions, problem solving, at [blog]
You can read or write reviews at [link]
Version for [MetaTrader 4] Working with the indicator is carried out in one click . To do this, click on the button with the line, after which a trend line will appear un
FREE

Renko is a timeless chart, that is, it does not take into account the time period, but the price change, which makes the price change on the chart clearer.
Hyper Renko is the indicator that provides this.
To configure, you only have one parameter, the size of the candle in the tick * you want to use.
* tick: is the smallest possible variation of an asset.
Thank you for choosing a Hyper Trader indicator.
Wikipedia: A renko chart indicates minimal variation in the value of a variable -
FREE
Indicator that synchronizes the charts, that is, when the symbol is replaced in one of the charts, all those that appear with the synchronized indicator are changed, with the same timeframe (Same_Timeframe = true) or with different timeframes (Same_Timeframe = false). The graphics to be synchronized are identified by color (Label).
To synchronize the indicators, the indicator must be inserted in all the charts to be synchronized, using the same color (Label).
A box with the chosen color (La
FREE
IMPORTANT: Before proceeding with backtests and launching the robot, make sure to set the Lot_plus value to "true" instead of "false" to enable automatic lot calculation. It is also crucial to adjust the Cut_loss to 54 instead of 1 to optimize risk management. DESCRIPTION: GridBreakout is an automated trading robot specialized in trading the GBP/USD forex pair. Utilizing a grid technique, it is designed to capitalize on market breakouts, offering a dynamic and responsive strategy to market movem
FREE

Highlights trading sessions on the chart
Trading Sessions Indicator highlights the starts and ends of each trading sessions. The paid version of the Trading Sessions Indicator Pro product with the possibility of customizing the start/end of sessions >>>
[OPTIONS:] Timeshift - Use it if there is a time offset of sessions
[Set parameters:] Asian session Open=0; Asian session Close=9; Asian session OpenSummertime=1; Asian session CloseSummertime=10; European session Open=8; European session
FREE

Show Pip Value and Spread on Chart as Object or Comment. User can select to display Pip Value and/or Spread by object on main Chart, or show both only as Comment lines on chart. Object Color, Font face and Size and also which corner to show, may change by user. Pip Value calculated in accordance of input Lot size , Default is 1 lot . Can use at all currency pairs , Gold , Silver and most other charts.
FREE

This indicator forms a channel based on the readings of the ADX (Average Directional Movement Index) indicator, displays and informs the trader of a price reversal at the boundaries of this channel, and can also report when the price touches the channel boundaries. It also draws additional dotted lines, which depend on the readings of the + DI and -DI of the ADX indicator. It also has an option for filtering signals depending on the readings of the stochastic. The channel drawn by this indicato
FREE
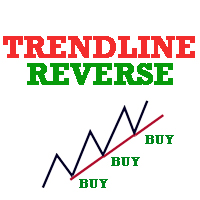
The Trend Line Reverse Expert Advisor is a highly innovative and powerful tool that enables traders to effortlessly identify and trade trends in the financial markets. With this advanced tool, you can easily draw trend lines on your MT5 chart, and the EA will automatically buy or sell when the price reaches the trend line. This EA is user-friendly and requires minimal setup. You can simply attach it to your chart and start drawing up to three trend lines where you anticipate the price to reverse
FREE

The MACD 2 Line Indicator is a powerful, upgraded version of the classic Moving Average Convergence Divergence (MACD) indicator.
This tool is the embodiment of versatility and functionality, capable of delivering comprehensive market insights to both beginner and advanced traders. The MACD 2 Line Indicator for MQL4 offers a dynamic perspective of market momentum and direction, through clear, visually compelling charts and real-time analysis.
Metatrader4 Version | How-to Install Product | How
FREE

** This is the short version of Symbol Changer . You might want to refer to full version with further features. Symbol Chart Changer is an indicator/utility that offers you the option to switch between symbols and timeframes. You can choose any symbol and timeframe on the same chart with just a few clicks. In addition, this indicator also shows the profit of the symbol through the color of the buttons. For MT4: Symbol Chart Changer Features
All symbols selected in MarketWatch, that allow y
FREE

Auto Fibo Expansion is an indicator that projects the Fibonacci expansion levels above and below the opening price of the day. It does the calculation based on the previous day and projects the levels on the current day. It is very efficient to find "psychological" zones of support and resistance. Its appearance is all configurable and you can set up to 30 different levels. Enjoy! This is a free indicator, but it took hours to develop. If you want to pay me a coffee, I appreciate a lot <3 PayP
FREE
The MetaTrader Market is a simple and convenient site where developers can sell their trading applications.
We will help you post your product and explain you how to prepare your product description for the Market. All applications on the Market are encryption-protected and can only be run on a buyer's computer. Illegal copying is impossible.
You are missing trading opportunities:
- Free trading apps
- Over 8,000 signals for copying
- Economic news for exploring financial markets
Registration
Log in
If you do not have an account, please register
Allow the use of cookies to log in to the MQL5.com website.
Please enable the necessary setting in your browser, otherwise you will not be able to log in.