YouTubeにあるマーケットチュートリアルビデオをご覧ください
ロボットや指標を購入する
仮想ホスティングで
EAを実行
EAを実行
ロボットや指標を購入前にテストする
マーケットで収入を得る
販売のためにプロダクトをプレゼンテーションする方法
MetaTrader 4のためのエキスパートアドバイザーとインディケータ - 62
Discover IT MACD Crossover, your ultimate ally for maximizing your profits in the foreign exchange market. Our Expert Advisor (EA) leverages the powerful MACD technical indicator to execute trades automatically with unparalleled precision.
Key Features:
- MACD Crossover Strategy: IT MACD Crossover is based on the proven strategy of MACD crossover to identify trading opportunities. Crossings between fast and slow exponential moving averages (EMA) trigger buy or sell signals, suitable for all m
FREE

Advanced Moving Average Example of how the EA works: When the fast moving average line crosses over the slow moving average line, from below it to above it, this implies that the instrument is in an uptrend, hence a potential buy trade might be opened This EA allows you to set up to 21 separate moving average cross over criteria: There are 3 Moving Average Crossover input parameter sets Each set allows you to set the bars used for the Fast and Slow moving average line And it also allows you to
FREE

Highly configurable CCI indicator. Features: Highly customizable alert functions (at levels, crosses, direction changes via email, push, sound, popup) Multi timeframe ability Color customization (at levels, crosses, direction changes) Linear interpolation and histogram mode options Works on strategy tester in multi timeframe mode (at weekend without ticks also) Adjustable Levels Parameters:
CCI Timeframe: You can set the current or a higher timeframes for CCI . CCI Bar Shift: you can set
FREE

SmartChanelFree is a universal indicator for all types of markets. This indicator should have in its arsenal every trader, since it represents a classic approach to analyzing the price of a trading instrument and is a ready-made trading strategy. The indicator forms the upper, average price movement limit. Attention !!! This version of the indicator is trial and works only on the chart with the period M1. The full version of the indicator can be found at: https://www.mql5.com/en/market/product/
FREE

Moving Average Cloud draws 4 MAs on chart simultaneously in histogram style. Indicator uses 4 MAs: slow sma & ema 200 and fast sma & ema 50. the range between 2 slows MAs and Fasts, represented by histograms on the MAs boundaries - creating kind of "cloud" that can be traded by all kind of MA strategies like support & resistance or other... Change of color of the same histogram points to momentum changing.
Combined with other market analysis, can greatly improve trading results.
FREE

Indicator overview Trend indicator usage Moving averages. Highest quality alerts that need no introduction. It is completely loyal to the original algorithm and uses other useful features.
Easy to trade Carry out all kinds of notifications It's not a new paint and it's not a back paint. Setting Indicator SSMA50 in Time frame H1 for any pair currency and Gold Spot. EMA200 in Time frame H1 for any pair currency and more than EMA250 for Gold spot. Using it for maximum benefit Set up notificatio
FREE

Check out other great products from https://www.mql5.com/en/users/augustinekamatu/seller
This indicator finds the entry points based on divergences of common indicators and does not repaint . The principles used ensure that it can be used on CFDs, Commodities and Stock with incredibly great results. With proper money management and portfolio balancing the Indicator can be applied to any trading strategy to generate consistent profits. A Winning Trading Strategy This article describes the com
FREE
EA245 Draw Supply Demand v1 This EA only good for draw Supply and Demand, you can use draw with two Time Frame input (True/False). Manual Traders can use as tool for support and monitor the price near Supply and Demand before excute to open Buy or Sell orders Note: The result of Auto Trading normaly not good, so please consider select True or False open Order (item [11]). This EA for free so you can use and share for your friends. If you have any question, please contact our gruop via informatio
FREE
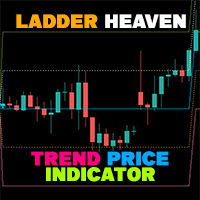
If you have difficulty determining the trend as well as entry points, stop loss points, and take profit points, "Ladder Heaven" will help you with that. The "Ladder Heaven" algorithm is operated on price depending on the parameters you input and will provide you with signals, trends, entry points, stop loss points, take profit points, support and resistance in the trend That direction.
Helps you easily identify trends, stop losses and take profits in your strategy!
MT5 Version: Click here
FREE
- The Symbol Changer Utility for MetaTrader is a tool that enables traders to switch between various symbols on the MetaTrader trading platform easily and quickly. - It is designed to change the symbol of the current and all open chart windows and the timeframe of the current chart window (by clicking the button). - The tool retrieves symbols from the Market Watch, displaying only the necessary symbols in the market watch.
FREE
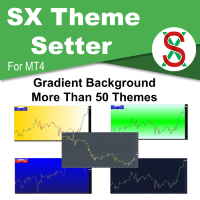
SX Theme Setter is intended for changing chart appearance in 2 modes: - Gradient background mode:
In this mode, the indicator creates a gradient background for your chart. Colors, steps and gradient type can be selected by user. - Color theme:
Color theme mode provides more than 50 built-in different color themes which can be selected from a list. Most of these themes are converted from official color themes of real trading platforms of the past and present. Try them out and see if they suit
FREE
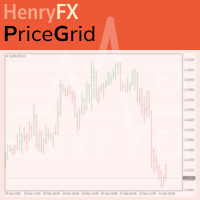
This indicator help you to easily calculate the price moving. You can change the gird size withing the input parameter for your trading style, such as hedge, swing trader, ect. It can let you easy to find your takeprofit and stoploss target price in chart.
For more about my tools and EA, you can join my channel below, thank you. Telegram channel: t.me/HenryEAChannel
FREE
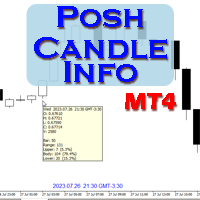
Show candle info with: Time in selected timezone Bar number Candle range points Upper wick points and percentage Body points and percentage Lower wick points and percentage Mark large/small candle body with customizable line. Settings group: Broker and local timezone. Lookback bars for candle marking. Large candle body Small candle body Date and time info with auto position or custom the x and y coordinate.
FREE

Fractals ST Patterns is a modification of Bill Williams' Fractals indicator. Unlike a standard Fractals indicator, Fractals ST Patterns allows setting any number of bars to find a fractal. This simple indicator corresponds to the parameters specified in the ST Patterns Strategy ( https://stpatterns.com/ ) . Structural Target patterns are the market itself, which is consistently divided into components. For the formation of ST Patterns , no trend lines, geometric proportions of the model itself,
FREE
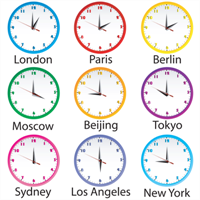
The EA is meant for opening trades at a certain time. All parameters of trades being opened are adjustable: take profit, stop loss, opening time, opening direction (may be both directions), lot of orders. The EA has 12 settings for different opening time, however the EA can also open trades at the same time if required. Just keep in mind that the EA can perform 12 various operations at different time and with different take profit, stop loss, etc.
Settings: Lot_1 = 0.1 - lot for the first setti
FREE

Detailed post explained:
https://www.mql5.com/en/blogs/post/759269
This is a slope indicator for Bollinger Bands indicator. It provides slopes for BB top band, center band (main) and Lower Band. You can also set a threshold value for Center line to control Red/Green slope histogram lines. Settings:
You can choose which line you need the slope and Threshold Alerts for in Drop down.
Slope Thresholds: for Alerts. Please note that Alerts only happen when Threshold is crossed. e.g.: If Threshold
FREE

FusionAlert StochRSI Master is an indicator available for MT4/MT5 platforms, it is a combination of RSI & Stochastic indicator which provide "alerts" when the market is inside "overbought and oversold" regions combined for both indicators, results in more precise and accurate signals to be used as a wonderful tool, in the form of "buy or sell" signals. This indicator comes with many customization options mentioned in the parameter section below, user can customise these parameters as needful. Jo
FREE

Introduction
Virtual Money Flow free - Lightweight free trading robot based on Money Flow index. Orders set with ISL and take profit is virtual. Equipped with trailing stop and limited money management. How to? Any account type,leverage and time frame Works only on currency pair EURUSD, optimizations needed in regualar intervals You can start with as low as $20-50 based on leverage 500 This is not a scalper and trades can therefore be less frequent, be patient! Limited contract size
FREE

Spread Data tool will display current spread and average spread. It will record spread for every hour (from 0 to 23) and can give better data about your broker spread. Run it for 2 days or more to get better spread data . Every spread smaller than MinSpread will be recorded as MinSpread Every spread larger than MaxSpread will be recorded as MaxSpread It help to decide what spread to be used when do backtest, EA spread settings, EA that trade in specific time interval, especially for scalping EA
FREE

ボリンジャーバンドとストキャスティクスとの戦略取引
ボリンジャーバンドは主にトレンドを追うために使用されます。
オープン保留中の注文の購入または販売のための確率的メインラインおよびシグナルラインの使用
アドバイザAuto3MLiteMT4はVPSで動作できます。
Pro version MT4
Pro version MT5
特徴
マーチンゲールなし ハードストップロスと各ポジションの利益を取る トレーリングストップ 保留中の注文をインターバル時間で自動的に削除 保留中の注文には買いストップと売りストップ機能を使用します 取引戦略
AUTO3M Lite MT4は9通貨ペアEURUSD、GBPUSD、AUDUSD、NZDUSD、USDCHF、USDCAD、USDJPY、EURJPY、GBPJPYで取引されています
保留中の注文の購入停止または販売停止のみを使用します。
ストキャスティクスは、相場分析と新しいバーでの分析にのみ使用されます。
確率的メインラインが90を超え、ビッドが90未満の場合、アッパーバンドは注文待ちの売りストップを準備します。
確率的メイ
FREE

Индикатор отображает различными цветами на фоне графика три торговые сессии. Открытие - закрытие Лондон, Нью Йорк, Токио по умолчанию. Применение Для успешной торговли важно знать начало и конец торговых сессий с наибольшей ликвидностью, так как именно в это время цена делает самые большие движения.
Особенности Настройки по умолчанию - торговые сессии по Лондону, Нью Йорку, Токио. Возможность выставить свои рамки тоговых сессий Алерт при открытии сессии Показ открытия дня по GMT Настройки для
FREE

This indicator is designed to detect the best of all candlestick reversal patterns: Three Line Strike . According to the bestselling author and candlestick guru Thomas Bullkowski, this pattern has a winning percentage between 65% and 84% . This FREE Version of the Scanner scans only EURUSD and GBPUSD. The full version of the scanner can be found here: Three Line Strike Scanner 30 Instruments This indicator scans for you up to 30 instruments (forex, indices or commodities) on up to 8 timeframes.
FREE

An improved version of the standard Standard Deviation indicator.
It is now a responsive and smoothed line.
The setup is not straightforward - but I hope you can do it.
It is very easy to understand the readings of this indicator, the meaning is the same as that of the usual Standard Deviation.
//////////////////////////////////////////////// ///////////////////////////////////
I hope this indicator will be very useful to you in successful trading.
Good luck.
FREE

本指标是根据黄金分割理论,分别获取过去22(默认)根K线高低价,并通过黄金分割系数计算得出支撑、压力曲线。 当价格第一次向上靠近压力线,或者多次靠近压力线时,会出现向下的箭头符合,提示有压力,适宜做空sell; 当价格第一次向下靠近支撑线,或者多次靠近支撑线时,会出现向上的箭头符合,提示有支撑,适宜做多buy; 在数据窗口,会提示各条支撑、压力线的价格数值,出现的箭头符合数值为up、down。
这个指标,适合在所挂的图表里做短线,也即进场开仓后,持仓几根K线柱,然后可以平仓。做多的话,止损可以在支撑线下方,止盈在压力线附近。做空的话,止损可以在压力线上方,止盈在支撑线附近。
本指标涉及的黄金分割系数分别为0.382、0.618、1.618、2.168、4.236,计算得到对应的支撑压力线。 由于MT4的指标数量有限,本指标分成了2个EX4文件,第一个的黄金分割系数为0.382、0.618、1.618,第二个为2.168、4.236,第二个文件名为“Golden Ratio Support Pressure Indicator extend”,可免费下载和使用。
FREE

The indicator summarizes all open positions. Settings: HeaderTextColor = Yellow; // Header text color FooterTextColor = Yellow; // Text color in totals ProfitColorPositive = Lime; // Color for gain values ProfitColorNegative = Red; // Color for loss values SeparatorColor = Gray; // Color for separators FontSize = 12; // Text size LineSpacing = 15; // Line spacing FontName = "Courier New"; // Font name TableCorner = 0; // 0: Top
FREE
This indicator displays the historical spread values on the chart. This is an extremely useful tool for watching the spread rise and fall, allowing you to enter the market at just the right time. This indicator will help you stay out of the market when the spread begins to rise and help you get into the market as the spread begins to fall again.
ON SALE FOR FREE, GET IT FREE FOR A LIMITED TIME ONLY
FREE

Have you ever lost your mind? Cause you open multiple positions try to revenge the market or sometime open double, triple position to maximize the profit? if you are win it is okay, but how about if you lose? So "MaxOrdersWarning" may remind your consciousness not to open too many orders in the same time.
How to use - Drag and drop Indicator on your chart. - Set the limitation number of your position ( per Chart Symbol that you open )
Then what's next?
If you reaches the limit, the background
FREE

Double Price Channel 設定で指定された特定の数のバーの価格チャネルインジケーター。
インジケータラインは、動的なサポートまたは抵抗レベルを表します。上限は特定の期間の価格の最大値であり、下限は最小値です。終値に基づく移動平均とは異なり、指標は小さな変動によって「気が散る」ことはありません。境界が変更された場合にのみ再計算されます。後者が発生した場合は、新しいトレンドのアプローチについて真剣に考える価値があります。期間の異なる2つの指標を1つのチャートで同時に使用する戦略があります。このような場合、周期の短いインジケーターは2番目のインジケーターの内側に配置されます。 インジケーター設定の説明: Width_Bars-インジケーター期間 高さ-高さ(ポイント単位)
FREE

BotBladi EA – High-Performance Expert Advisor Optimized for Small Accounts BotBladi EA is a powerful, precision-engineered Expert Advisor designed for traders who want to grow small accounts with minimal risk and maximum reward. Built around a robust trading strategy with a 1:6 risk-to-reward ratio , this EA ensures that even a single winning trade can cover several small losses, giving you the edge needed to succeed in volatile markets. Key Benefits: Ideal for Small Accounts: BotBladi EA
FREE

This indicator provides common shapes as drawing object options. The shapes are rotatable, resizable, draggable, and will keep their proportions (according to their handle trendline) across different chart scales. Multiple drawings are supported.
Shapes: Square Rhombus
Triangle (quadrilateral & isosceles) Circle (grid, overlapped grid, flexi grid, rotatable grid, concentric circles) Features: rays (all object edges will be rays) show/hide each individual drawing type, or all delete last drawn ob
FREE

Utility for show on charts the visual informations about: - a vertical line at start of each bar of selected timeframe - a vertical line at start of each day - a vertical line at start of each week - vertical lines at start / end of trading sessions selected - bid / ask prices, spread, money value for each point (of 1 standard lot) and last tick time recived" You can enable / disable each information and set the color for each line
FREE
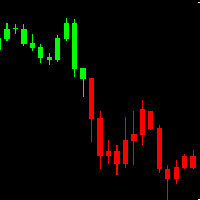
AH Candles MT4 AH Candles MT4 is a new product that allows identifying the current market phase (uptrend and downtrend ).
This indicator paints bars in different colors depending on the current state of the market trend ( Green and Red )
AH Candles MT4 is use for trading currencies
Advantages Suitable for intraday and swing trading. The indicator base on EMA method to calculate Period Parameters It can be used as a standalone tool or together with other indicators.
How to use the prod
FREE

The "Trend Edges" indicator determines whether the trend is rising or falling. It is suitable for any time frame (tested on DAX).
The indicator should be treated like Bollinger Bands, meaning that if it breaks out upwards, you can buy with a stop loss below the lower edge.
Find a trending pair, index or CFD. Additionally :
-Sound alert on trend change.
-Alert Notification
-Alert Notification on your mobile phone Check my other indicator "Trend Edges histogram"
FREE

This EA just for fun, EA high risk, full margin. Just use this for fun not for getting money. Don't injecting just lets your money gone, enjoy wait the best moment to trade in your main account.
This EA bot using CCI, RSI, MACD Just use default parameter, optimizing your RSI for another pair, please use ECN, because this EA using M1 time frame.
This EA does not have live signal, just BT and have fun. Don't get so serious, just see the grid on your screen.
FREE

Emini Trade Panel
Price - Launch Promotion: FREE - Normal Price: $50
Symbol Recommended - S&P 500 Index
Timeframe - 5 minutes
Main features - Click Button on Chart. - Auto StopLoss Mode: Previous Bar Setting - Trailing Stop ON/OFF - Active Time To Highlight Setting - Color Scheme Selection - Show Profit/Loss Label
EA Ideas - A Successful Professional Trader scalping 1 Point and use Price Action Stops. - Trade very small. The smallest you possibly can trade. - Take a look for Swing trades a
FREE

Three Sixty Dollar EA IC Market Recomment Broker
-THIS EA ONLY BUY
-only DE40 -minimum 3000$/€ ...Lot 1-5 -M1
-maximal 30min per Day Robot Worktime
Version 1 BUY only -this EA only BUY Trade only on the DE40 indices - Don't close trades the robot will close everything automatically on point. -The maximum working time of the robot is 30 minutes since the broker has a maximum of trading messages per day Test the trading news per day with your broker first with a demo account or read about it i
FREE

Информационная панель, которая выставляет уровни покупки продажи и цели для профита на текущий день. Уровни рисуются согласно движению валюты за вчерашний день. Панель вмещает в себя информацию о валютной паре, тенденции на рынке, время до закрытия бара, управление капиталом, рекомендуемый лот, профит в пунктах, а также уровни для покупки и продажи инструмента. Для заключения сделок использовать только отложенные ордера на пробой. Входные параметры Lots - установить текущий лот Risk - риск в про
FREE

The product Divergence Cci Force Stddev Ac Atr is designed to find the differences between indicators and price. It allows you to open orders or set trends using these differences. The indicator has 4 different divergence features.
Divergence types Class A Divergence Class B Divergence Class C Divergence Hidden Divergence
Product Features and Rec ommendations There are 5 indicators on the indicator Indicators = CCI, Force, Stdandard Deviation, Acelereator, Atr 4 different divergence type
FREE

Quick Close Pro by one click: * Close Buy positions * Close Sell positions * Close Win positions * Close All positions * Close All pending orders To close all positions by one click from your Telegram, please refer Master Close . Thank you! Join my channel here for more useful EAs: - Tele Notify, Price Alert, Equity Alert, Remote Algo OnOff - Auto SLTP, Close Timer
FREE

GBP INDEX
The Currency Index Project is ONE part of a thorough Forex study. Many people do not know the theoretical basis that drives currency exchange rates to move on the market. With this set of tools you will be able to have a more complete view of the entire market by analyzing not only the single currency of an exchange, but all the exchange rates that make up that currency by looking at a single window!
The indicator faithfully represents the real index of a single currency present in a
FREE

MAIN FEATURES
- Index Master is a 100% automated system. - Not martingale! Not Grid! Not Hedge! No dangerous strategies are used! - Every orders has a StopLoss and a TakeProfit. - This Expert will win and will lose but in the long run will produce a good profit with quite low temporary drawdown. - Recommended broker : low spread; low comission; not market maker: https://bit.ly/38hfs2D - No need set files . Just attach to the following charts and let it work. - Designed for US30 - USTEC and
FREE

このスクリプトを使用すると、トレンド ライン、フィボナッチ リトレースメントなど、あらゆる種類の描画オブジェクトを 1 つ以上の他のチャートにコピーできます。
デフォルトでは、スクリプトは現在のチャート (スクリプトが適用されたチャート) のすべてのオブジェクトを、現在ロードされている同じシンボルの他のチャートにコピーします。
設定
目的地の時間枠 PERIOD_CURRENT 以外に設定すると、スクリプトが適用されたチャートと同じシンボルの開いているチャートにオブジェクトがコピーされます。 値を特定の時間枠、たとえば PERIOD_D1 に設定すると、同じ銘柄と期間のチャートのみが更新されます。 CopyObjectsOfType これをコピーしたい特定のタイプのオブジェクトに設定すると、そのタイプのオブジェクトのみが他のチャートにコピーされます。 CopyIndicatorWindowObjects True に設定すると、インジケータ ウィンドウのオブジェクトもコピーされます。これは、ソース チャートと同じ指標を同じ順序で持つ 2 番目のチャートに依存します。
チャート
FREE

このインジケーターは、トレードチャート上でドンチャンチャネルを視覚的に表現するためのものです。ドンチャンチャネルは、特定の期間における最高値と最低値の間の範囲を描画するためのシンプルなテクニカルツールです。このインジケーターは、価格動向の視覚的な分析を向上させ、潜在的なブレイクアウトとトレンドの継続ポイントに関する洞察を提供します。ドンチャンチャネルは、現在の時間枠とより高い時間枠の両方に適用できるため、このオプションを有効にすることができます。 インジケーターの主な特徴: Use_System_Visuals: このパラメータを有効にすると、システムの視覚スタイルとインジケーターの外観を切り替えることができます。有効にすると、インジケーターの視覚的要素はトレードプラットフォーム全体のテーマに合わせられます。 Signal_from_HT_Timeframe: このオプションを有効にすると、より高い時間枠からのシグナルを受信できます。言い換えれば、現在の時間枠でのトレーディングの決定に影響を与えるために、より長い時間枠でのドンチャンチャネルの動作を考慮できます。 HT_Timefram
FREE

R ストップロス シグナル インジケーターは、指数移動平均に続くトレンドに基づいています。
この外国為替指標は、アクティビティ チャートに描かれた青と赤の線の形で売買シグナルを生成します。
青色の線はトレンドが上向きであることを示しており、これは通貨ペアを購入するシグナルです。 赤色の線はトレンドが下降していることを示しており、これは通貨ペアを売るシグナルです。 この外国為替インジケーターには、提案されたストップロス ラインも含まれています。
買いシグナルの場合は、ストップロスを青いストップロス ラインより 1 ピップ下に置き、それを引きずります。 売りシグナルの場合は、赤のストップロス ラインより 1 ピップ上にストップ ロスを設定し、それを下に引きます。 トレンド EMA 期間を含むデフォルトのインジケーター入力設定は、インジケーターの入力タブから直接変更できます。
基本的な取引シグナル R ストップロス シグナル インジケーターからのシグナルは解釈が簡単で、次のようになります。
買いシグナル: R ストップロス シグナル インジケーターが青い線を描き始めたら、買い取引
FREE

Pivot Mean Oscillator (PMO) is a unbounded zero-centered oscillator that provides a quick and normalized measure of divergence between two spreads. Detailed description of the mathematical formulation along with some comments and experiments can be found in this article .
Trading aspects
This version of PMO is tuned on spreads relative to Close and Open price signals against their cumulative moving average (CMA). Positive PMO(m,n) values means that last (normalized) m Close prices are higher t
FREE
Highly configurable Bollinger Bands indicator. Features: Highly customizable alert functions (at levels, crosses, direction changes via email, push, sound, popup) Multi timeframe ability Color customization (at levels, crosses, direction changes) Linear interpolation option Works on strategy tester in multi timeframe mode (at weekend without ticks also) Parameters:
Bollinger Bands Timeframe: You can set the lower/higher timeframes for Bollinger Bands. Bollinger Bands Bar Shift: Y ou can set
FREE

Necessary for traders: tools and indicators Waves automatically calculate indicators, channel trend trading Perfect trend-wave automatic calculation channel calculation , MT4 Perfect trend-wave automatic calculation channel calculation , MT5 Local Trading copying Easy And Fast Copy , MT4 Easy And Fast Copy , MT5 Local Trading copying For DEMO Easy And Fast Copy , MT4 DEMO Easy And Fast Copy , MT5 DEMO
Strongly recommend trend indicators, automatic calculation of wave standard and MT5 ver
FREE
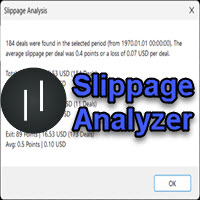
If you are using scalping strategies (or any strategy that uses stop loss orders for position closing) you need to know your slippage. Slippage is the difference between your order price and the price that your brokers uses to execute your order. This can be really different and depends on the broker as well as on the market conditions (news, trading hours, etc..) With this small script you can calculate the slippage you "paid" in points and also in your account currency. You also get average va
FREE

4 buttons for managing your trades.
Close All : will close all open positions on the current chart Delete All : will delete any pending orders on the current chart SL + 1 : will move the stop loss 1 pip closer to the breakeven point on all open trades on the current chart Delete SL : will remove the stop loss for all open positions on the current chart
Useful for everyone who opens multiple positions on the same asset, where fast execution is essential.
FREE

The indicator is based on two Moving Averages. Its only difference from traditional indicators is that it is presented as a histogram. The histogram has four colors; each color represents a MA with its own period. In case of a descending trend, if a price is lower than a moving average, the indicator displays a value lower than the red zero level. In case of ascending trend, the indicator value is higher than the green zero level. Parameters: Period MA 1 - Period of the first moving average. MA
FREE
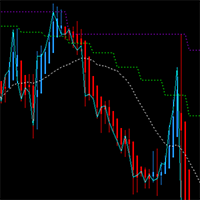
This MT4 chart trend checker cuts through the noise of market volatility to provide a clearer picture of trends and price movements. It includes the following features that can provide more clarity during market assessments: 1 customizable multi-period moving average Optional Heikin-Ashi candles 3 switchable focus modes Distinct colors for easy analysis
Link to MT5 version: https://www.mql5.com/en/market/product/106707/
This indicator shows your preferred moving average from multiple time fram
FREE

Индикатор реализован для определения классического канала движения цены, который используется на крупных биржевых площадках. Не перерисовывается Синий уровень - это уровень поддержки Красный уровень - это уровень сопротивления Белый уровень - является Pivot-уровнем Настройки Period_SEC - ввод значения периода . Примечание: Индикатор определяет уровни только на пятизначных котировках! Метод торговли: Открытие позиций осуществляется от уровней , именно на их значениях происходит отскок цены
FREE
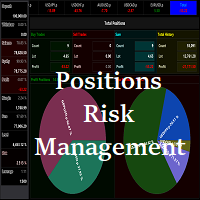
Waddah Attar Easy Positions Risk Management
This EA gives you a full ability to close one position or close all positions . Close buy or sell trades in any position . Close profit or loss position . by clicking on a command button on the chart with confirmation message . Show you a full information about your positions like : count - lots - average price - points - profit - profit % - used margin for this position and the risk percent . and also the scrolled table of trades that position has
FREE

Trades Viewer Free supports EURUSD only. Trades Viewer is a trading helper app for a serious trader. It offers several important data like day range, 22 days average range and predefined PL. It draws trades history and current open positions on a chart. It has a detail panel for viewing a particular trade with just a click on that trade. All these make it very convenient and straightforward to view your entry/exit positions and thus improve your trading system. Features Profit/loss of the curren
FREE

The Equity Curve indicator is a simple and helpful tool that shows the development of the equity curve in real time. For precision measurement, it should be used in a separate window with a period of M1.
Main features The indicator shows the development of the equity curve in real time. High precision on the minute chart. High-speed calculation. Available for MT4 and MT5. Please visit the Equity Curve indicator product page for the input and output parameters settings.
FREE

LOOK AT THE FOLLOWING STRATEGY WITH THIS INDICATOR. Triple RSI is a tool that uses the classic Relative Strength Indicator, but in several timeframes to find market reversals. 1. ️ Idea behind the indicator and its strategy: In Trading, be it Forex or any other asset, the ideal is to keep it simple, the simpler the better . The triple RSI strategy is one of the simple strategies that seek market returns. In our experience, where there is more money to always be won, i
FREE
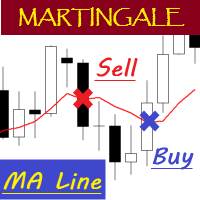
EA "MA Line" with martingale feature
To see how EA works, please watch the video below. In the video, I perform parameter optimization and do a backtest. The parameters that are optimized are: - MA Period - Stop Loss - Take Profit
For the future, I will try to optimize and test EA, especially the expert advisors in the mql5 community. hopefully it can be useful for colleagues in the mql5 community.
FREE

Easy Backtest
Backtesting your trading strategy is the most important thing which every successful trader knows very well. Easy Backtest is the perfect solution to test your new strategy in Strategy Tester in your MT4 , using all available historical data. You can place orders: BUY , SELL , pending orders with Stop Loss and Take Profit , and you can modify them at any time. You can close orders individually or all at once, and also breakeven the same like you do it in live trading. The play b
FREE

Советник Strong Storm, это робот торгующий мартином от уровней перекупленности/перепроданности. Определяет зоны по Стохастике, при грамотном ММ отличный основной робот. Реализовать с помощью этого советника можно любую торговую идею на двух Стохастиках.
Параметры TakeProfit – тейк-профит в пунктах; Magic – Мэджик ордера; Lot – размер лота; Slippege – проскальзывание; Distence – дистанция между ордерами; Mult – множитель лота; ZoneBuy – зона покупки ; Zone Sell – зона продажи; Com – ко
FREE

Trailing Even is a free complement for the Control adora Expert Adviser. It adds a trailing stop function and changes the exit level that works as stop loss if some price is reached, let's review how to make it work: First of all make sure you have the same language selected both in the Control adora Expert and in this indicator. Change of the exit level that works as stop loss with "BES" and "BEO": This function needs 2 arrows to work: 1 named BES (stands for Break Even Start) place it at the
FREE

Arlene Sessions Background is an indicator that draws colored vertical background on the chart depending on your session. You can see the version 1 here: https://www.mql5.com/en/market/product/68822 You can see more of my publications here: https://www.mql5.com/en/users/joaquinmetayer/seller If you only want to paint a session on your chart, you must set the color "none" to deactivate it.
FREE

VisualOrders and InfoAccount - an indicator for analyzing your own trading or analyzing someone else's account.
Additionally, there is a possibility to quickly obtain information on the account and the terminal. Information is placed both on the chart and in the Experts tab.
All displayed information is disabled in the settings, allowing the trader to leave only the necessary information.
FREE

This Ea is for the sole purpose of protecting your account.
When the basket of operations present in the terminals reach a set profit in currency terms, the expert will close all trades.
It will replicate the same behavior if the loss limit is reached.
It is a simple but at the same time useful expert advisor for safeguarding the account and always keeping it active.
It can be placed on any time frame or graph, the important thing is that it is inserted only once.
FREE
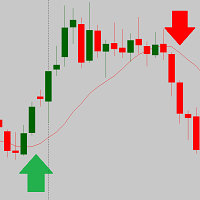
The script is based on the indicator Stochastic Oscillator.
The script draws up arrows or down arrows.
The tooltip arrows indicate the recommended price level.
The script can signal an alert, which also indicates the price level.
The script draws an up arrow when the Stochastic Oscillator lines go out of the oversold zone.
The script draws a down arrow when the Stochastic Oscillator lines out of the overbought zone.
Indicator signals are not filtered in any way - this is the classic Stocha
FREE
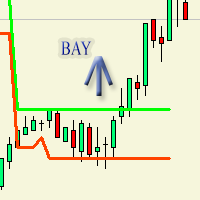
Индикатор изначально предназначался для торгового робота который в дальнейшем опубликуется. Рисует на графике флет. То-есть покой тренда. Очень отчетливо выражает флет по параметрам по умолчанию. flateWigth - допустимая ширина или разница между барами по которому индикатор будет засчитывать флет. Индикатор работает в реальном времени. Для наглядного просмотра работы можно запустить в тестере.
FREE

Forex Seeker USES THE TREND WAVE INDICATOR AND IT CAN IDENTIFY THE BEGINNING AND THE END OF A NEW WAVE TREND MOVEMENT.
AS AN OSCILLATOR, THE INDICATOR IDENTIFIES THE OVERBOUGHT AND OVERSOLD ZONES.
IT WORKS GREAT TO CATCH THE SHORT TERM PRICE REVERSALS AND USES A MARTINGALE STRATEGY TO CLOSE ALL TRADES IN PROFIT.
USE DEFAULT SETTINGS ON H1 OR HIGHER TIME FRAME ON ANY PAIR FOR MORE ACCURATE TRADES
WHY THIS EA :
Smart entries calculated by 3 great strategies The EA can be run on even a $2000
FREE
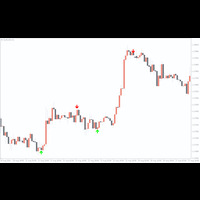
The indicator is a 15-minute signal indicator for all types of traders. Meaning, you could make lots of profits trading two different signals in one indicator.
NOTE: Both indicators are channels for achieving the same result. RED ARROW -- Sell Signal BLUE ARROW -- Buy Signal
Purchase now to be part of our community. We offer standard chart setups for both novice and intermediate traders. Trade with ease!
FREE
Displays current spread in the main window of the chart. Indicator Setting: BigDisplay =true or false to switch on and off.
DisplaySize = 20 is default
DisplayColor = Blue
Display_y = 550 position: staring position Y of background panel
Display_x = 1200 position: staring position X of background panel
Author: Happy Forex (Expert Advisor - your algorithm-driven profit, without stress or work)
FREE

RedeeCash Triangular Arbitrage Opportunities は、利用可能な通貨トライアドと各通貨取引ポジション設定をグローバル変数として次の形式で示します。
AAA/BBB、CCC/AAA、CCC/BBB: AAA/BBB -1|0|1
AAA/BBB、CCC/AAA、CCC/BBB: CCC/AAA -1|0|1
AAA/BBB、CCC/AAA、CCC/BBB: CCC/BBB -1|0|1
ここで、値は OP_BUY または OP_SELL のトレード方向です。 取引方向が -1 を示す場合、その通貨ペアの取引は発生しません。
三角裁定取引は、ヘッジが許可されなくなった米国を拠点とするアカウントに役立ちます。 実際にはより多くのアービトラージの機会があり、この指標はそれらすべての機会を取引設定の形で示しています。 グローバル変数を読み取って、どの機会を取引するかを決定する必要がありますか?
取引を開始するときは、少なくとも 200 PIPS のテイク プロフィットを使用する必要があります。そうしないと、取引がテイク プロフィット値なしで開
FREE

Commodity Channel Index and Moving Average [CCI MA] A combination of CCI and MA to create a crossover trading setup Input parameters: signal mode: set it to true if you want to plug it into STAT (Signal Tester and Trader) arrow shift: distance between fast EMA line to arrow on chart price line filter CCI period CCI price method Moving average period Averaging method upper level lower level You can find the best setting for 4 hour EURUSD on this video
FREE
MetaTraderマーケットは、他に類のない自動売買ロボットやテクニカル指標の販売場所です。
MQL5.community ユーザーメモを読んで、取引シグナルのコピー、フリーランサーによるカスタムアプリの開発、支払いシステムを経由した自動支払い、MQL5Cloud Networkなど、当社がトレーダーに対して提供するユニークなサービスについて詳しくご覧ください。
取引の機会を逃しています。
- 無料取引アプリ
- 8千を超えるシグナルをコピー
- 金融ニュースで金融マーケットを探索
新規登録
ログイン