MetaTrader 4용 Expert Advisor 및 지표 - 44

Esse indicador mede o 1º Canal de referencia e a 1º Zona Neutra * configurar o canal macro para verificar a frequencia MAIOR H1 H4 1D * configurar o canal micro para verificar a frequencia Menor 1M 5M 15M Como instalar o Indicador fimathe. E uma pré mentoria tem uma estrategia Secreta bonus nesse video . assitao o video para enteder as logicas que podemos iniciar com esse indicador.
https://www.youtube.com/playlist?list=PLxg54MWVGlJzzKuaEntFbyI4ospQi3Kw2
FREE

AdvaneZigZag Indicator
Are you tired of the limitations of the traditional ZigZag indicator? Meet AdvaneZigZag, the ultimate tool to simplify your market structure analysis and enhance your trading strategies. Designed with flexibility and precision in mind, AdvaneZigZag brings you advanced features to navigate the market with confidence.
Key Features:
1. Enhanced Flexibility:
- While maintaining the familiar simplicity of the conventional ZigZag indicator, AdvaneZigZag offers superior a
FREE
Hello friends. I wrote this utility specifically for use in my profile with a large number of Expert Advisors and sets ("Joint_profiles_from_grid_sets" https://www.mql5.com/en/blogs/post/747929 ). Now, in order to limit losses on the account, there is no need to change the "Close_positions_at_percentage_of_loss" parameter on each chart. Just open one additional chart, attach this utility and set the desired percentage for closing all trades on the account. The utility has the following function
FREE

Currency Explorer is the absolute tool for traders that want to know with quantified certainty the currency strength & weakness of each currency and to trade these by using applicable strategies. Our machine learning models run and provide the strength/weakness of each currency based on multiple factors besides price action. It provides the trader with a QUANTIFIED result for the strength of the 8 most popular and major currencies (EUR, USD, JPY, GBP, AUD, NZD, CAD and CHF) with a scale from 0-1
FREE
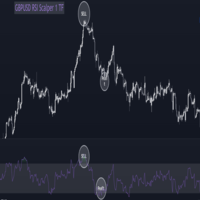
What is RSI:-
RSI stands for Relative Strength Index, which is a popular technical indicator used in financial markets, particularly in the analysis of stocks, commodities, and other securities. RSI is used by traders and investors to assess the strength and potential direction of price movements in an asset. Here's how RSI works: Calculation : RSI is calculated using a formula that takes into account the average gain and average loss over a specified period (typically 14 periods). The formula
FREE

MetaTrader 유틸리티 MTI(주 거래 정보) – 거래자에 대한 기본 거래 정보, 즉 다음을 표시합니다. 평균 및 현재 스프레드 크기 숏 포지션과 롱 포지션을 위한 스왑 사이즈 1 거래 로트에 대해 1핍의 비용 스톱 레벨 크기(대기 주문을 위한 최소 거리) 현재(빨간색) 종료까지의 시간 및 다음(회색) 거래 시작까지의 시간 현재 거래 세션이 끝날 때까지의 시간은 빨간색으로 표시되고 다음 세션이 시작될 때까지의 시간은 회색으로 표시됩니다. 색상은 표시기 속성에서 독립적으로 조정할 수 있습니다. 추천 로봇 스캘퍼 - https://www.mql5.com/en/market/product/77108
디스플레이는 다음과 같이 수행됩니다. 유럽 무역 세션(EU 깃발) 미국 무역 세션(미국 국기) 오세아니아 무역 세션(호주 국기) 아시아 무역 세션(일장기) 거래 세션의 종료 시간과 변경 시간을 아는 것이 중요합니다. 거래 세션이 끝날 때까지 많은 트레이더가 자신의 포지션을 고정
FREE

Similar to logic used in: Golden MA MTF TT Overview
"Golden MA" indicator for OB/OS levels. It's based on High/Lows of higher timeframe (HTF) previous bar. Only useful in swing trading or scalping. Best for at least M15+. For lower timeframes you'll need to change StartPips to lower value to get consistent lines. Because lower timeframes will have smaller pip distances. Features - Define Higher Timeframes for Current Timeframe: Use a comma-separated list to define the higher timeframe for th
FREE
Highly configurable Moving average indicator.
Features: Highly customizable alert functions (at levels, crosses, direction changes via email, push, sound, popup) Multi timeframe ability Color customization (at levels, crosses, direction changes) Linear interpolation option Works on strategy tester in multi timeframe mode (at weekend without ticks also) Parameters:
MA Timeframe: You can set the lower/higher timeframes for Ma. MA Bar Shift: Y ou can set the offset of the line drawing. MA Period,
FREE

Session Killzone Indicator
Indicator that helps you to identify the killzone times of both London and NewYork sessions which usually is the most times for high volatility and taking liquidity from the market. Killzone times are configurable through indicator parameters. The indicator adjusts the range of the killzones based on the daily trading range.
FREE

FUNDING DEVIL INDICATOR has been developed by traders for traders and is not another combination out of existing indicators or a "magic, solve all situations" tool.
PASS THE FUNDED ACCOUNTS WITH IT.
It is the answer for beginners and experienced traders about the misleading concepts of the mainstream, causing 90% of retail traders, never making a living out of trading.
Successful traders are "following the smart money" and do NOT try to catch every move from start to end. Consistent traders
FREE

The indicator displays the size of the spread for the current instrument on the chart. Very flexible in settings. It is possible to set the maximum value of the spread, upon exceeding which, the color of the spread label will change, and a signal will sound (if enabled in the settings). The indicator will be very convenient for people who trade on the news. You will never enter a trade with a large spread, as the indicator will notify you of this both visually and soundly. Input parameters: Aler
FREE
Highly configurable Williams %R indicator. Features: Highly customizable alert functions (at levels, crosses, direction changes via email, push, sound, popup) Multi timeframe ability Color customization (at levels, crosses, direction changes) Linear interpolation and histogram mode options Works on strategy tester in multi timeframe mode (at weekend without ticks also) Adjustable Levels Parameters:
Williams %R Timeframe: You can set the current or a higher timeframes for Williams %R. Williams
FREE

MoneyNeverSleeps MoneyNeverSleeps is a fully automated scalping Expert Advisor. It trades by the channel breakout strategy. You will not need to fine tune this EA. It uses smart algorithms to adapt to market. No standard indicators. No martingale. No grid trading. No arbitrage. No curve fitting according to backtest results. Stops are tight. Requirements Minimum balance is $200 Timeframe M30 and H1 More balance, more trades, better performance. Parameter cSecond - line of same indicator MaxOrder

このEAは、NinjaPlatformの無料のサンプル版です。
まず、 NinjaPlatformの説明をします。 NinjaPlatformは、お客様が自由にソースコードをいじって勝てる売買ロジックを構築できるEAのプラットフームです。 次のように思っておられる客様は、是非 NinjaPlatform をご検討下さい。
投資はギャンブルであるので、やるなら大きく勝ちたい。 勝つ自動売買プログラムを自分で創ってみたい。 勝つための理論や手法を学びたい。 お客様が勝てる売買ロジックを構築するために、 NinjaPlatformがサポート出来る事は、以下です。 1.豊富な売買ロジックやひな型が準備してある。お客様は、それらを簡単に微調整・変更・新規作成できる。 具体的には、 オープンロジックとして、一目均衡表/HULL移動平均/MACD/ AlligatorTrend/RCI/RCI_3line/STO/RSI/DMI/ Accelerator/ ボリジャーバンド/PIVOT/ ParabolicSAR/疑似グランビルの法則/疑似SinglePenetrationなどを用いた、1
FREE

Profits are on the way! This indicator is SO SIMPLE… when the red Drop Coming arrow appears, a price drop may be on the way! When more than one "Drop Coming" signal appears on a bull run, that means the drop is getting closer. HOW TO USE 1. When the red "Drop Coming" arrow appears, a price drop may be on the way! To get the best setting it's a matter of tweaking the indicator until it gives you the best results. Our recommendation, and what our traders do is open their chart and move the input n

You’ll love how you can receive alerts to your email and SMS when the candles turn green or red signifying the best buy and sell times in correlation to confirmed uptrends and downtrends. TO USE 1. Buy when green candles appear - this represents an uptrend. 2. Sell when red candles appear - this represents a downtrend. EXTRA FEATURE This indicator NEVER repaints so when a candle closes, that color is final. Also, the blue trend lines in the photos are not included, this is to demonstrate the pri
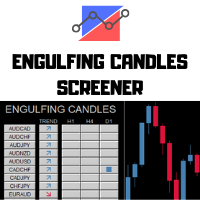
---> Check all the other products <---
The Engulfing Candles Screener is a deeply customizable dashboard.
You can chose a trend filter, using 2 EMAs, with custom periods applied on a custom TimeFrames Then you can choose 3 timeframes to search, any TimeFrame is suitable and the screener will find the engulfing candles in the selected timeframe. 3 Timeframes to scan All the major forex pairs and crosses - up to 28 symbols Deeply Customizable
How to setup the screener:
Let the crosses visib

This scanner shows the trend values of the well known indicator SuperTrend for up to 30 instruments and 8 time frames. You can get alerts via MT4, Email and Push-Notification as soon as the direction of the trend changes. This is the FREE version of the indicator: SuperTrend Scanner The free version works only on EURUSD and GBPUSD!
Important Information How you can maximize the potential of the scanner, please read here: www.mql5.com/en/blogs/post/718074
With the following FREE indicator you c
FREE

Overview No Nonsense ATR is a tool designed to help the No Nonsense Forex Traders backtest strategies and trading in real time.
The indicator calculates the value of the Stop Loss and the Take Profit (SL/TP) based on the ATR (Average True Range) allowing to verify the historical data in a simple and practical way, showing not only the SL/TP values but also the place where they would be and if it was a gain or loss. The No Nonsense ATR also calculates the trading volume required for each trade a
FREE

McS Super Trend -This is one of the most popular classic trend indicators. It has a simple setting, allows you to work not only with the trend, but also displays the stop loss level, which is calculated by this indicator. Benefits:
Instruments: Currency pairs , stocks, commodities, indices, cryptocurrencies. Timeframe: М15 and higher. Trading time: Around the clock. Shows the direction of the current trend. Calculates the stop loss. It can be used when working with trading. Three types of not
FREE

- We all want to have the lowest spread and never high, with this utility we can have more information and a clearer idea of when the spread is acceptable or not. The Panel InfoSpread is a utility expert advisor and shows information on different spread options in one or more symbols, can be actual spread, average, minimum, maximum and tick counter. Read and show the symbols that are in the Market Watch window. Also you can put a maximum limit of average spread in every symbol for know when

Free informative Indicator-helper. It'll be usefull for traders who trade many symbols or using grid systems (Averaging or Martingale). Indicator counts drawdown as percent and currency separate. It has a number of settings: Count deposite drawdown according equity value and send e-mail or notifications to user if DD more than set; Sending e-mail when max open orders reached; Shows price and remaining pips amount before MarginCall on current chart and Account generally; Display summary trade lot
FREE
TimeZone In Chart - MT4 맞춤형 시간대 수평 스케일 개요 TimeZone In Chart - MT4 맞춤형 시간대 수평 스케일 지표를 소개합니다. 이 유틸리티 도구는 원하는 시간대에 맞춰 수평 시간 스케일을 사용자 정의하여 거래 경험을 향상시키도록 설계되었습니다. 다양한 시간대에 맞춰 거래 활동을 조정해야 하는 트레이더에게 이상적이며, 지정한 GMT 오프셋에 따라 시간을 변환하고 표시하여 중요한 순간을 놓치지 않도록 합니다. 주요 기능 맞춤형 시간대 지원 : GMT_Offset 매개변수를 사용하여 표시된 시간을 원하는 시간대로 조정하여 거래 요구에 맞는 올바른 시간대를 차트에 반영할 수 있습니다. 동적 업데이트 : 실시간 거래 조건에서 수평 시간 스케일을 동적으로 업데이트하여 항상 최신 정보를 제공합니다. 백테스트 호환성 : 백테스트 중 각 새로운 캔들에서 자동으로 업데이트되어 정확한 역사적 데이터 분석을 제공합니다. 사용자 정의 가능한 외관 : 색상, 글꼴 유형
FREE
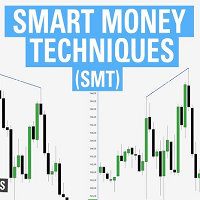
ICT SMT divergence represent a situation in the market where two correlated assets, being seen within the same timeframe, exhibit opposing structure. This can be seen in two positively correlated assets, as one asset forming a higher low, while the other forming a lower low instead of higher low. Version 1.03: Add Higher Timeframe support An ICT SMT divergence serves as the primary signal of reversal for correlated assets. If two positively correlated assets are moving higher and at a point one

NOTE!: The trend vote and the buy sell option shall match to the same direction before you put a trade!!
Indicator that uses Kalman filters (same as used on autonomous vehicles for data fusion between different sensors / technologies such as RADAR, LIDAR and Camera with Artificial Intelligence for object detection) by using the high and low price in order to identify buy and sell signals as indicated on the graph.
This indicator can be used on any timeframe with any currency or symbol.
This i
FREE

The principle of this indicator is very simple: detecting the candlestick pattern in M30 timeframe, then monitoring the return point of graph by using the pullback of High-Low of M5 Candlestick and finally predicting BUY and SELL signal with arrows, alerts and notifications. The parameters are fixed and automatically calculated on each time frame. Example:
If you install indicator on XAUUSD, timeframe M5: the indicator will detect the reversal, pullback, price action on this timeframe (for exa
FREE

An indicator for visualizing time ranges of key trading sessions: Asian, European, and American. The indicator features functionality for setting the start and end times of each trading session, as well as an adjustable timezone of the trading server. The main advantages of the indicator include the ability to operate with minimal CPU load and memory usage. Moreover, it offers the option to specify the number of displayed historical days, providing the user with flexible market dynamics analysis
FREE
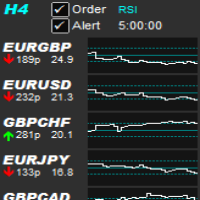
Allows symbols/currency pairs to be ordered based on a configured indicator, with the best performing symbols shown at the top. This helps you to select the symbol with better prospects from a given list of symbols. Can optionally alert when a symbol moves into the top two (configurable). Also shown is the number of pips that the symbol has moved in its current direction, allowing you to tell if you've 'missed the boat'. Further, a graph is shown, per symbol, of the indicator value over time all

Small free indicator to detect certain chart patterns, shoulder head shoulder / reverse, triple top / bottom, cup, flags and others... I designed it a while ago, it detects figures in m1, m5, m15, m30 and h1.
I hope it will be useful to you because I don't trade much with this indicator, I have a few others that I will try to put online quickly maybe you will find it useful, good Trade friends.
FREE

TH3ENG CURRENCY STRENGTH SCANNER The best currency strength reader based on more than 4 excellent modes, based on Price action and Volume with various algorithms. This indicator reads all pairs data to measure and find the best results of all currencies and arrange it in a separated dashboard panel.
You can find the strongest currency and the weakest currency, then trade on them pair. NOT COPLICATED NOT REPAINTING NOT LAGING
Input Parameters
=== SYSTEM SETTING === Calc. Mode ==> Calculation m
FREE

New Support and Resistance Indicator with Probabilities and Alerts Description: Maximize your profits with the newest Support and Resistance indicator! Our indicator automatically calculates support and resistance levels based on 24-hour analysis periods and provides detailed probabilities for each level. Additionally, you can set up custom alerts to be notified when the price touches specific levels, directly on your mobile device. Features: Support and resistance analysis based on hourly data
FREE

Dear Friends,
Please rate this application for the better
Optimal Lot Size Calculator is a Utility tool to calculate the optimal lot size based on your risk percentage on your capital amount. Also you can set your reward Percentage and place your order from the tool itself. You can place all types of orders(Market orders,Limit orders and Stop orders) with stop loss in pips or price level. So will save your time and also easy to place orders with your risk management.
For Limit and Stop ord
FREE

Forex Trade Manager Grid MT4 helps you to managing orders and achieve the goal. You only need to place first order with Take Profit, run EA and set in params profit (pips) you want to get. EA will be managing your positions, as will gather appointed amount of pips. It’s a strategy for management of manual trades opened on current pair. The strategy adds positions to currently opened trades in a grid management (with chosen distance in pips between trades) - up to 15 trades (or less). First up to
FREE

EA는 수익성 있는 포지션을 검색하고 마감함으로써 수익성 없는 포지션을 마감할 수 있습니다 .
이 조수는 모든 직위 중에서 터미널에서 가장 수익성이 낮은 직위를 찾습니다 . 또한, 나머지 수익성 있는 포지션을 검색하여 하나 이상의 포지션의 이익이 다른 포지션의 손실보다 클 때 손실을 보상할 수 있는 일련의 포지션을 계산합니다. 그러한 포지션 세트가 발견되면 고문은 해당 포지션을 닫습니다. 일련의 위치는 절대적으로 모든 위치로 구성될 수 있습니다. 최대 수는 조언자 설정에서 조정 가능합니다. 검색 시 최소 손실 금액과 마감 시 추가 이익을 지정할 수도 있습니다. MT5 버전
전체 설명 구입 방법
설치하는 방법
로그 파일을 얻는 방법 테스트 및 최적화 방법 Expforex의 모든 제품 전략 테스터에서 Expert Advisor를 테스트하고 시각적 모드에서 EAPADPRO 도구 모음을 사용하여 거래할 수 있습니다! 차트에서 Cl
FREE

Bollinger Bands Breakout Alert is a simple indicator that can notify you when the price breaks out of the Bollinger Bands. You just need to set the parameters of the Bollinger Bands and how you want to be notified.
Parameters: Indicator Name - is used for reference to know where the notifications are from Bands Period - is the period to use to calculate the Bollinger Bands Bands Shift - is the shift to use to calculate the Bollinger Bands Bands Deviation - is the deviation to use to calculate t
FREE

Scalp Master Pro. Scalp Master Pro is a cutting-edge Expert Advisor (EA) designed for traders who want to scalp the markets with precision and confidence. Built with advanced ATR-based strategies, this EA dynamically adjusts to market conditions, ensuring optimal managing risk effectively. Whether you're a beginner or an experienced trader, this EA simplifies managing trades and incorporating smart spread adjustments for better execution. Advantages of Scalp Master Pro: Risk Management : Inco
FREE

CFN - Multi MA & EMA Indicator for MT4 – with Alerts Enhance your technical analysis with the Multi MA & EMA Indicator – a powerful tool designed for traders who rely on Moving Averages and Exponential Moving Averages to spot trends, entries, and exits. Key Features: Supports up to 5 Moving Averages (MA) & 5 Exponential Moving Averages (EMA):
Plot multiple MAs and EMAs simultaneously on your chart, fully customizable with individual periods. Custom Colors & Styles:
Each MA and EMA l
FREE

Bullish Scalper EA - Your Go-To Expert Advisor for Bullish Day Trading scalping in MetaTrader 4!
Automate your trading on any forex trading crypto trading indices scalping or even swing trading or stocks trading in every strategy from fast scalping trading to swing trading
the ea will not limit the digit number of trailing loss and spread so basiclly you could use it so secure profit of long hold
Special price of 45$ will be back to 299$ soon!! Please leave a 5 star***** rating if you like

The "M1 scalping signal" is a scalping indicator designed for the M1 timeframe. The indicator displays arrows on the chart indicating price reversal points. A red arrow indicates a price reversal to a sell position, while a green arrow indicates a price reversal to a buy position. It can be used on all currency pairs. Advantages: No Redrawing: The indicator does not redraw signals on historical data, ensuring stable analysis. Ease of Use: It is easy to configure and visualizes important reversal

1. 이 주문 시스템 은 로 컬 주문 시스템 입 니 다. 즉, 발사 단 과 수신 단 은 반드시 같은 컴퓨터 에서 조작 해 야 합 니 다. MT4 / 5 계 정 은 여러 대의 컴퓨터 에서 동시에 로그 인 할 수 있 기 때문에 계 정 비밀번호 만 읽 고 고객 에 게 보 내 면 주문 할 수 있 습 니 다.로 컬 주문 서 는 네트워크 주문 과 관련 이 없 기 때문에 속도 가 빠 르 고 매우 안정 적 입 니 다.
2. 현재 발사 단 입 니 다. 도표 에 불 러 오 면 정상적으로 작업 할 수 있 습 니 다. 또한 수신 단 을 설치 하여 주문 서 를 받 은 다음 매개 변수 목록 에 발신인 mt5 계 정 을 입력 해 야 합 니 다.
3. 하나 가 많 고 하나 가 많 으 며 하나 가 많 음 을 지원 합 니 다. 컴퓨터 가 여러 개의 MT4 / MT5 를 실행 할 수 있다 면 몇 개의 주문 서 를 실행 할 수 있 습 니 다. 같은 플랫폼 은 설 치 된 폴 더 를 복사 하여 여러 개의 계 정 을
FREE

Indicator Description If you need to know future volatility for trading, this indicator is what you need! With the Predictor of the ATR you trading system will be more perfect. This indicator predicts future volatility, and does it quite well. Prediction accuracy is up to 95% at a distance of up to 5 bars into the future (on the period H1). The average forecast accuracy is about 85%, the number of predicted bars is limited by your imagination only. There are five methods used for prediction. The
FREE
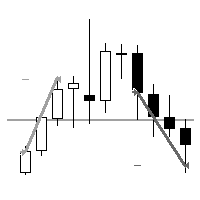
"AV Level EA" is an Expert Advisor for the MetaTrader 4, which is intended exclusively for the german DAX (DE40, GE40, etc.) and is also available as a free version with MinLot to try out.
NEW: More ways to close, third entry.
Strategy:
- Level Trading, DAX M15 (also M5 or M30)
- Entry: Buy level 75, sell level 25
- Exits: TP = 25 (i.e. approx. 00 level) or TP = 50 (buy 75 level, sell 25 level)
- Second entry in the event of a reset, distance e.g. 25 or 50 (it does not take place with 0)
FREE
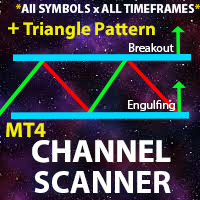
** All Symbols x All Timeframes scan just by pressing scanner button ** *** Contact me to send you instruction and add you in "Channel Scanner group" for sharing or seeing experiences with other users. Introduction: The Channel pattern is described as the area located between two trend lines. This area is used for a measure of a trading range. In this case, the upper trend line connects price highs while the lower trend line connects price lows. Also when it comes to breakout points, it helps t

This is diamond! Contact me to send you instruction and add you in group.
Diamond Pattern is based on Read The Market(RTM) concepts. The purpose of this model is to face the big players of the market (financial institutions and banks), As you know in financial markets, big traders try to fool small traders, but RTM prevent traders from getting trapped. This style is formed in terms of price candles and presented according to market supply and demand areas and no price oscillator is used in it.

One-Click Close All – Instantly Exit All Trades in MT4 Take control of your trades with One-Click Close All , a powerful MT4 script designed for fast market exits. With a simple drag-and-drop action, you can close all open orders instantly—no more manually closing trades one by one. Key Features: Instant Order Closure – Exit all open trades with a single click, perfect for volatile markets.
Drag & Drop Simplicity – No complex steps—just drop the script onto your chart to execute.
Essen
FREE

CCI Currency Strength Meter uses CCI (Commodity Channel Index) to monitor how strong a currency is, or in other words, if it's being bought or sold by the majority compared to the other currencies. If you load this indicator on a chart, it will first display the strength-lines of the currencies (base and counter currency of the chart) with changeable solid lines. Also, you can add up to five additional currencies to the "comparison pool," that already has the base and the profit (counter) curren
SmartDataExportEa – MetaTrader 4를 위한 최고의 데이터 내보내기 도구
EA 설명 SmartDataExportEaMT4는 MetaTrader 4 전용 데이터 내보내기 툴입니다. 이 EA는 매매를 수행하지 않고, 시장 데이터와 주요 지표 값을 CSV 형식으로 내보내는 데 특화되어 있습니다. 데이터 분석이나 전략 개발을 효율화하고자 하는 트레이더나 개발자에게 적합한 도구입니다.
실시간 분석과의 병행 실시간으로 CSV를 출력할 경우 CSV 파일이 잠겨, EA를 구동하면서 동시에 분석하기가 어려워집니다. 이를 해결하기 위해 본 도구는 일부러 “과거 데이터를 실시간에 가깝게 가져오는” 방식을 채택하여 CSV 파일이 잠기지 않도록 했습니다. 그 결과 유사 실시간 분석이 가능해집니다.
주요 특징 항목 상세 기능 과거 데이터와 주요 지표 값을 CSV로 내보낼 수 있음. 대응 통화페어 MetaTrader 4에서 사용 가능한 모든 통화페어 및 심볼에 대응. 대응 차트
FREE

FREE

The advisor is based on a grid strategy and order averaging, is universal and can work on any currency pairs, depending on the settings, it is important to find out the range of price fluctuations for a specific currency bet over the last 2-3 months. During important news, it is recommended to set a high timeframe. The advisor has clear and easily manageable settings; you can configure the accuracy of averaging, the number of orders after which the martingale will work, and limit the number of
FREE


스타일이 중요하기 때문에 매번 속성을 클릭하여 초의 색상을 변경하고, 배경을 밝거나 어둡게 만들고, 격자를 삽입하거나 제거하는 것이 얼마나 성가신 일인지 압니다. 클릭 한 번으로 해결하는 방법은 다음과 같습니다. 트레이더가 원하는 캔들 스타일을 선택할 수 있는 3개의 맞춤형 버튼. 낮과 밤 모드 사이를 전환하는 버튼입니다. 차트에서 그리드를 표시하거나 숨기는 버튼입니다. *****설정에서 화면에서 버튼을 표시할 위치를 선택할 수 있습니다.**** 내 다른 제품도 확인하십시오 https://www.mql5.com/en/users/javimorales.fer/seller MT5 버전 확인: https://www.mql5.com/en/market/product/69070 RSI 지표는 무엇입니까? RSI는 0에서 100까지 측정할 수 있는 오실레이터로 표시됩니다. 이 지표는 J. Welles Wilder Jr.가 개발했으며 1978년 그의 저서 New Concepts in Technica
FREE

Divergence Convergence MACD is based on the classical divergence and convergence methods of charting. Divergence is when we get higher highs and lower lows on our uptrend but which are not supported by our indicator which makes lower highs and therefore signals the underlying momentum is failing and so a reversal might occur. Vice versa for downtrend. Convergence is when the higher highs and higher lows of an uptrend are also confirmed by our indicator making lower lows which helps us confirm th
FREE

The utility is designed to open Buy and Sell market orders and close all positions. Opening and closing positions by pressing the hot key. How to open and close positions with voice using the utilities of this type, see in the video under the description. https://www.youtube.com/channel/UCTpVWJkEic6TzoXr0qc9RIw/featured The keys "1", "2", "3", "4", "5", "6", "7", "8", "9", "0" send a request to open Buy orders with predefined values Lot , Take Profit, Stop Loss, Magic. The keys "Q", "W", "E", "
FREE
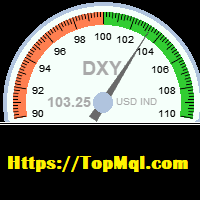
This indicator is used to calculate the dollar index according to the formula of currency pairs(EURUSD ,GBPUSD,USDJPY,USDSEK,USDCHF,USDCAD)Even if the broker does not have the dollar symbol. this Indicator displays the dollar index chart in a separate window at the bottom of the chart. It also displays the current dollar index graphically. In this indicator, it is possible to set the minimum and maximum value of the indicator as well as its size scale on the chart as an input parameter, and it
FREE

Your own copy system MT4 signal provider via Telegram Telegram isn't just for sending and receiving chat messages. It's also for automating your work flow. The combined use of MetaGram and Telegram bots allows you to send, receive and manage messages and even get your own copying system. Sharing trades with your subscribers is now such a simple process with this easy-to-use MetaGram app for MT4. Once you have connected MetaGram to your trading account and Telegram, your trades are sent immediat
FREE
The Manual Strategy Tester Assistant Expert Advisor is a powerful tool designed to assist traders in testing their strategies manually using the Strategy Tester in MetaTrader 4. This expert advisor provides a user-friendly panel with intuitive controls to set orders, calculate lot size, manage risk, and monitor account balance and equity directly on the chart. Key Features: User-friendly panel with 5 buttons for easy navigation and control. Risk management functionality: Set the desired risk am
FREE

First of all, it is worth highlighting here that this Trading Indicator is Non Repainting, Non Redrawing and Non Lagging, which makes it ideal for manual trading. Never repaint and recalculate Once an arrow appears it never disappears, the signal comes at the opening of the new candle You will now be more profitable with this indicator The indicator will alert you when an arrow appears You can do swing trading or scalping trading The indicator helps you identify the trend Can be optimized acros

VR Assistant Charts — 이는 MetaTrader 거래 터미널 창에서 그래픽 개체로 작업하는 거래자를 위한 편리한 도구입니다. 이 프로그램을 사용하면 한 번의 마우스 클릭으로 MetaTrader 터미널에서 추세선, 피보나치 수준, Gann 팬 및 기타 그래픽 요소의 색상, 스타일, 두께 및 기타 특성을 변경할 수 있습니다. 설정, 세트 파일, 데모 버전, 지침, 문제 해결 등은 다음에서 얻을 수 있습니다. [블로그]
다음에서 리뷰를 읽거나 작성할 수 있습니다. [링크]
버전 [MetaTrader 5] 이 유틸리티는 그래픽 개체를 사용하여 금융 상품을 분석할 때 거래자의 단조로운 작업을 크게 촉진합니다. 모든 작업은 차트에서 직접 컴퓨터 마우스를 사용하여 수행됩니다. 이 프로그램은 MetaTrader 4 및 MetaTrader 5 거래 플랫폼에 대한 기술 지표 형태로 구현되므로 다른 지표, 조언자 및 스크립트와 동시에 사용할 수 있습니다. 제어는 컴퓨터 마우스를 사용
FREE

SR is a support and resistance indicator, it shows major highs and lows by different colors. The color of a level is changing if the last high or low are touching it. After the closing of a bar above or below level, it will delete it. extern inputs: loop for candles / colors / drawing time *This indicator signal is not perfect and have to be used with other market analysis and confirmations.
FREE
STARGOGS RED SNAKE EA V1.6 IS A FREE EA THIS EA WORKS ON ALL CURRENCY PAIRS, ALL INDICES & METALS THE ROBOT TAKES ONE TRADE AT A TIME NO MARTINGALE NO GRID LOTSIZE MULTIPLIER CAN BE TURNED OFF IN SETTINGS EA HAS THE FOLLOWING: - MACD INDICATOR WITH ADJUSTALBE PARAMETERS - EA opens a Buy when Main Macd crossing The Signal line upwards with TP and SL - EA opens a Sell when Main Macd crossing The Signal line downwards with TP and SL - Scalping.... - Adjustable TP & SL - Adjustable Lotsize - EA
FREE

Данный советник предназначен для контроля просадки по символу, на который он установлен. В работу советник вступает когда открыта позиция тем объемом (лотом), который указан в настройках советника. Советник не осуществляет торговых операций по открытию позиций, только закрытие открытых позиций по символу, на который он установлен при соблюдении определенных условий! В советнике реализовано три уровня работы. Каждый уровень привязан к конкретному магическому номеру. В настройках советника необхо
FREE

The indicator uses the Chester W. Keltner's channel calculation method, modified by the well-known trader Linda Raschke. Due to the modification, the calculated channel contains a much more complete overview of the price movements, which allows increasing the probability of an accurate prediction of the upcoming price movement. Unlike the classic Keltner method, the base line of the channel is plotted based on the Exponential Moving Average, and the Average True Range is used to calculate the up
FREE

This indicator is designed for binary options. Based on proprietary divergence of the CCI indicator. A sell signal: A down arrow appears on the chart. A buy signal: An up arrow appears on the chart.
Input parameters History - the number of bars in history for calculation Period CCI - period of the CCI technical indicator Up border - overbought limit for calculation of the divergence Down border - oversold limit for calculation of the divergence Price - price for the indicator calculation Alerts
FREE

This EA trades the forex markets by a specific combination of ATR and parabolic SAR indicator signals and transaction management. the EA has stop loss and take profit. minimum trading account 500.
default settings for GBPUSD 1h. settings for optimization: ATRperiod lot sarStep sarMaximum tpFactor slFactor this EA(){ operates once per bar; fast methods of optimization are valid(){ user can optimize by model (control point); || (open prices only); }}
developed, tested and optimi
FREE

Bollinger Breakout Trader tells the trader when the market is about to breakout from a non-volatile period. Non volatility usually means its building up steam for more good moves in future. A signal is formed when this switch from non-volatile to volatile occurs. These periods are measured by both Bollinger Bands and Keltner Channels. Bollinger Bands measure the standard deviation of price from the Moving Average which results in an expanding and contracting channel. Keltner Channels are based o
FREE

This indicator helps you to scan symbols which are in the Market Watch window and filter out a trend according to RSI.
The relative strength index (RSI) is a technical indicator used in the analysis of financial markets. It is intended to chart the current and historical strength or weakness of a stock or market based on the closing prices of a recent trading period. The indicator should not be confused with relative strength. The RSI is classified as a momentum oscillator, measuring the veloci
FREE

IceFX Heatmap is a special indicator that shows the places where the price has been staying and ranging over the past few days. These sites will be displayed in a "Heatmap style", with which you can clearly see the main formed bands. The main rates (where the price has "lingered/stayed" much) are indicated in bright colors (in case of black-and-white view) or red color (in case of color view).
Settings Days - the number of days the heat(map) is calculated for. Resolution - resolution rate. 10 =
FREE

Signals and Alerts for Accelerator/Decelerator indicator based on these MQL5 posts: Accelerator Oscillator and Signals of the Indicator Accelerator Oscillator . Note : this tool is based on the code of Accelerator indicator developed by MetaQuotes Software Corp.
Features The signals are triggered at closing of last bar/opening of a new bar; Any kind of alerts can be enabled: Dialog Box, Email message, SMS notifications for smartphones and tablets, and Sound alerts; Customizable arrows. By d
FREE

ATR Volatility plots the ATR-based volatility, and triggers alerts when it crosses user-defined upper and lower thresholds (purple and tan lines, please see screenshots). Circles are painted when ATR volatility crosses either above the upper threshold, or below the lower threshold. This is a small tool custom-built by our group, by specific request of one of our customers. We hope you enjoy! Do you have an indicator you would like to see designed? Feel free to send us a message! Click here for m
FREE

Stochastic RSI makes a stochastic calculation on the RSI indicator. The Relative Strength Index (RSI) is a well known momentum oscillator that measures the speed and change of price movements, developed by J. Welles Wilder.
Features Find overbought and oversold situations. Sound alert when overbought/oversold level is reached. Get email and/or push notification alerts when a signal is detected. The indicator is non-repainting. Returns buffer values for %K and %D to be used as part of an EA . (s
FREE
트레이딩 전략과 기술 지표를 판매하기에 가장 좋은 장소가 왜 MetaTrader 마켓인지 알고 계십니까? 광고나 소프트웨어 보호가 필요 없고, 지불 문제도 없습니다. 모든 것이 MetaTrader 마켓에서 제공됩니다.
트레이딩 기회를 놓치고 있어요:
- 무료 트레이딩 앱
- 복사용 8,000 이상의 시그널
- 금융 시장 개척을 위한 경제 뉴스
등록
로그인
계정이 없으시면, 가입하십시오
MQL5.com 웹사이트에 로그인을 하기 위해 쿠키를 허용하십시오.
브라우저에서 필요한 설정을 활성화하시지 않으면, 로그인할 수 없습니다.