Guarda i video tutorial del Market su YouTube
Come acquistare un Robot di Trading o un indicatore
Esegui il tuo EA
hosting virtuale
hosting virtuale
Prova un indicatore/robot di trading prima di acquistarlo
Vuoi guadagnare nel Market?
Come presentare un prodotto per venderlo con successo
Indicatori tecnici a pagamento per MetaTrader 5 - 64
Triple EMA Trend Following + Signals indicator is a tool for traders who are looking for accurate trend identification and buy/sell signals! Key Features: Triple EMA Trend Analysis: This indicator uses two Triple Exponential Moving Averages (TEMA1 and TEMA2) to capture short-term and long-term trends effectively. TEMA1 reacts to rapid price changes, while TEMA2 filters out market noise, helping you stay on the right side of the trend. RSI and ATR Filters: It incorporates the RSI (Relative Streng
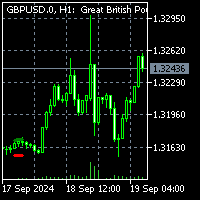
To get access to MT4 version please click here . This indicator is not a standard indicator and you may get into trouble installing it. Please contact via private chat if you face trouble. This is exact conversion from TradingView: "Consolidation Zones - Live" by "LonesomeTheBlue". This is a light-load processing indicator. Updates are available only upon candle closure. Buffers are available for processing in EAs. It is a repaint indicator. So previous buffer values do not represent exactly wh
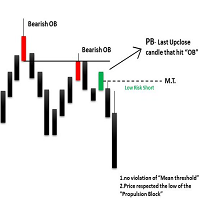
The ICT Propulsion Block indicator is meant to detect and highlight propulsion blocks, which are specific price structures introduced by the Inner Circle Trader (ICT). Note: THIS IS MTF version. Single Timeframe version avaiable at here
Propulsion Blocks are essentially blocks located where prices interact with preceding order blocks. Traders often utilize them when analyzing price movements to identify potential turning points and market behavior or areas of interest in the market.
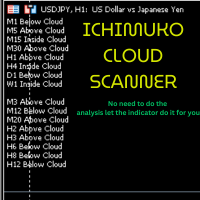
Description of the Ichimoku Cloud Scanner The Ichimoku Cloud Scanner is an advanced MetaTrader 5 (MT5) custom indicator designed to monitor the Ichimoku Cloud system across multiple timeframes and provide visual and audible alerts based on the price's position relative to the Ichimoku Cloud. Here's a detailed description of its features and functionalities: Features: Ichimoku Cloud Calculation : Utilizes the Ichimoku Cloud indicator, which consists of five components: Tenkan-sen (Conversion Lin
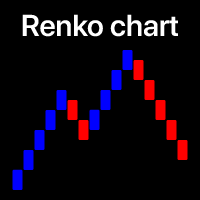
Filtra i piccoli movimenti di prezzo e concentrati sulla tendenza generale . L'indicatore grafico Renko ti aiuterà a filtrare i piccoli movimenti di prezzo per concentrarti sulla tendenza generale. Il prezzo deve muoversi di una quantità specificata per creare un blocco Renko. Questo rende facile individuare la direzione attuale della tendenza in cui si muove il prezzo. Utilità multifunzionale : include 66+ funzioni | Contattami se hai domande | Versione per MT4 Nelle impostazioni dell'
Introducing to your attention an innovative expert advisor created specifically for the most juicy and volatility currency basket: GBPUSD, XAUUSD and EURJPY. This system is designed using the main features of this market's movement, making it an ideal choice for dynamic trading on high-trending and medium-volatile pairs. The signals are focused on minimizing trading risks, aiming to reduce losses to a minimum.
Main features ESignals is designed to show open and close arrows at the beg
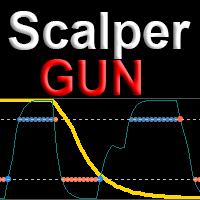
Scalper gun - главное оружие для торговли скальпингом и свингом, с визуализацией и алертом точек входа. Индикатор работает как в трендовых, так и в нетрендовых рыночных условиях. Подходит начинающим и опытным трейдерам. SCALPER GUN превосходит по скорости, качеству визуализации и точности входа популярные топовые индикаторы этого сайта!!!
Перед покупкой скачайте демо Scalper gun и сравните с аналогичными индикаторами для скальпинга в тестере MT4. Особенности Это готовая торговая система с визу

MultiFrame Trend Detector: Advanced Forex Trend Analysis Indicator The MultiFrame Trend Detector is a powerful MetaTrader 5 indicator that provides traders with comprehensive trend analysis across multiple timeframes. By dynamically adjusting trend thresholds based on the relationship between timeframes, the MultiFrame Trend Detector delivers reliable and consistent trend detection for all Forex pairs and precious metals. Key Features Custom Timeframe Analysis : Analyze trends across multiple, u

*Presentazione del Golden Indicator per il NASDAQ 100!*
Se stai cercando uno strumento potente per migliorare il tuo successo nel trading sul NASDAQ 100, non cercare oltre! Il nostro indicatore esclusivo è stato sviluppato meticolosamente dopo due anni di ricerche approfondite e analisi dei movimenti del NASDAQ 100.
Questo avanzato indicatore di media mobile utilizza i principi della sezione aurea, i livelli di Fibonacci e gli angoli di Gann per individuare con precisione i punti di crossover

This code creates a custom indicator for the MetaTrader 5 platform. The indicator generates strong buy and sell signals using a combination of ZigZag, Moving Average (MA), and Relative Strength Index (RSI). Here’s a detailed explanation of the code: Indicator Definition and Features: The indicator is displayed in the chart window. It uses 5 indicator buffers and 3 plots. Separate graphs are defined for ZigZag, buy signals, and sell signals. Input Parameters: Various parameters are defined for Z
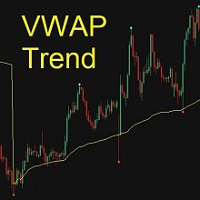
The Anchored VWAP (Volume-Weighted Average Price) indicator is a popular technical analysis tool used by traders and investors to analyze the price action over a period of time. This indicator will automatically identify the trend turning points to help traders more easily see when market is continuing the trend, pulling back, or reversing by crossing the VWAP line. Stack on multiple time frame periods to use like other moving average indicators. You can customize price calculatio
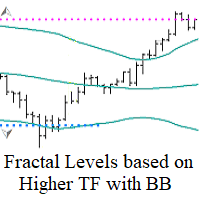
Fractal Levels based on Higher TF with BB Filter — Questo strumento è progettato per costruire livelli precisi di supporto e resistenza basati sui frattali del timeframe superiore, filtrati con l'indicatore Bollinger Bands. Fornisce segnali di acquisto e vendita con comode notifiche. Principio di funzionamento:
L'indicatore analizza i livelli frattali filtrati tramite l'indicatore Bollinger Bands sul timeframe superiore e li visualizza sul grafico corrente. Puoi facilmente regolare il timeframe
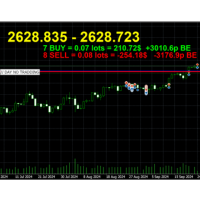
Breakeven Line v2 Indicator is a MetaTrader indicator that calculates breakeven level based on all open positions and displays it on your chart as a horizontal line. Additionally, it will calculate the total number trades, the total number of lots, and the distance to the breakeven line in points and profit/loss. The indicator is available for both MT5. Why use Breakeven Line Indicator? When you have multiple trades opened on a single symbol, it can be difficult to tell where your average ent

This LogReturnsIndicator.mq5 calculates and displays the logarithmic returns ("log returns") of the closing prices of a financial asset.
It computes the log-returns for each period using the formula:
log return=ln(close[i]close[i−1])
This measures the relative variation between consecutive closing prices in logarithmic terms, a method often used in finance to analyze the returns of financial assets.
Benefits of Log Returns:
Logarithmic returns are preferred in certain financial analyses b

This MQL5 indicator, named "Change Of State-(Poisson Law).mq5", is designed to identify significant change points in price movements using a model based on the Poisson distribution. Here’s a summary of how it works:
Purpose of the Indicator
The indicator aims to mark significant change points on the price chart by using arrows to indicate when price variation exceeds a threshold defined by the Poisson distribution.
Chart Display
The points where price variations exceed the Poisson threshold ar

This algorithm is a custom indicator for MetaTrader 5 (MT5) that plots two simple moving averages (SMA) on a financial chart to assist in the technical analysis of price movements. Here's what the algorithm does: Two Simple Moving Averages (SMA) : The indicator uses two different SMA periods: The first SMA (SMA1) has a longer period, set to 8 periods by default (SMA 8). The second SMA (SMA2) has a shorter period, set to 3 periods by default (SMA 3). Calculation of the Moving Averages : For each

This is an indicator that combines the Rate of Change and Bollinger Bands, with several functions: Identifying trends. Detecting overbought and oversold conditions. Determining potential reversal points. Applicable Chart: M5 The indicator is composed of four lines: the Upper Band, Lower Band, Fast Line, and Slow Line. Usage 1: Identifying Trends When the yellow line is above the red line and the green and blue lines are expanding, it indicates an upward trend. Conversely, if the yellow line is b

Machine Learning Adaptive SuperTrend - Take Your Trading to the Next Level!
Introducing the Machine Learning Adaptive SuperTrend , an advanced trading indicator designed to adapt to market volatility dynamically using machine learning techniques. This indicator employs k-means clustering to categorize market volatility into high, medium, and low levels, enhancing the traditional SuperTrend strategy. Perfect for traders who want an edge in identifying trend shifts and market conditio
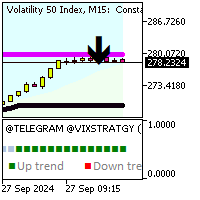
Ultimate Forex Trading Indicator Elevate your trading with our multi-functional indicator packed with advanced features! Key Features: 1. Non-repainting indicator for accurate signals 2. Max activations for peace of mind 3. 7+ strategies integrated for diverse trading styles 4. 10 Indicators all in one for comprehensive analysis 5. Perfect for Day and Swing Trading strategies 6. Trend following, reversal, and scalping strategies built-in 7. Create your own Custom strategies 8. Prop firm ready t

Daily Bias Simplified is a user-friendly tool that helps traders quickly identify the daily market direction and potential liquidity levels. It displays the daily bias, allows customization of text position and font, and now generates trading signals based on market conditions. The price level line is fully customizable in terms of color, width, and length, making it a powerful addition to any trading strategy. Key Features: Daily Market Bias : Automatically displays whether the market is bulli

L'indicatore che hai attualmente a disposizione è senza dubbio uno dei migliori strumenti per fare trading sul mercato NASDAQ 100 nei timeframe di 1 e 5 minuti. Questo indicatore funziona anche su altri timeframe, ma è stato specificamente progettato per questi due. Con un'alta precisione, questo indicatore non richiede alcuna impostazione iniziale. Devi solo avviarlo e fidarti dei suoi segnali. Precisione ed Efficienza Questo strumento è il risultato della combinazione di diversi indicatori cal
The indicator now at your disposal is undoubtedly one of the best tools for trading in the NASDAQ 100 market, especially in the 1-minute and 5-minute timeframes. This indicator is meticulously designed for high precision and can be adjusted for other timeframes as well. Simply run it and receive good exit signals. Key Features: Specialized performance in the 1-minute and 5-minute timeframes: While this indicator works in other timeframes as well, its primary focus is on these two timeframes. Co
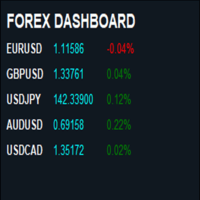
What’s the Forex Dashboard All About? Alright, so you’re diving into the world of forex trading, and you’ve probably heard about dashboards. But what are they exactly? Think of it as your command center for keeping tabs on multiple currency pairs all at once. It’s like having a radar that tells you what’s happening in the forex market without having to sift through tons of charts and data. What Does It Show You? Currency Pairs : You’ll see a list of popular currency pairs, like EUR/USD (Euro to
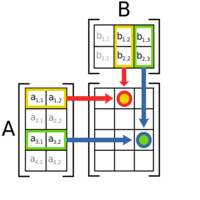
MT4 Version: https://www.mql5.com/en/market/product/124141 A Day in the Life of a Trader: Discovering the Forex Matrix Dashboard In the fast-paced world of forex trading, keeping track of multiple currency pairs can feel overwhelming. That’s where the Forex Matrix Dashboard comes in, making the life of a trader much easier. Imagine opening the dashboard and instantly seeing all your favorite currency pairs, like EUR/USD, GBP/USD, and USD/JPY, displayed clearly with their latest prices. No more
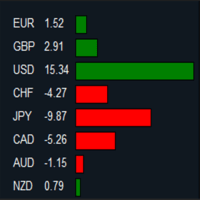
MT4 Version: https://www.mql5.com/en/market/product/124140 Imagine you’re at the helm of your trading terminal, scanning charts of various currency pairs, trying to figure out which ones are strong, which ones are weak, and where the real opportunities lie. It’s a lot to process—flipping between charts, calculating movements, and comparing performance. But what if all of that could be done for you, neatly displayed in one place? That’s where this Forex Strength Dashboard comes in. Picture thi

Дельта: танец цен на биржевом паркете Дельта - это не просто цифра, а отражение динамики рыночных сил, танцующих на биржевом паркете. Она показывает разницу между текущей ценой акции и ее начальной стоимостью. Подъем: Дельта в плюсе - это сигнал оптимизма. Цена акции растет, как пышный цветок, раскрывающийся под лучами солнца благоприятных новостей. Инвесторы видят перспективы и готовы платить больше за владение этой ценной бумагой. Падение: Дельта в минусе - это знак неуверенности. Цена акц

MT4 Version : https://www.mql5.com/en/market/product/124152 You’re sitting in your trading room, sipping coffee as the markets start their day. The screen in front of you is alive with numbers, price movements, and endless charts. Each one demands your attention. But you don’t have time to dive into every single detail. You need a quick, reliable way to read the market’s mood. That’s when you glance at your Sentiment Dashboard—a custom-built tool designed to simplify your trading decisions. Thi
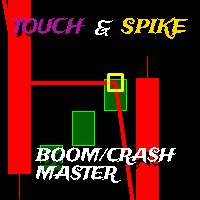
Touch Spike è un indicatore di trading di indici di boom e crollo che fornisce segnali di acquisto e vendita per un ritracciamento della barra e un tocco...
La strategia è quella di effettuare operazioni di acquisto solo sull'indice di boom e di vendere operazioni solo sull'indice di crollo, per effettuare un'operazione valida sull'indice di boom
È necessario che l'indicatore sia in uno stato di tendenza rialzista e che sia verde, attendere che una candela rossa del boom tocchi la linea verde
This indicator is the mql version of the SuperTrend indicator. SuperTrend is one of the most common ATR based trailing stop indicators.
In this version you can change the ATR calculation method from the settings. Default method is RMA, when the alternative method is SMA. The indicator is easy to use and gives an accurate reading about an ongoing trend. It is constructed with two parameters, namely period and multiplier. The default values used while constructing a superindicator are 10 for
Crea i tuoi EA di trading ad alta frequenza con Quantum Flash Abbiamo tutti sentito parlare di costruttori e generatori nel trading, ma hai mai provato Quantum Flash? È un generatore rivoluzionario che ti aiuta a creare i tuoi Expert Advisor (EA) di trading ad alta frequenza (HFT) con il codice sorgente completo!
Come funziona Quantum Flash? Quantum Flash utilizza un algoritmo intelligente che impiega la generazione casuale per creare il tuo EA HFT. Mentre alcuni generatori si concentrano solo

Improve Your Trading with Buraq RSI Detector!
Buraq RSI Detector makes trading easier by spotting important RSI levels and marking them on your chart with clear bars. This helps you see exactly when to enter or exit trades. Key Features: Set Your Own RSI Levels: Choose the levels you want, and Buraq RSI Detector will mark them when the RSI touches those points. Clear Visual Signals: Bars appear on your chart as soon as the RSI hits your chosen levels, making it easy to find trading opportunitie
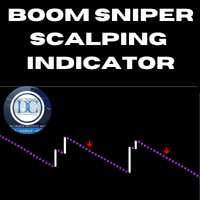
Boom Sniper Scalping Indicator for MQL5
The **Boom Sniper Scalping Indicator** is a highly accurate and reliable tool, specifically crafted for traders aiming to maximize profits in the Boom markets. Whether you're trading Boom 1000, Boom 900, Boom 600, Boom 500, or Boom 300 indices, this indicator provides precision signals to streamline your scalping strategy. With a focus on accuracy and efficiency, it is an indispensable asset for traders looking to capitalize on quick market movements.
K
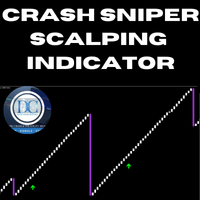
Crash Sniper Scalping Indicator for MQL5
The **Crash Sniper Scalping Indicator** is a powerful and reliable tool specifically designed for traders looking to profit from the Crash markets. Whether trading Crash 1000, Crash 900, Crash 600, Crash 500, or Crash 300 indices, this indicator provides high-precision signals to simplify scalping. With its clear visual cues and accuracy, it's an essential tool for traders aiming to capitalize on quick market movements.
Key Features: - **Multi-Timefram
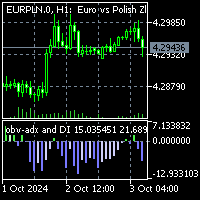
To get access to MT4 version please click here . This is the exact conversion from TradingView: "OBV ADX and DI" by " kocurekc ". This is a light-load processing and non-repaint indicator. All input options are available. Buffers are available for processing in EAs. You can message in private chat for further changes you need. I removed the background coloring option to best fit into MT platform graphics.

Want to create an Expert Advisor (EA) using an indicator that doesn’t store the required data in a buffer (visible in the Data Window) and only draws objects on the chart? This solution captures chart objects and places them into buffers, allowing you to create an EA—whether you're using EA Builder Pro or writing code with iCustom—by selecting the correct values using those buffers (modes). It works with any object visible in the Object List that has a unique Name or Description, such as: Trend

Indicator Description The indicator " TrendFusion " is designed for MetaTrader 5 and offers a comprehensive analysis by combining key technical indicators such as RSI, EMA, ATR, ADX, and MACD. It helps traders make informed decisions by visually representing these indicators and highlighting potential trading opportunities. This tool is especially useful for analyzing market dynamics across various assets, such as currency pairs or stocks. Functionality RSI (Relative Strength Index): Measures m
Daily Drawdown Indicator for MT5
Unlock your trading potential with our Daily Drawdown Indicator! This powerful tool provides real-time monitoring of daily drawdown levels, allowing traders to stay informed and make smarter decisions. Easily track your performance and manage risk by visualizing drawdown in a clear, user-friendly interface. Whether you're a beginner or an experienced trader, this indicator is essential for maintaining discipline and optimizing your trading strategy. Elevate you

The Neuro Trend Indicator leverages modern technology to provide early signals of trend reversals in the markets. Through precise color coding, the indicator displays the current trend direction: Green signals rising prices (bullish trend), while Red indicates falling prices (bearish trend). The further the indicator moves from the zero point, the stronger the trend. Values above zero indicate a strong upward trend, while values below zero point to a clear downward trend. With two customizable p

About indicator > The indicator is a function based on one value (open/high prices up to now) and then it is a mathematical representation of the whole function that is totally independent from any else values. So, if you ask yourself will the future be as it is on the graph... I can tell you - as it was the same as the trading function up to the moment "now"... In conclusion, the point of the indicator is to try to show the future of the trading function into eternity.
The graphic is sometime

IL Supporto Resistenza Whisperer MT5 è un potente strumento progettato per aiutare i trader a identificare i livelli di supporto e resistenza cruciali nel mercato. Questo indicatore utilizza l'azione dei prezzi per disegnare dinamicamente linee di resistenza rosse e linee di supporto verdi sul grafico, offrendo una rappresentazione chiara e visiva delle zone di prezzo chiave in cui potrebbero verificarsi potenziali inversioni o breakout del mercato. A differenza dei metodi tradiziona
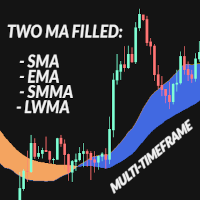
The Two MA Filled is a two moving averages indicator designed for traders seeking a more sophisticated and visual technical analysis. This indicator combines two customizable moving averages with a filling visual between them, allowing you to quickly visualize market trends and identify entry and exit opportunities. Key Features: Customizable Moving Averages: Set the periods and types of moving averages (SMA, EMA, SMMA, LWMA) for the fast and slow averages, tailoring the indicator to your tradin

This indicator is based on the strategy shared by TheMas7er on his youtube channel.
The IDR/DR range will help you identify the high and low of the day once a candle closes above or below the the DR levels.
The IDR/DR range is determined 1 hour after session open, 09:30 am est.
I have incorporated the fibonacci tool to help you mark the retracement for a good entry in the premium or discount zone.
Important
This indicator is designed for the indices and M5 timeframe, but you
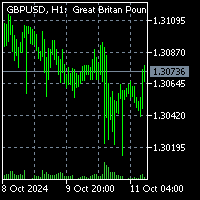
To get access to MT4 version please click here . This is the exact conversion from TradingView: "VolATR" by "barrettdenning" The screenshot shows similar results from tradingview and Metatrader when tested on ICMarkets on both platforms. This is a light-load processing. This is a non-repaint indicator. All input options are available. Buffers are available for processing in EAs. You can message in private chat for further changes you need. Here is the source code of a sample EA operating based

Indicatore di Gamma di Prezzo Giornaliero L' Indicatore di Gamma di Prezzo Giornaliero è uno strumento potente progettato per visualizzare i livelli di prezzo chiave di ogni giorno di trading, aiutando i trader a prendere decisioni informate basate sulla dinamica del mercato. Questo indicatore disegna automaticamente rettangoli sul grafico, evidenziando visivamente tre punti di prezzo importanti: Prezzo di Apertura Giornaliero : Contrassegnato con un colore distintivo per identificare facilmente

The Accumulation/Distribution (AD) Technical Indicator is a tool used in technical analysis to determine whether an asset is being accumulated (bought) or distributed (sold) in the market. Key Characteristics of the AD Indicator: Purpose: The AD indicator is used to assess the balance between buying (accumulation) and selling (distribution) of an asset. This helps traders and investors evaluate the strength of the current trend and potential reversals. Interpretation: Rising Indicator: Whe

The Accelerator Oscillator (AC) technical indicator measures the acceleration or deceleration of the current market strength. It is designed to identify potential trend reversal points and is used to determine the moment of buying or selling assets. The indicator helps traders make decisions based on changes in market dynamics. This implementation of the indicator is its creative version. Since the standard version is very limited by its built-in settings, this implementation has significantly

The AO (Accumulation/Distribution) technical indicator is a successful indicator for measuring market dynamics, which reflects specific changes in the market's driving force, which helps determine the strength of a trend, including its formation and reversal points. The AO indicator is a technical analysis tool that will help you trade more effectively. Main characteristics of the AO indicator: Purpose: The AO indicator is used to assess the balance between purchases (accumulation) and sales (di
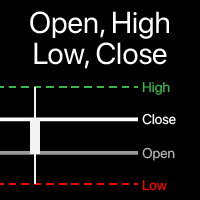
Visualizzazione dei livelli Open, High, Low, Close sul grafico Puoi scegliere qualsiasi timeframe , non solo quello attuale. L'offset della barra calcolata può essere regolato : la barra attuale (fluttuante) , o un numero impostato di barre indietro. Utilità multifunzione : include 66+ funzioni | Contattami se hai domande | Versione MT4 Nelle impostazioni dell'indicatore, puoi configurare: Offset della barra calcolata: 0 = barra corrente, 1 = barra precedente, 2 = 2 barre indietro... Op

Antabod Genius Indicator—an advanced trading tool designed to give you accurate buy and sell signals directly on your MetaTrader 5 platform. Harnessing the combined power of Moving Averages (MA) and the Stochastic Oscillator, this indicator helps you identify optimal entry and exit points with ease. Key Features: • Precision with Dual Moving Averages: The Genius Indicator uses a fast and slow MA to detect key market momentum shifts. Crossovers between the MAs serve as reliable indicators for pot

Special Fair Value Gap (SFVG) Indicator
Unlock your trading potential with the Special Fair Value Gap (SFVG) Indicator! This innovative tool identifies critical price imbalances in the market, helping you pinpoint potential buying and selling opportunities with precision.
Key Features: - Multi Timeframe - Smart Money Tool - Identifies Key Price Levels: Automatically detects STRONG HIGH PROBABILITY gaps in price action where retracements are likely to occur, allowing you to make informed tra

Antabod Multiplier , the ultimate trading indicator designed to simplify your decision-making process and maximize your trading potential. Built with a robust combination of moving averages and stochastic oscillators, this tool provides clear, actionable signals for both buy and sell opportunities. The Antabod Multiplier stands out with its dynamic trend detection and precision filtering, giving you real-time visual signals to catch trend reversals and optimal entry/exit points with ease. Whethe

The "Profit and Fee" indicator was developed in MQL5 to help traders clearly visualize the fees involved in operations on the stock exchange (B3). It calculates and displays, in real time, the fees for emoluments and registration, allowing traders to understand the impact of these fees on their profit or loss.
Advantages and Features:
1. Financial Transparency: The indicator shows exactly how much you are paying in fees, providing a clear view of the real value of your operations. This helps
Overview
The Hull Suite is a highly responsive and smooth moving average indicator based on the Hull Moving Average (HMA), developed by Alan Hull in 2005. Known for its minimal lag and clear curves, the HMA has become a widely used technical analysis tool. This script brings together multiple Hull variations into one flexible and customizable indicator, ideal for traders looking for enhanced visual representation and trend analysis. Key Features
The Hull Suite offers three variations of the Hu

Description : In the world of trading, candlestick patterns are a popular technical analysis tool used by many traders. There are numerous candlestick patterns, ranging from reversal patterns to continuation patterns. However, remembering all these patterns can be challenging, especially for novice traders. This often leads to traders having to manually memorize and identify candlestick patterns, which can be time-consuming and prone to errors. Candle Pattern Pro is a powerful indicator desig

The first 100 units are gone for FREE! Now, grab the next 50 units at just $30 each. Act fast, because once they're gone, the price will jump to $99. Don’t wait
The *Rich Scalping* indicator is a powerful tool designed for traders who seek to maximize profits through fast-paced, short-term trading. Specifically tailored for scalping, it accurately identifies entry and exit points by detecting quick price movements and market trends.
With user-friendly signals and real-time alerts, Rich

Haven Market Session Time PRO – your reliable assistant for market session and news analysis. This compact indicator keeps you informed about key trading sessions and important news events directly on the chart. Customize the display of the sessions you need – Asia, London, US, and other regions. The indicator automatically highlights activity periods, showing the start and end times of each session. You'll receive alerts about upcoming high-impact economic calendar events. A convenient panel in

The Simple Market Sessions Indicator helps traders visualize the current status of major forex market sessions: Asian , London , New York , and Sydney . It shows whether each market is Open , Active (based on volume) , or Closed directly on the chart. With customizable session times and a volume threshold, this tool helps traders monitor session activity and volume strength, making it easier to decide the best times to trade.
Key features: Displays status: Open, Active (High Volume), or Closed

Il Predittore Ibrido Boltzmann-Hopfield è un indicatore MetaTrader avanzato che combina la previsione delle reti neurali con l'analisi della volatilità per prevedere i movimenti dei prezzi. Mostra frecce verdi per i movimenti rialzisti previsti e frecce rosse per quelli ribassisti. L'indicatore genera segnali solo quando sono soddisfatte specifiche condizioni di volatilità, utilizzando ATR, volatilità storica e riconoscimento dei pattern per filtrare le previsioni. Caratteristiche principali: Fr
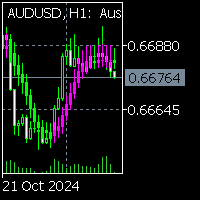
Vi presentiamo l'indicatore Linear Regression Candles per MQL5, un potente strumento progettato per funzionare senza problemi su tutti gli strumenti e i timeframe.
Questo indicatore avanzato utilizza la regressione lineare per fornire una visualizzazione accurata del trend direttamente sul grafico a candele, aiutando i trader a identificare con precisione la direzione dei prezzi e le potenziali inversioni.
Che si tratti di trading sul Forex, sulle azioni o sulle materie prime, questo strume

Multi-Timeframe Fractal Indicator Description for MQL5 Introducing the Multi-Timeframe Fractal Indicator! Key Features: Multi-Timeframe Analysis: Analyze Fractals on a timeframe independent of your chart's current timeframe. Gain insights from higher timeframes for informed trading decisions. Customizable Parameters: Timeframe: Choose the timeframe on which Fractals will be calculated (e.g., Daily, H4, etc.). Number of Bars: Specify the number of bars considered around a potential Fractal for c

Introducing Your Ultimate Trading Edge: Dynamic Support & Resistance, Advance Entry Levels Indicator for MT5 platform Unlock the power of precision trading with our cutting-edge Dynamic Support & Resistance Indicator. Designed to give traders unparalleled clarity, this indicator is your roadmap to identifying exactly where to buy and sell, maximizing your potential for consistent, sustainable profits. Why Choose Our Indicator? Crystal Clear Entry and Exit Points : No more guesswork. Our indicat
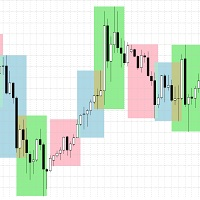
Session Boxes - Advanced Market Sessions Visualization Indicator
Overview The Session Boxes indicator is a powerful and highly customizable tool designed to help traders visualize major trading sessions directly on their charts. By clearly displaying the Asian, London, New York, Sydney, and Frankfurt sessions, traders can easily identify optimal trading times and potential market volatility periods.
Key Features
Multiple Session Support - Asian Session (Default: 00:00-09:00) - London Session

# Indicador MultiZigZag Pro para MetaTrader 5
O MultiZigZag Pro é um poderoso indicador técnico para a plataforma MetaTrader 5 que identifica, de forma inteligente e flexível, os principais pontos de inflexão e tendências nos gráficos de preços.
## Características principais: - Algoritmo avançado que filtra ruídos e movimentos irrelevantes do mercado - Múltiplos timeframes para análise de tendências de curto a longo prazo - Parâmetros de profundidade e desvio personalizáveis para adaptação a
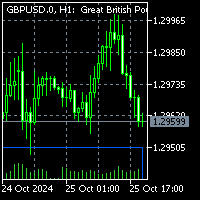
Note 1:To get access to MT4 version please contact via private message. Note 2: Multi time frame option is not available with this indicator. To order multi time frame please contact via private message. This is the exact conversion from TradingView: "Supply and Demand Visible Range by LuxAlgo". The screenshot shows similar results from tradingview and Metatrader when tested on ICMarkets on both platforms. This is a light-load processing. Updates are made based on new candle open and chart updat
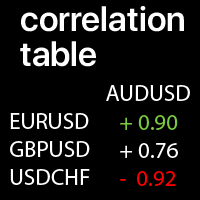
Valori di correlazione tra i simboli selezionati: confronta le tendenze attuali del mercato Un valore di +1: indica una correlazione positiva completa; Un valore di -1: indica una correlazione inversa completa; Un valore di 0: indica che non c'è una correlazione esplicita (i prezzi non dipendono l'uno dall'altro, o la correlazione è casuale ); Utility Multifunzionale #1: 66+ funzioni | Contattami per qualsiasi domanda | Versione MT4 Ogni Simbolo può essere pe
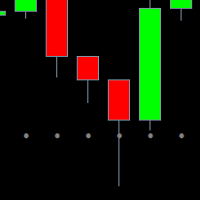
Quanti profitti si perdono a causa di un takprofit installato in modo errato. E quanti modelli di candele si sono rifiutati di funzionare a causa del fatto che nel luogo della loro formazione mancava la zona di interesse degli offerenti. I profitti persi e gli input non redditizi con la giusta direzione globale sono sempre un peccato in tripletta. Il trading porta molto dolore e caos quando proviamo a fare trading senza obiettivi chiari. Di solito nei manuali di trading o nelle previsioni degli

Supply & Demand Visible Range Indicator with Smart Alerts
Master the art of supply and demand trading with this powerful indicator that brings institutional-grade volume analysis to your charts! This sophisticated tool helps you identify key market levels where big players are active.
Key Features: - Dynamic supply and demand zone identification based on volume analysis - Smart alerts at crucial price levels (supply, demand, and mid-point zones) - Volume-weighted average calculations for pr

# Indicador MultiZigZag Pro para MetaTrader 5
O MultiZigZag Pro é um poderoso indicador técnico para a plataforma MetaTrader 5 que identifica, de forma inteligente e flexível, os principais pontos de inflexão e tendências nos gráficos de preços.
## Características principais: - Algoritmo avançado que filtra ruídos e movimentos irrelevantes do mercado - Múltiplos timeframes para análise de tendências de curto a longo prazo - Parâmetros de profundidade e desvio personalizáveis para adaptação a

Introducing Your Ultimate Trading Edge: Dynamic Support & Resistance, Advance Entry Levels Light Indicator for MT5 platform Unlock the power of precision trading with our cutting-edge Dynamic Support & Resistance Indicator. Designed to give traders unparalleled clarity, this indicator is your roadmap to identifying exactly where to buy and sell, maximizing your potential for consistent, sustainable profits. Why Choose Our Indicator? Crystal Clear Entry and Exit Points : No more guesswork. Our
Il MetaTrader Market è un negozio online unico di robot di trading e indicatori tecnici.
Leggi il promemoria utente di MQL5.community per saperne di più sui servizi unici che offriamo ai trader: copia dei segnali di trading, applicazioni personalizzate sviluppate da freelance, pagamenti automatici tramite il Sistema di Pagamento e il MQL5 Cloud Network.
Ti stai perdendo delle opportunità di trading:
- App di trading gratuite
- Oltre 8.000 segnali per il copy trading
- Notizie economiche per esplorare i mercati finanziari
Registrazione
Accedi
Se non hai un account, registrati
Consenti l'uso dei cookie per accedere al sito MQL5.com.
Abilita le impostazioni necessarie nel browser, altrimenti non sarà possibile accedere.