Guarda i video tutorial del Market su YouTube
Come acquistare un Robot di Trading o un indicatore
Esegui il tuo EA
hosting virtuale
hosting virtuale
Prova un indicatore/robot di trading prima di acquistarlo
Vuoi guadagnare nel Market?
Come presentare un prodotto per venderlo con successo
Indicatori tecnici a pagamento per MetaTrader 5 - 60

I'm excited to introduce you to the fifth bar on Martin Armstrong's Forecast Array - The Trading Cycle .
This innovative tool represents a transverse form of cyclical frequency analysis, offering a unique perspective on market trends.
The model employs a color-coded system for easy interpretation. In this model, green signals the ideal timing for highs, red indicates ideal lows, and yellow signifies a convergence of highs and lows occurring simultaneously. This intuitive approach allows us

Subscribe to the MA7 Trading channel to receive notifications about new programs, updates and other information. Ask questions in the profile on the MQL5 .
Description of work The MA7 Clover indicator is based on candle shapes. Shows the "Pin Bar" candle pattern. Detailed information about the MA7 Clover indicator.
Indicator settings General settings: Min body size ; Max body size ; Min nose size ; Max nose size ; Minimum pattern size ; Maximum pattern size ; Analysis of the candle direction

To download MT4 version please click here .
- This is the exact conversion from TradingView: " PA-Adaptive Hull Parabolic " By "Loxx".
- This is a non-repaint and light processing load indicator
- You can message in private chat for further changes you need.
- All input options are available.
- Buffers are available for processing within EAs.
- Highlight option is omitted as does not show good in Metatrader.

This DYJ PowerSignalSource is a complete trading system based on ATR technical indicators. This indicator will analyze and record the trend intensity of each cycle and current currency pair from M1-MN
DYJ PowerSignalSource creates a trend intensity and entry point signal list display by evaluating this data. When the trend percentage reaches 75% or greater, we consider it a strong currency. If the trend intensity percentage reaches 100%, we consider it the strongest, and a warning will pop up
Ricevere un segnale della prossima mossa di inversione | Ottimizzare le statistiche del tasso di guadagno | Ottenere le zone che il prezzo testerà | Indicatore non tracciante e non ritardato - ideale per il trading manuale e automatizzato - adatto a tutti gli asset e a tutte le unità temporali 69$ per il lancio poi torna a >> 149 $ Dopo l'acquisto, contattatemi su questo canale per le impostazioni personalizzate. Versione МТ4 - МТ5 | Scopri il nostro global MetaMet
Selezionare le Zone strategiche colpite 3, 4, 5 | Ottenere automaticamente il TP1/TP2/TP3 in punti o in valore | Verificare immediatamente se il vostro rapporto rischio/rendimento Offerta limitata nel tempo - poi torna a >> 99$ | Dopo l'acquisto, contattatemi su questo canale per le impostazioni personalizzate. Versione MT5 - MT4 | Controlla il nostro metodo MetaMethod in 3 passaggi per massimizzare i tuoi profitti: 1. TrendDECODER 2. PowerZONES 3. BladeSCALPER Vu
Vuoi avere successo nel mercato Forex? Il nostro innovativo indicatore AI Swing Trading è la tua chiave segreta per un trading di successo e redditizio. Ti presentiamo questo strumento unico:
Il nostro indicatore è dotato di una rete neurale integrata che consente di analizzare enormi quantità di dati, identificare i cambiamenti e prevedere i movimenti dei prezzi. Questa tecnologia ti consente di prendere decisioni di trading informate basate su un'analisi di mercato approfondita. L'algori
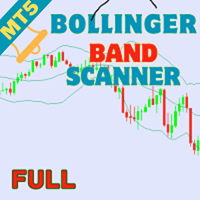
The Bollinger Bands Multicurrency Scanner Dashboard MT5 is a versatile tool for monitoring trading signals across multiple currency pairs and timeframes using Bollinger Bands. It organizes signals in an intuitive grid format, displaying each symbol’s status across timeframes from M1 to MN1. Traders can enable or disable specific timeframes to suit their strategies. You can find the MT4 version here Bollinger Band Scanner Full For detailed documentation click here Bollinger Bands Strategies: Th
L'indicatore RSI Pro Analyser è un potente strumento progettato per i trader che desiderano prendere decisioni informate su più intervalli di tempo contemporaneamente. Questo indicatore utilizza l'RSI per fornire segnali di ipercomprato, ipervenduto e di tendenza, rendendo più semplice identificare le opportunità di ingresso nel mercato. Il suo vantaggio principale è la facilità di lettura grazie ai codici colore chiari e distinti per indicare le diverse condizioni di mercato.
L'indicatore most

Introducing the 'No Nonsense Reversal Megaprofits' indicator for MetaTrader 5 (MT5), your ultimate tool for identifying trend reversals with precision and confidence. This powerful indicator is designed to cut through the noise of the markets and pinpoint crucial turning points with ease. Powered by advanced algorithms, 'No Nonsense Reversal Megaprofits' analyzes price action and key market dynamics to accurately detect when a trend is about to reverse. Whether you're a novice trader or a season
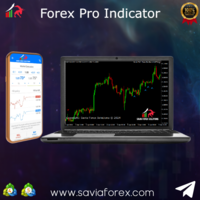
Savia Forex Pro Indicator (MT5) The Savia Forex Solutions Forex Pro Indicator gives you highly accurate entries on all Forex/Currency pairs, Indices and Cryptocurrencies. The Forex Pro Indicator is dynamic and powerful and is optimized for all timeframes and ALL Currency pairs, Indices, Commodities, and Cryptocurrency pairs. Trade with improved confidence and maximize your success rate. Benefits Dynamic and Powerful. Forex Pro Indicator is fully optimized for all chart timeframes. Forex Pro Indi

Boom and Crash Pro Indicator The Savia Forex Solutions Boom and Crash Pro Indicator gives you highly accurate entries on all Boom and Crash Indices. The Boom and Crash Pro Indicator is dynamic and powerful and is optimized for all timeframes. Trade with improved confidence and maximize your success rate. Benefits Dynamic and Powerful. Boom and Crash Pro Indicator is fully optimized for all chart timeframes. Whether price action is an uptrend, downtrend or trading sideways, Boom and Crash Pro Ind
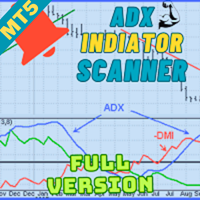
The ADX Multicurrency Scanner Dashboard MT5 is a powerful tool designed for traders who want to monitor multiple currency pairs and timeframes simultaneously using the Average Directional Index (ADX). It simplifies the process of tracking market trends, identifying confluence signals, and receiving real-time alerts, making it an indispensable asset for ADX-based trading strategies. You can find the MT5 version here ADX Multicurrency Scanner MT5 For detailed documentation click here
Multicur
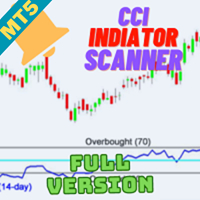
The CCI Multicurrency Scanner Dashboard MT5 is a robust trading tool that monitors signals across multiple currency pairs and timeframes using the Commodity Channel Index (CCI). It provides a streamlined grid interface that organizes signals by symbols and timeframes, ranging from M1 to MN1. Users can enable or disable specific timeframes to focus on their preferred strategies. You can find the MT4 version here CCI Multicurrency Scanner MT4 For detailed documentation click here CCI Indica
The DYJ StochasticSignalSource is displayed as two lines. The main line is called %K. The second line, called %D, is a Moving Average of %K. The %K line is usually displayed as a solid line and the %D line is usually displayed as a dotted line. There are several ways to interpret a Stochastic Oscillator. four popular methods include: Buy when the Oscillator (either %K or %D) falls below a specific level (for example, 20) . Sell when the Oscillator rises above a specific level (for example, 80)
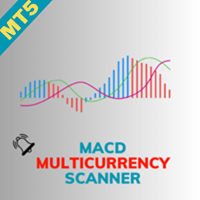
The MACD Multicurrency Scanner Dashboard MT5 is a comprehensive tool for tracking signals across multiple currency pairs and timeframes using the Moving Average Convergence Divergence (MACD) indicator. It organizes signals in a grid format, displaying each symbol's status across timeframes from M1 to MN1. Traders can enable or disable specific timeframes to focus on their strategies. You can find the MT4 version here MACD Multicurrency Scanner MT4 For detailed documentation click here MACD Int
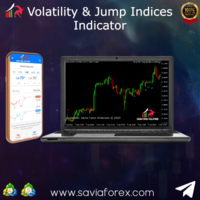
Volatility Index Pro Indicator The Savia Forex Solutions Volatility Index Pro Indicator gives you highly accurate entries on all Volatility Indices and Jump Indices. The Volatility Index Pro Indicator is dynamic and powerful and is optimized for all timeframes. Trade with improved confidence and maximize your success rate. Benefits Dynamic and Powerful. Volatility Index Pro Indicator is fully optimized for all chart timeframes. Volatility Index Pro Indicator works with Volatility Indices and Jum

Welcome to the future of trading! Are you ready to elevate your trading game to new heights? Introducing a groundbreaking trading indicator that is set to redefine the way you approach the markets. With its unparalleled features and cutting-edge technology, this indicator is not just another tool in your arsenal – it's your secret weapon for success. Imagine having access to real-time alerts that keep you ahead of the curve, ensuring you never miss a lucrative opportunity. Picture a tool that

Smart Sniper Entry Spike Detector
Advanced AI-Powered Spike Detection for Boom and Crash Markets
Here are my Socials, make sure you contact me to see How I Use The Spike Detector:
Free Telegram Group: https://t.me/+4jj1artnc_1mMzM8 WhatsApp: https://wa.me/+27659660169 Official Website: https://smartsniperentry.site
The Smart Sniper Entry Spike Detector harnesses cutting-edge artificial intelligence to identify high-probability trading opportunities in Boom and Crash synthetic indices. De

The technical indicator, TrendGenius , is based on the values of statistical trading indicators. It allows you to predict the future value of an asset. Calculations are carried out according to a certain algorithm based on data on quotes for a certain period. The tool was created to simplify technical analysis and is used on various markets and exchanges, including cryptocurrency ones.
A change in direction, from the point of view of market fundamentals, means a shift in trading interest tow

SmartTrend Analyzer is a reliable non-repainting indicator that will interest any trader.
SmartTrend Analyzer is a tool that analyzes all five aspects (opening price, high, low, closing price, and volume) based on mathematical calculations. With the algorithm of the forex indicator SmartTrend Analyzer, you can quickly determine which trend is developing in the market at the moment. The SmartTrend Analyzer technical indicator is presented on the chart as a set of points for easy interpretatio

The "Trend Orbital" indicator is a tool for tracking trends in the financial asset market. It is based on the analysis of price data and provides a visual interpretation of the current direction of price movement.
Options: InpAmplitude: Amplitude - determines the amount of volatility that the indicator takes into account when determining the trend. Group "Arrow": InpCodeUpArrow: Up Arrow Code - Defines the arrow symbol to display an uptrend. InpCodeDnArrow: Down Arrow Code - Defines the arrow

The "Trend Tandem" indicator is a trend analysis tool in financial markets that helps traders determine the direction of price movement.
Options:
RISK: Determines the level of risk taken into account in the trend analysis. The higher the value, the more aggressively volatility is taken into account. SSP (SSP Period): Defines the period of the moving average used to identify a trend. The higher the value, the smoother the trend signal will be. CountBars: Determines the number of bars on which

This indicator is used to detect spike movements in Boom and Crash pairs in Deriv company and enter into transactions. The pairs used are Boom300, Boom500, Boom1000, Crash300, Crash500, Crash1000.
When the indicator gives an arrow sign in the expected direction, the transaction is entered and Stop Loss should be placed on the support/resistance areas shown by the indicator.
The indicator does not repaint. It is not used for trend following, but for entering transactions in the direction of th

MOST is applied on this RSI moving average with an extra default option added VAR/VIDYA (Variable Index Dynamic Moving Average)
MOST added on RSI has a Moving Average of RSI and a trailing percent stop level of the Moving Average that can be adjusted by changing the length of the MA and %percent of the stop level.
BUY SIGNAL when the Moving Average Line crosses above the MOST Line
LONG CONDITION when the Moving Average is above the MOST
SELL SIGNAL when Moving Average Line crosses below MOS

L'indicatore Trend based on Extremum Levels and Volatility è un pratico strumento progettato per aiutare i trader a identificare i punti di rottura del trend e i potenziali livelli di presa di profitto su diversi timeframe.
L'indicatore può essere utilizzato su mercati forex, futures, azioni, indici, materie prime e criptovalute.
Questo indicatore universale costruisce le tendenze in base agli estremi locali, alla volatilità e alla deviazione media dei prezzi, fornendo informazioni preziose

ATR Bands Alert è un indicatore di canale in cui la larghezza del canale viene calcolata come un moltiplicatore costante ("Moltiplicatore") e il valore dell'indicatore "Average True Range". A differenza delle bande di Bollinger, la larghezza di banda non viene modificata così spesso: nell'indicatore ATR Bands Alert, le bande spesso hanno lunghe linee rette.
L'interpretazione dell'ATR Bands Alert si basa sul fatto che il prezzo si trova all'interno delle bande per la maggior parte del tempo e,

The DYJ SignalSourceOfMACD is based on the MACD indicator. Generally, signals are generated when crossing the MACD and SIGNAL lines of the MACD indicator. Signals to buy are generated if the MACD line crosses over the SIGNAL line in the negative area below the MACD open level. The negative area is where the values of MACD and SIGNAL lines are below zero. The MACD open level parameter is set in pips. However, in the code it is converted as follows: MACD Open level * Instrument.PipSize. For exa

ENG-GOLD Scalper It is an auxiliary indicator that identifies potential targets and determines the place of entry with a stop loss that works on Heiken Ashi candles
The green lines are usually the targets, the red lines are the stop loss, and the yellow lines are the entry location.
This file is recognized on small and medium frames, usually less than the watch frame
I highly recommend using XAUUSD Nasdaq100 Dow30 USOIL
DYJ SignalSourceOfRSI is a momentum oscillator which shows price strength by comparing upward movements of Close prices to their downward movements over a selected number of periods. There are two kinds of signals provided by RSI: RSI reaching of either overbought or oversold level and then making a bit of reversal: Signals to buy are generated falling of RSI below level(30) and Signals to sell are generated rising of RSI above level(70) Falling of RSI below level(30) and then rising above level

The TimeCycleCaptor indicator is an innovative tool for accurately visualizing the market trend and generating buy and sell signals.
The market trend plays a key role in making trading decisions, and our indicator provides a reliable tool for determining it. We have made traders' dream of non-lagging moving averages come true in our indicator.
TimeCycleCaptor is capable of predicting future values and is designed to both identify the underlying trend and identify short-term buy or sell sign

In the trading world, there is no universal indicator that always provides exceptionally profitable signals regardless of market conditions. Despite your persistence, such a tool simply does not exist. However, with the Trend Master Arrow indicator you will have a reliable assistant in creating your own trading system.
Although following arrow signals requires caution and additional filters, the Trend Master Arrow indicator provides valuable information for identifying possible reversals or si

The Market Might indicator, despite its apparent simplicity, is based on complex analytical algorithms that allow you to accurately determine the moments of entry and exit from transactions. The signals generated by this indicator are accurate and timely, appearing directly on the current candle.
The main task of the Market Might indicator is to determine the moments of entry and exit from trades. Therefore, it displays only the trend line and entry points, which provides a clear view of the m

The "No Reversal Accumatrix AI" is a cutting-edge MetaTrader 5 indicator designed to assist traders in confirming trends without the inconvenience of repainting. Built upon advanced artificial intelligence algorithms, this indicator offers a reliable tool for identifying and validating trends in financial markets. Key Features: Non-Repainting Technology : Unlike traditional indicators prone to repainting, the "No Reversal Accumatrix AI" utilizes innovative algorithms to provide accurate trend co

The indicator show Higher timeframe candles for ICT technical analisys Higher time frames reduce the 'noise' inherent in lower time frames, providing a clearer, more accurate picture of the market's movements.
By examining higher time frames, you can better identify trends, reversals, and key areas of support and resistance.
The Higher Time Frame Candles indicator overlays higher time frame data directly onto your current chart.
You can easily specify the higher time frame candles you'd li
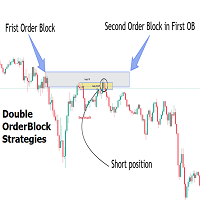
Introduction
The Price Action, styled as the "Smart Money Concept" or "SMC," was introduced by Mr. David J. Crouch in 2000 and is one of the most modern technical styles in the financial world. In financial markets, Smart Money refers to capital controlled by major market players (central banks, funds, etc.), and these traders can accurately predict market trends and achieve the highest profits.
In the "Smart Money" style, various types of "order blocks" can be traded. This indicator uses
With this indicator TheStrat bar numbers can be displayed above and below candles of the chart. The numbers have the following meaning: 1 = Inside Bar 2 = Directional Bar 3 = Outside Bar. In TheStrat-method there are Actionable and In-Force patterns / combos to define entries for trades. These patterns are also displayed by the indicator.
Here are the settings that can be configured: Number of lookbar bars : For how many candles in the past numbers are dislayed Color of inside bar : The color o
THis indicator is a typical trend following indicator. ION BOT is based on the price position and its trail stop. When the price is above its trail stop the indicator is in an uptrend, and therefore the candles are coloured green, signalling the beginning of a trend with a green arrow.
Here are some of its key functionalities: Trend Analysis: The UT Bot Alert Indicator uses advanced algorithms to analyze market trends and identify key support and resistance levels. This information can help tra

The Ultimate Trend and Reversals Detector The Ultimate Trend and Reversals Detector is a powerful tool designed to identify potential trend reversal zones in the financial markets. Here are the key features: Objective : Detect trend directions and reversals. Signal Colors : Green : Indicates a potential bullish trend reversal. Red : Signals a potential bearish trend reversal. Non-Repainting : The indicator’s signals are not redrawn, providing reliable information. Suitable for All Styles : Scal

Using the Future Trend indicator, you can predict the future price movement a certain number of bars ahead. This indicator creates a line depicting simulated future price values, providing you with valuable information for making decisions about entering or exiting the market, and for setting or adjusting stop losses accompanying your position.
In addition, the Future Trend indicator has several parameters: HistoricBars - determines the number of historical bars that are used for analysis. Fut
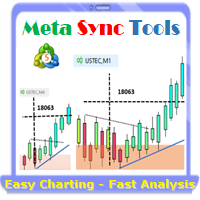
Supercharge Your MetaTrader Analysis and Trading with Meta Sync Tools! Struggling to analyze price action across different timeframes? Meta Sync Tools eliminates the frustration of unsynced crosshairs and charts, allowing seamless multi-timeframe analysis. Missing key correlations between assets and constantly switching between charts? Meta Sync Tools empowers you to visualize relationships between instruments effortlessly. Tired of wasting time on repetitive tasks? With 30+ Customizable Short

Introduction
"Smart money" is money invested by knowledgeable individuals at the right time, and this investment can yield the highest returns.
The concept we focus on in this indicator is whether the market is in an uptrend or downtrend. The market briefly takes a weak and reversal trend with "Minor BoS" without being able to break the major pivot.
In the next step, it returns to its main trend with a strong bullish move and continues its trend with a "Major BoS". The "order block" beh

Introduction
The "Smart Money Concept" transcends mere technical trading strategies; it embodies a comprehensive philosophy elucidating market dynamics. Central to this concept is the acknowledgment that influential market participants manipulate price actions, presenting challenges for retail traders.
As a "retail trader", aligning your strategy with the behavior of "Smart Money," primarily market makers, is paramount. Understanding their trading patterns, which revolve around supply, de
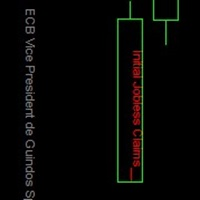
This is one of the most powerful indicators I've ever made.
I was tired of looking at other windows/websites for economical news, and regularly something would happen without me realising.
So I made this indicator which displays all news at the exact time of arrival, directly on the charts!
Now you too can just focus on the charts and know that you won't miss any news events.
There are options:
1. You can choose to display on the price line, or at the bottom of the chart. 2. You can choose t
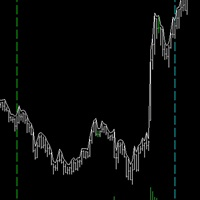
This is one of my most important indicators. Did you ever miss the session open/close? I did, which is why I made this indicator. It took a long time to get this right, since depending on your platform and timezone, it can be incorrect. It should be accurate for everyone now. It takes into account Daylight savings for NY and EU timezones, and should just work like magic on your charts.
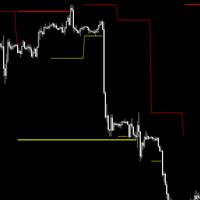
## Check screenshots to see proof that this indictor is a must! ##
Do you hate having to have a Monthly, Weekly, Daily chart when looking at your lower timeframes? I hated it too, so I made this. It will show you the High and Low of other timeframes on your chart, so you will always be aware where some support/resistance may be! Even on the 1 minute chart!
I recommend you use it 3 times, one with Day, Week and Month selected with different line widths.
I use this on every chart I look at. Yo

PMax is a brand new indicator developed by KivancOzbilgic in earlier 2020.
It's a combination of two trailing stop loss indicators;
One is Anıl Özekşi's MOST (Moving Stop Loss) Indicator and the other one is well known ATR based SuperTrend. Both MOST and SuperTrend Indicators are very good at trend following systems but conversely their performance is not bright in sideways market conditions like most of the other indicators.
Profit Maximizer - PMax tries to solve this problem. PMax combi

The Fat and Slim indicator tracks strong and weak money in the market. It is derived from RSI, MFI and many similar indicators. Input values are closing prices and volumes. The RSI (yellow curve) is in the range -100 ... 100. It is additionally multiplied by a coefficient so that the curve is not compressed to the middle values at higher periods (a problem with the classic RSI with different periods). Strong/Fat red curve is RSI weighted by higher volumes. Weak/Slim blue curve is calculated so t
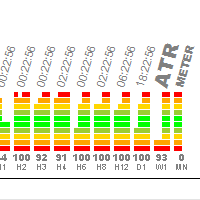
L'indicatore è progettato per determinare rapidamente la volatilità su uno strumento. È molto conveniente cambiare i grafici per capire immediatamente su quali strumenti e periodi di tempo c'è un commercio vivace e dove c'è una pausa. L'indicatore utilizza i dati DELL'indicatore ATR tradotti in percentuali. Se si traccia ATR sul grafico, sullo schermo saranno visibili circa 100-300 barre, ho calcolato la media di questo valore e l'impostazione predefinita è 150 (puoi modificare nelle impostazio

Heikin Ashi candlesticks are a powerful tool for traders, offering a clear and smooth visualization of market trends. Unlike traditional candlesticks, they filter out market noise, providing a cleaner view of the market's direction and strength, which helps traders make more informed decisions. The Hull Heikin Ashi Smoothed indicator from Minions Labs takes this a step further by integrating the Hull Moving Average for enhanced smoothing and precision. This indicator not only simplifies trend id

Segui la tendenza. Sì, attendi il segnale di ingresso, sia di acquisto che di vendita, su un frame di 15 minuti e controlla il segnale se appare su un frame di 30 minuti (a volte ci vuole un'ora o più prima che il segnale appaia. Puoi tornare al frame di 15 minuti e torna al frame di 30 minuti, e ripeti l'operazione finché non appare il segnale principale. Se il segnale appare sul frame di 30 minuti, entra con il prezzo e il profitto viene preso quando la linea di disegno cambia , viene registr
>>> MEGA SALE: 40% OFF! - Promo price: $77 / Regular price $129 <<< - The promotion will end soon!
The Forex Trend Tracker is an advanced tool designed to enhance the trading capabilities of forex traders. This sophisticated indicator uses complex mathematical formulas alongside the Average True Range (ATR) to detect the beginnings of new upward and downward trends in the forex market. It offers visual cues and real-time alerts to give traders a competitive advantage in the fast-paced world o

Volume plays a crucial role in trading, serving as a key indicator of market activity and investor sentiment. Here are some important roles of volume in trading:
Confirming trends: Dow Theory emphasizes the importance of volume in determining market trends. Larger volume usually indicates greater disagreement between bulls and bears, while smaller volume may indicate higher market agreement with the current price. Capturing institutional moves: By analyzing volume over a period of time, one ca

Overview
In the evolving landscape of trading and investment, the demand for sophisticated and reliable tools is ever-growing. The AI Trend Navigator is an indicator designed to meet this demand, providing valuable insights into market trends and potential future price movements. The AI Trend Navigator indicator is designed to predict market trends using the k-Nearest Neighbors (KNN) classifier.
By intelligently analyzing recent price actions and emphasizing similar values, it helps t

MultiFractal Levels MultiFractal Levels – è un indicatore frattale di Bill Williams modificato con livelli aggiunti. I frattali sono costruiti da tutti i TF consentiti nelle impostazioni.
I livelli sono costruiti solo sulla base degli ultimi frattali che non sono ancora stati testati in termini di prezzo. Vantaggi rispetto all'indicatore terminale originale: Convenienza Visibilità Informatività Ultimi livelli Frattale personalizzabile Livelli personalizzabili L'indicatore è utile perché non è n

This is the MT5 version of Ku-Chart.
This is an indicator devised by Ku-chan, a famous Japanese trader, based on the dealings of Lehman Brothers' discretionary traders. Unify the measuring stick of currencies to display the true value of currencies.
Although it is an indicator, it does not use a buffer and is displayed using objects such as trend lines. Also, instead of drawing on the subchart, it is drawn in an area far above the current price of the main chart, so you can switch from the no

Introduction
The "Smart Money Concept" transcends the realm of mere technical trading strategies to embody a comprehensive philosophy on the dynamics of market operations. It posits that key market participants engage in price manipulation, thereby complicating the trading landscape for smaller, retail traders.
Under this doctrine, retail traders are advised to tailor their strategies in alignment with the maneuvers of "Smart Money" - essentially, the capital operated by market makers.

Introducing our state-of-the-art Wave Indicator, meticulously designed for the discerning traders of the MQL5 community! At the core of this innovative tool lies an unmatched sensitivity to capture even the slightest market movements. Our Wave Indicator serves as the foundational element for constructing comprehensive trading strategies, providing you with an unwavering edge in the dynamic world of finance. Whether you're aiming to refine short-term tactics or develop long-term systems, this ind

TMA CG FAST MT4 REPLICADO PARA MT5 Cuenta con todas las caracteristicas del original con la funcion adicional de tener señal al fallo que consiste en que despues de una cantidad de velas establecida por el usuario emita una preseñal para una potencial entrada tiene alerta sonora para la posible entrada y la entrada definitiva tiene la posibilidad de repintar o no , queda a eleccion de usuario
Ottieni il pieno potenziale del tuo indicatore di trading con XDashboard MT5, l'indicatore dashboard definitivo per MetaTrader 5. Progettato per i trader che richiedono precisione ed efficienza, XDashboard MT5 offre una visione impareggiabile di qualsiasi indicatore su più simboli e intervalli di tempo, il tutto da un'unica interfaccia personalizzabile. ** Questo prezzo è per un periodo limitato ** Caratteristiche: Integrazione di indicatori personalizzati
Monitoraggio completo multi-simb
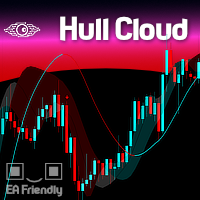
The Hull Moving Average is known for its ability to reduce lag and provide a clearer, more accurate depiction of market trends. By smoothing price data more effectively than traditional moving averages, it helps traders identify trend directions and reversals with greater precision. The Hull Cloud indicator elevates this by using four Hull Moving Averages working together like an orchestra. This combination creates a dynamic system that highlights short, medium, and long-term trends, giving trad
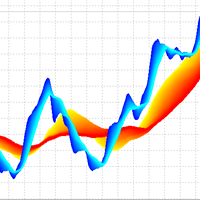
3D Trend Indicator is a non-repaint indicator using multiple moving averages with a 3D surface view. By using this indicator, you can remove uncertainties that can happen using a single and fixed moving average period. You can use a cloud area using a range of moving average periods. Also a wide range of visual settings are added to this indicator to have a better view from the cloud area. Alert and notification system added to the indicator to inform the trader about the action of candles on t
Apresentamos o Indicador de novo grafico - uma ferramenta poderosa para traders que buscam uma análise de preço suave e clara. Este indicador inovador calcula a média simples dos preços, oferecendo uma visão precisa e ajustada dos movimentos do mercado. Como Funciona : O Indicador de Média de Preços Simples (SMA) utiliza uma fórmula simples e eficaz: Ele soma o valor do último preço com o preço anterior. Em seguida, divide essa soma por 2 para obter a média. Fórmula : SMA = U ˊ ltimo Pre c ¸ o +

The Multi Asset Monitor Panel is a game-changer for traders who need to keep an eye on multiple markets simultaneously. This innovative panel allows you to monitor any symbol and any timeframe you need, all within a single, organized interface. With up to three lists of symbols and customizable MT5 templates, you can tailor your monitoring setup to fit your specific trading strategy. What sets the Multi Asset Monitor Panel apart is its flexibility and customization options. You can control the s

Course Crystal è un indicatore che aiuta i trader a determinare la direzione del trend del mercato. Utilizza un algoritmo unico per analizzare i movimenti dei prezzi e visualizza i risultati su un grafico come aree colorate. Il blu indica un'opportunità di acquisto, mentre il rosso indica un'opportunità di vendita. Istruzioni per l'uso - https://www.mql5.com/en/blogs/post/757800 Sistema di trading manuale:
Determinazione del trend: l'indicatore Course Crystal analizza i dati sui prezzi attuali

Unlock the power of Fibonacci with our advanced indicator!
This tool precisely plots Fibonacci levels based on the previous day's high and low, identifying the next day's key support and resistance levels. Perfect for day trading and swing trading, it has consistently generated weekly profits for me.
Elevate your trading strategy and seize profitable opportunities with ease.
NOTE: In the Input section make sure the draw labels are set to "True" so you can see each levels.

MinMax Levels – è un indicatore dei livelli di prezzo massimo, minimo e di apertura per periodi di negoziazione importanti: giorno, settimana e mese.
Ogni partecipante al mercato Forex utilizza i livelli nel proprio sistema di trading. Possono essere il segnale principale per effettuare transazioni o un segnale aggiuntivo, fungendo da strumento analitico. In questo indicatore, giorni, settimane e mesi sono stati selezionati come periodi importanti, poiché sono i periodi chiave di scambio dei

Description of the Indicator The indicator "BullsBearsPulse" is designed for MetaTrader 5 and provides a visual representation of the Bulls Power and Bears Power indicators. These indicators are useful tools for technical analysis, particularly for the EUR/USD currency pair, to help traders identify potential trading opportunities. Functionality Bulls Power : This indicator measures the strength of the bulls (buyers) in the market. It calculates the difference between the highest price and a 20

O LIVRO VISUAL é uma ferramenta que auxilia na identificação de escoras e renovação de ordens, para quem opera Tape Reading ou fluxo no gráfico é uma excelente ferramenta. Porem ele funciona somente em Mercados Centralizados ou com profundidade nível 2. É de fundamental importância você saber que ele não funciona em Mercado de FOREX. Porem pode ser utilizado no Mercado da B3.

Ottimizza le tue strategie di trading con l'indicatore RAR (Relative Adaptive RSI)! Questo avanzato indicatore di analisi tecnica combina la potenza del Relative Strength Index (RSI) con tecniche adattive, fornendo segnali più precisi e affidabili rispetto a un oscillatore comune. Cos'è l'Indicatore RAR? Il RAR è un indicatore progettato per MetaTrader 5 che utilizza medie mobili esponenziali (EMA) e medie mobili adattive (AMA) per rendere più fluido l'RSI e adattarlo dinamicamente alle condizio
MetaTrader Market - i robot di trading e gli indicatori tecnici per trader sono disponibili nel tuo terminale di trading.
Il sistema di pagamento MQL5.community è disponibile per tutti gli utenti registrati sul sito MQL5.com che effettuano transazioni su MetaTrader Services. Puoi depositare e prelevare denaro usando WebMoney, PayPal o una carta di credito.
Ti stai perdendo delle opportunità di trading:
- App di trading gratuite
- Oltre 8.000 segnali per il copy trading
- Notizie economiche per esplorare i mercati finanziari
Registrazione
Accedi
Se non hai un account, registrati
Consenti l'uso dei cookie per accedere al sito MQL5.com.
Abilita le impostazioni necessarie nel browser, altrimenti non sarà possibile accedere.