MetaTrader 5용 유료 기술 지표 - 64
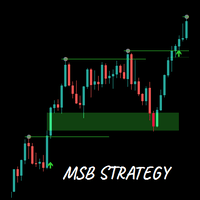
Capitalized on market structure and price gaps
The MSB Strategy indicator identifies swing highs and lows, detects high probability breakouts and price gaps (better knows as FVGs) which when price retests offer high probability entries. The indicator will draw an arrow to mark breakouts and when detected draw a rectangle FVG zone which you can use to define high probability entries. The 200 EMA is included to filter out noise and false signals. Summary of features Alerts on market structure br
Introducing the Triple EMA Trend Following + Signals Indicator – the perfect tool for traders seeking precise trend identification and actionable buy/sell signals! Key Features: Triple EMA Trend Analysis : This indicator uses two Triple Exponential Moving Averages (TEMA1 and TEMA2) to capture short-term and long-term trends effectively. TEMA1 reacts to rapid price changes, while TEMA2 filters out market noise, helping you stay on the right side of the trend. RSI and ATR Filters : It incorporates
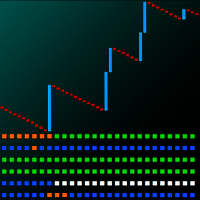
ASPCT Boom Crash Omniscope Description ASPCT Boom Crash Omniscope is a scalping indicator designed to analyze and visualize price movements on the Boom and Crash indices. The indicator tracks six different indices: Boom 1000, Boom 500, Boom 300, Crash 1000, Crash 500 and Crash 300. Peculiarities Display signals for six different Boom and Crash indices Using color indicators to indicate different market conditions Separate indicator window with buttons for quick switching between symbols Works ex
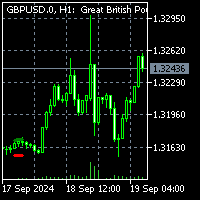
To get access to MT4 version please click here . This indicator is not a standard indicator and you may get into trouble installing it. Please contact via private chat if you face trouble. This is exact conversion from TradingView: "Consolidation Zones - Live" by "LonesomeTheBlue". This is a light-load processing indicator. Updates are available only upon candle closure. Buffers are available for processing in EAs. It is a repaint indicator. So previous buffer values do not represent exactly wh
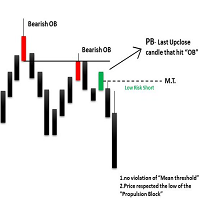
The ICT Propulsion Block indicator is meant to detect and highlight propulsion blocks, which are specific price structures introduced by the Inner Circle Trader (ICT). Note: THIS IS MTF version. Single Timeframe version avaiable at here
Propulsion Blocks are essentially blocks located where prices interact with preceding order blocks. Traders often utilize them when analyzing price movements to identify potential turning points and market behavior or areas of interest in the market.

Asia Range STDV I ndicator
This Indicator is designed not only to identify the Asia session trading range and Standard Deviation levels but also to assist traders in creating a systematic entry and exit strategy based on the higher timeframe daily trend . The indicator supports both bullish and bearish scenarios, allowing traders to focus on key moments when the Asia range's high or low is "swept" (broken) in line with the confirmed trend. Strategy Overview: 1. Confirming the Daily Trend (B
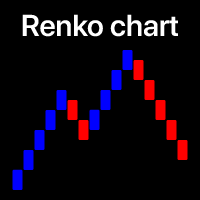
Filter out small price movements and focus on the larger trend . Renko chart indicator will help you to filter out a minor price movements so that you can focus on the overall trend. The price must move a specified amount to create a Renko brick. This makes it easy to spot the current trend direction in which the price is moving. My #1 Utility : includes 65+ features | Contact me if you have any questions | MT4 version In the settings of the indicator, you can configure: Calculation Se

VWAP Multi – Your Comprehensive Volume Weighted Average Price Indicator Overview:
VWAP Multi allows you to calculate the Volume Weighted Average Price (VWAP) across multiple timeframes, helping you analyze the market based on volume and price movements. This indicator supports VWAP calculations on daily, weekly, monthly, yearly, and session-based levels. Key Features: Multiple Timeframes: Calculate VWAP based on daily, weekly, monthly, yearly, or session periods. Flexible Price Types: Choose f
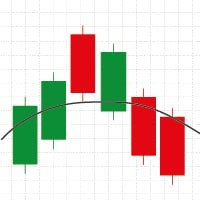
Wilder's Moving Average (Wilder's MA) is a smoothing technique developed by J. Welles Wilder, designed to reduce the impact of short-term price fluctuations and highlight longer-term trends. Unlike the standard Exponential Moving Average (EMA), Wilder's MA uses a unique smoothing factor, which gives it a slower and more stable response to changes in price. The calculation method emphasizes a more gradual adaptation to market changes, making it particularly useful in volatile markets. It helps tr

Silver Bullet Indicator - Optimize Your Market Analysis with the ICT Strategy Our Silver Bullet indicator is designed to help you conduct clearer and more effective analysis based on ICT's popular Silver Bullet Strategy. With advanced tools and customizable features, this indicator enhances your ability to identify trading opportunities. Key Features: Information Panel: Provides key data for your market analysis: DOL (Daily Objective Level): The target price for the session, where you should foc
We present to your attention a unique trading advisor called Stabilized DEMA cross robot designed for working on the 1-hour timeframe. It is used for the most popular pairs: AUDUSD, EURUSD, GBPUSD and USDCAD. Based on the scalping method, this robot uses a custom DEMA indicator and a standard DPO indicator to determine the trend state. Each new bar is classified into four main classes of signals confirmed by a two-stage filter of false signals.
System closes deals only after confirming buy

WaveTrend 3D is the mql version of this oscillator (By jdehorty and LazyBear). WaveTrend 3D (WT3D) is a novel implementation of the famous WaveTrend (WT) indicator and has been completely redesigned from the ground up to address some of the inherent shortcomings associated with the traditional WT algorithm.
WaveTrend 3D is an alternative implementation of WaveTrend that directly addresses some of the known shortcomings of the indicator, including its unbounded extremes, susceptibility to whip
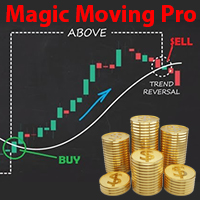
*NASDAQ 100을 위한 골든 지표 소개!*
NASDAQ 100에서 거래 성공을 향상시킬 강력한 도구를 찾고 계신가요? 더 이상 찾지 마세요! 저희의 독점 지표는 NASDAQ 100의 움직임에 대한 2년간의 광범위한 연구와 분석 끝에 세심하게 개발되었습니다.
이 고급 이동 평균 지표는 황금비율 원리, 피보나치 수준, 간 각도를 활용하여 가격과 이동 평균 간의 가장 정확한 교차 지점을 찾아냅니다.
*왜 이 지표를 선택해야 할까요?*
- *간편한 설정:* 다운로드하고 실행하기만 하면 됩니다. 복잡한 설정이 필요 없습니다! - *최적의 성능:* 1분 및 5분 타임 프레임에서 가장 효과적이며, 다른 모든 타임 프레임에서도 우수한 성과를 제공합니다. - *추세 강도 감지:* 강력한 캔들스틱이 이동 평균을 교차할 때 거래에 진입하세요. (캔들 몸체의 80% 이상이 이동 평균 위에 있어야 합니다.)
*매직 전략의 일부!* 이 지표는 NASDAQ 100에서 매직 전략을

이 고급 MACD 지표는 표준 MACD의 기본 기능을 유지하면서 여러 가지 추가 기능을 제공합니다: 히스토그램 색상 지정: 히스토그램은 증가와 감소를 명확히 보여주기 위해 네 가지 다른 색상을 사용합니다. 증가하는 양수 값에는 연한 녹색, 감소하는 양수 값에는 회색, 감소하는 음수 값에는 빨간색, 증가하는 음수 값에는 주황색을 사용합니다. 신호선 교차 화살표: MACD 선이 신호선을 교차하는 지점에서 매수-매도 신호에 대한 화살표를 표시합니다. 파란색 화살표는 매수 신호를, 빨간색 화살표는 매도 신호를 나타냅니다. 히스토그램 변화 화살표: 히스토그램이 양수에서 음수로 또는 그 반대로 전환되는 곳에서 추세 변화를 보여주는 화살표를 그립니다. 다이버전스 감지: 가격과 MACD 사이의 다이버전스를 감지합니다. 이는 잠재적인 추세 반전을 미리 예측하는 데 도움이 됩니다. 과매수/과매도 수준: 사용자 정의 수준에서 과매수 또는 과매도 조건을 표시합니다. 추세선: 장기 추세를 보여주기 위해 E

Bu kod, MetaTrader 5 platformu için özel bir gösterge oluşturur. Gösterge, ZigZag, Hareketli Ortalama (MA) ve Göreceli Güç Endeksi'nin (RSI) bir kombinasyonunu kullanarak güçlü alım ve satım sinyalleri üretir. İşte kodun ayrıntılı bir açıklaması:
İndikatör Tanımı ve Özellikleri: - Gösterge, grafik penceresinde görüntülenir. - 5 gösterge arabelleği ve 3 çizim kullanır. - ZigZag, alış sinyalleri ve satış sinyalleri için ayrı grafikler tanımlanır.
Giriş Parametreleri: - ZigZag, MA ve RSI için
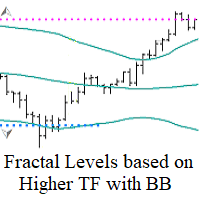
Fractal Levels based on Higher TF with BB Filter — 이 도구는 Bollinger Bands 지표로 필터링된 상위 타임프레임의 프랙탈을 기반으로 정확한 지지 및 저항 레벨을 구축하도록 설계되었습니다. 매수 및 매도 신호를 제공하며 편리한 알림 기능을 갖추고 있습니다. 작동 원리:
이 지표는 Bollinger Bands 지표로 필터링된 상위 타임프레임의 프랙탈 레벨을 분석하여 현재 차트에 표시합니다. 지표 설정에서 상위 타임프레임을 쉽게 조정하여 최대의 정확성을 얻고 전략과 일치시킬 수 있습니다. Fractal Levels based on Higher TF with BB Filter 사용의 장점: 거짓 신호 필터링:
프랙탈이 Bollinger Bands의 외부 밴드 밖에 있을 때만 레벨이 형성됩니다(변동성 돌파). Bollinger Bands의 매개변수를 조정하여 매수 및 매도 신호에 대한 지표의 민감도를 조절할 수 있습니다. 초기 신호 감
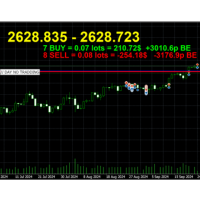
Breakeven Line v2 Indicator is a MetaTrader indicator that calculates breakeven level based on all open positions and displays it on your chart as a horizontal line. Additionally, it will calculate the total number trades, the total number of lots, and the distance to the breakeven line in points and profit/loss. The indicator is available for both MT5. Why use Breakeven Line Indicator? When you have multiple trades opened on a single symbol, it can be difficult to tell where your average ent

This LogReturnsIndicator.mq5 calculates and displays the logarithmic returns ("log returns") of the closing prices of a financial asset.
It computes the log-returns for each period using the formula:
log return=ln(close[i]close[i−1])
This measures the relative variation between consecutive closing prices in logarithmic terms, a method often used in finance to analyze the returns of financial assets.
Benefits of Log Returns:
Logarithmic returns are preferred in certain financial

This MQL5 indicator, named "Change Of State-(Poisson Law).mq5", is designed to identify significant change points in price movements using a model based on the Poisson distribution. Here’s a summary of how it works:
Purpose of the Indicator
The indicator aims to mark significant change points on the price chart by using arrows to indicate when price variation exceeds a threshold defined by the Poisson distribution.
Chart Display
The points where price variations exceed the Poisson thresh

This algorithm is a custom indicator for MetaTrader 5 (MT5) that plots two simple moving averages (SMA) on a financial chart to assist in the technical analysis of price movements. Here's what the algorithm does: Two Simple Moving Averages (SMA) : The indicator uses two different SMA periods: The first SMA (SMA1) has a longer period, set to 8 periods by default (SMA 8). The second SMA (SMA2) has a shorter period, set to 3 periods by default (SMA 3). Calculation of the Moving Averages : For each

This is an indicator that combines the Rate of Change and Bollinger Bands, with several functions: Identifying trends. Detecting overbought and oversold conditions. Determining potential reversal points. Applicable Chart: M5 The indicator is composed of four lines: the Upper Band, Lower Band, Fast Line, and Slow Line. Usage 1: Identifying Trends When the yellow line is above the red line and the green and blue lines are expanding, it indicates an upward trend. Conversely, if the yellow line is b

Machine Learning Adaptive SuperTrend - Take Your Trading to the Next Level!
Introducing the Machine Learning Adaptive SuperTrend , an advanced trading indicator designed to adapt to market volatility dynamically using machine learning techniques. This indicator employs k-means clustering to categorize market volatility into high, medium, and low levels, enhancing the traditional SuperTrend strategy. Perfect for traders who want an edge in identifying trend shifts and market condit
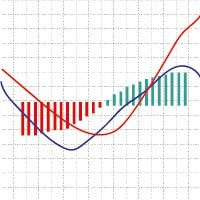
Wilder's MACD (Moving Average Convergence Divergence) is a variation of the traditional MACD indicator, incorporating Wilder's smoothing technique for more accurate trend signals. The indicator consists of three main components: MACD Line : This is the difference between two Exponential Moving Averages (EMAs) — a "Fast" EMA and a "Slow" EMA. The default periods are typically 12 for the Fast EMA and 26 for the Slow EMA. Signal Line : A smoothed version of the MACD Line using Wilder's Moving Avera
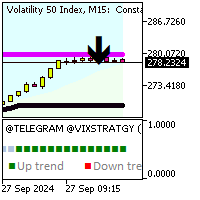
Ultimate Forex Trading Indicator Elevate your trading with our multi-functional indicator packed with advanced features! Key Features: 1. Non-repainting indicator for accurate signals 2. Max activations for peace of mind 3. 7+ strategies integrated for diverse trading styles 4. 10 Indicators all in one for comprehensive analysis 5. Perfect for Day and Swing Trading strategies 6. Trend following, reversal, and scalping strategies built-in 7. Create your own Custom strategies 8. Prop firm ready
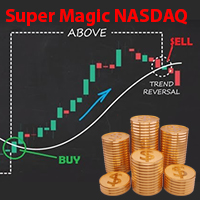
현재 귀하가 소지하고 있는 지표는 의심할 여지없이 NASDAQ 100 시장에서 1분 및 5분 시간 프레임으로 거래하기 위한 최고의 도구 중 하나입니다. 이 지표는 다른 시간 프레임에서도 작동하지만, 특히 이 두 가지 시간 프레임을 위해 설계되었습니다. 이 지표는 높은 정확도로 설계되어 초기 설정이 필요하지 않습니다. 지표를 실행하고 그 신호를 신뢰하기만 하면 됩니다. 정밀도와 효율성 이 도구는 NASDAQ에 대해 최적의 금수치로 보정된 여러 지표의 조합 결과입니다. 1년 동안의 테스트 기간 동안 지속적인 이익을 보여주었습니다. 시장의 많은 다른 지표와 달리 실제 지원을 제공하여 장기적으로 이익을 얻을 수 있습니다 . 수익성과 투자 수익 이 지표의 주요 특징 중 하나는 투자 비용을 신속하게 회수할 수 있는 능력 입니다. 몇 번의 성공적인 거래로 비용을 빠르게 회수할 수 있습니다. 이 지표는 정확한 진입 신호 를 제공할 뿐만 아니라 최고의 이탈 시기를 극대화하는 데 도움을 줍니다. NA
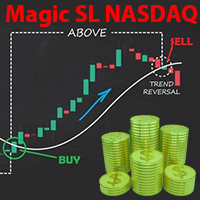
The indicator that is now available to you is undoubtedly one of the best tools for trading in the NASDAQ 100 market , especially in the 1-minute and 5-minute timeframes. It is meticulously designed for precision and can be adjusted for other timeframes as well. Simply run it and trust its powerful signals . Key Features: Specialized performance in the 1-minute and 5-minute timeframes : While this indicator works in other timeframes too, its primary focus is on these two timeframes. Compatibilit

Gann Box 지표는 트레이더가 시장의 핵심 수준을 식별하고 활용할 수 있도록 설계된 강력하고 다재다능한 도구입니다. 이 지표는 차트에 직사각형을 그릴 수 있게 해주며, 자동으로 전략적 수준인 0, 0.25, 0.50, 0.75, 1 로 여러 영역으로 나뉩니다. 가격이 이 중 하나의 수준에 도달하면 경고가 활성화되어 거래 결정을 내리는 데 귀중한 도움을 제공합니다. 그리신 영역에 대한 시장의 변화를 즉시 알 수 있습니다. 영역을 그리려면 간단한 직사각형을 그리고 이름을 GannBox 로 바꾸기만 하면 됩니다. 이 지표는 지지 및 저항 , 공급 및 수요 개념을 사용하는 트레이더, ICT 기술을 사용하는 트레이더, 또는 공정 가치 갭 (FVG) 전문가 등 모든 유형의 트레이더를 위해 설계되었습니다. 일일 거래자, 스윙 거래자 또는 포지션 거래자이든, Gann Box 는 시장의 움직임을 더 잘 이해하고 예측하는 데 도움을 주어 반응성과 성과를 향상시킵니다. MT4 버전
Gann Bo
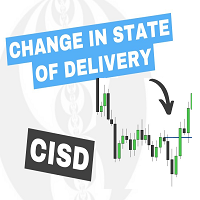
The Change In State Of Delivery (CISD) indicator detects and displays Change in State Of Delivery, a concept related to market structures.
Users can choose between two different CISD detection methods. Various filtering options are also included to filter out less significant CISDs.
USAGE Figure 2 A Change in State of Delivery (CISD) is a concept closely related to market structures, where price breaks a level of interest, confirming trends and their continuations from the resul
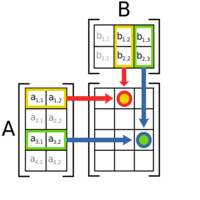
MT4 Version: https://www.mql5.com/en/market/product/124141 A Day in the Life of a Trader: Discovering the Forex Matrix Dashboard In the fast-paced world of forex trading, keeping track of multiple currency pairs can feel overwhelming. That’s where the Forex Matrix Dashboard comes in, making the life of a trader much easier. Imagine opening the dashboard and instantly seeing all your favorite currency pairs, like EUR/USD, GBP/USD, and USD/JPY, displayed clearly with their latest prices. No more
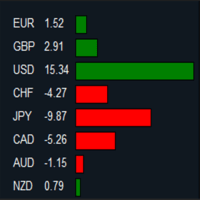
MT4 Version: https://www.mql5.com/en/market/product/124140 Imagine you’re at the helm of your trading terminal, scanning charts of various currency pairs, trying to figure out which ones are strong, which ones are weak, and where the real opportunities lie. It’s a lot to process—flipping between charts, calculating movements, and comparing performance. But what if all of that could be done for you, neatly displayed in one place? That’s where this Forex Strength Dashboard comes in. Picture thi

Дельта: танец цен на биржевом паркете Дельта - это не просто цифра, а отражение динамики рыночных сил, танцующих на биржевом паркете. Она показывает разницу между текущей ценой акции и ее начальной стоимостью. Подъем: Дельта в плюсе - это сигнал оптимизма. Цена акции растет, как пышный цветок, раскрывающийся под лучами солнца благоприятных новостей. Инвесторы видят перспективы и готовы платить больше за владение этой ценной бумагой. Падение: Дельта в минусе - это знак неуверенности. Цена акц

MT4 Version : https://www.mql5.com/en/market/product/124152 You’re sitting in your trading room, sipping coffee as the markets start their day. The screen in front of you is alive with numbers, price movements, and endless charts. Each one demands your attention. But you don’t have time to dive into every single detail. You need a quick, reliable way to read the market’s mood. That’s when you glance at your Sentiment Dashboard—a custom-built tool designed to simplify your trading decisions. Thi

You've probably noticed how unpredictable price movements can be. Sometimes the price moves in a certain direction with almost no corrections. Trend strategies work well during such periods. However, as soon as the directional movement is completed, the trading strategy ceases to be effective. Price movements become abrupt and "chaotic". The price abruptly changes its direction. Trend strategies start to give out a lot of false signals, and this leads to a large number of unprofitable trades.

This indicator is the mql version of the SuperTrend indicator. SuperTrend is one of the most common ATR based trailing stop indicators.
In this version you can change the ATR calculation method from the settings. Default method is RMA, when the alternative method is SMA. The indicator is easy to use and gives an accurate reading about an ongoing trend. It is constructed with two parameters, namely period and multiplier. The default values used while constructing a superindicator are 10 for

What is Heiken Ashi? Heiken Ashi is a charting method that can be used to predict future price movements. The indicator builds candlesticks similar to traditional ones. However, unlike a regular candlestick chart, the Heiken Ashi chart tries to filter out some of the market noise to better identify trend movements in the market.
How is Heiken Ashi calculated?
Heiken Ashi uses the COHL formula, which means "Close, Open, Maximum, Minimum". These are the four components that affect the s

Introducing the innovative AsiRocsOscillator — your reliable guide in the world of financial markets! Combining the power and accuracy of an oscillator with the speed of reaction for early signals, but confirmed by session close, AsiRocsOscillator offers unique opportunities for traders of any level.
AsiRocsOscillator key features: Multilevel market analysis: analyzes all price fluctuations, gaining access to a complete picture of the market. Accurate assessment of strength and direction: pr

Improve Your Trading with Buraq RSI Detector!
Buraq RSI Detector makes trading easier by spotting important RSI levels and marking them on your chart with clear bars. This helps you see exactly when to enter or exit trades. Key Features: Set Your Own RSI Levels: Choose the levels you want, and Buraq RSI Detector will mark them when the RSI touches those points. Clear Visual Signals: Bars appear on your chart as soon as the RSI hits your chosen levels, making it easy to find trading opportuniti
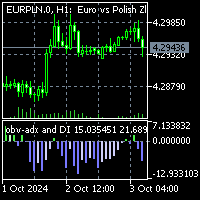
To get access to MT4 version please click here . This is the exact conversion from TradingView: "OBV ADX and DI" by " kocurekc ". This is a light-load processing and non-repaint indicator. All input options are available. Buffers are available for processing in EAs. You can message in private chat for further changes you need. I removed the background coloring option to best fit into MT platform graphics.

Want to create an Expert Advisor (EA) using an indicator that doesn’t store the required data in a buffer (visible in the Data Window) and only draws objects on the chart? This solution captures chart objects and places them into buffers, allowing you to create an EA—whether you're using EA Builder Pro or writing code with iCustom—by selecting the correct values using those buffers (modes). It works with any object visible in the Object List that has a unique Name or Description, such as: Trend

Indicator Description The indicator " TrendFusion " is designed for MetaTrader 5 and offers a comprehensive analysis by combining key technical indicators such as RSI, EMA, ATR, ADX, and MACD. It helps traders make informed decisions by visually representing these indicators and highlighting potential trading opportunities. This tool is especially useful for analyzing market dynamics across various assets, such as currency pairs or stocks. Functionality RSI (Relative Strength Index): Measures m

Support Resistance Indicator The "Support Resistance" indicator is a versatile tool designed to help traders identify key support and resistance levels based on an underlying algorithm. These levels indicate price points where an asset historically experiences buying (support) or selling (resistance) pressure. The indicator allows traders to visualize these levels on their charts, making it easier to make informed decisions. All Products | Contact PARAMETERS: Timeframe :
Users can select th
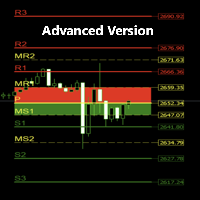
Detailed Description: The Pivot Points Buy Zone Advanced Indicator takes the concept of pivot points to a whole new level, providing traders with enhanced functionality, customizations, and in-depth visualizations. Unlike the free basic version, this advanced indicator allows users to customize more settings, analyze current and historical pivot points, enable potential buy (green) and sell (red) set-ups on the chart, use alerts and pop-up messages, ... etc. Extra Key Advanced Features: Fully C

The Neuro Trend Indicator leverages modern technology to provide early signals of trend reversals in the markets. Through precise color coding, the indicator displays the current trend direction: Green signals rising prices (bullish trend), while Red indicates falling prices (bearish trend). The further the indicator moves from the zero point, the stronger the trend. Values above zero indicate a strong upward trend, while values below zero point to a clear downward trend. With two customizable p
This indicator is the mql version of the SSLHybrid indicator (By Mihkel00). Description of TradingView version: This script is designed for the NNFX Method, so it is recommended for Daily charts only.
Tried to implement a few VP NNFX Rules
This script has a SSL / Baseline (you can choose between the SSL or MA), a secondary SSL for continiuation trades and a third SSL for exit trades.
Alerts added for Baseline entries, SSL2 continuations, Exits.
Baseline has a Keltner Channel setting

About indicator > The indicator is a function based on one value (open/high prices up to now) and then it is a mathematical representation of the whole function that is totally independent from any else values. So, if you ask yourself will the future be as it is on the graph... I can tell you - as it was the same as the trading function up to the moment "now"... In conclusion, the point of the indicator is to try to show the future of the trading function into eternity.
The graphic is sometim

그만큼 지원 저항 속삭임 MT5 시장에서 중요한 지지선과 저항선을 트레이더가 식별하도록 돕기 위해 설계된 강력한 도구입니다. 이 지표는 가격 움직임을 사용하여 차트에 빨간색 저항선과 녹색 지지선을 동적으로 그려 잠재적인 시장 반전이나 돌파가 발생할 수 있는 주요 가격 구역을 명확하고 시각적으로 표현합니다. 프랙탈에 의존하는 기존 방법과 달리 이 지표는 사용자 지정 가능한 룩백 기간 동안 최고가와 최저가를 기반으로 지지선과 저항선을 계산하여 지연을 피합니다. 주요 특징: 룩백 기간: 특정 수의 캔들에 대한 가격 데이터를 분석하기 위해 지표를 사용자 정의합니다. 룩백기간 매개변수. 이를 통해 트레이더는 지지 및 저항 수준의 민감도를 미세 조정할 수 있습니다. 과거 데이터 분석: 표시기는 최대 500개의 과거 막대를 스캔할 수 있습니다(조정 가능) 역사 시장 가격 변동에 대한 포괄적인 분석을 보장하기 위

그만큼 FVG 존 인디케이터 MT5 시장에서 공정가치 갭(FVG)을 식별하도록 설계된 강력한 도구로, 공정가치와 시장 가격 간의 가격 불균형을 강조합니다. 이러한 갭의 정확한 식별을 통해 트레이더는 잠재적인 시장 진입 및 종료 지점을 파악하여 정보에 입각한 거래 결정을 내리는 능력을 크게 향상시킵니다. 직관적이고 사용자 친화적인 인터페이스를 갖춘 FVG Zone Indicator는 공정 가치 갭에 대한 차트를 자동으로 스캔하여 가격 차트에 이러한 구역을 실시간으로 표시합니다. 이를 통해 트레이더는 다가올 가격 수정 또는 추세 지속을 나타낼 수 있는 잠재적인 가격 불균형을 빠르고 쉽게 인식할 수 있습니다. 주요 특징은 다음과 같습니다. 실시간 갭 감지: FVG가 나타나면 자동으로 식별하여 표시합니다. Pips 단위로 갭 크기 표시: 이 지표는 식별된 각 갭의 크기를 핍 단위로 표시하여 트레이더가 갭의 중요성을 이해하는 데 도움이 됩니다. 현재

The 'Daily OHLC Levels Visualizer' is an indicator that displays the previous day's open, high, low and close levels as well as today's opening price in customizable color and style and optionally 2 vertical lines at customizable times to indicate a trading session. Main features of the Daily OHLC Levels Visualizer OHLC Display Shows previous day's Open, High, Low, and Close prices Additionally visualizes the current day's opening price Supports display of a customizable number of past days
Hi
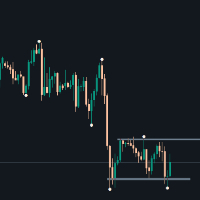
Enhance your chart analysis with the Dots indicator. This custom tool highlights key turning points in price action, allowing you to spot potential trend reversals and entry/exit opportunities at a glance. Features: Clear visual representation of market structure Customizable parameters for fine-tuning Efficient recalculation of recent price action Easy-to-use interface for traders of all levels

You can enter a sell when a red arrow appears and take profit according to your trading strategy or when a blue arrow appears. Buy when a blue arrow appears and take profit according to your strategy or when a red arrow appears. The stop for selling is always the last peak recorded by the price in the short term and the stop for buying is the last bottom recorded by the price in the short term. You should always manage your capital and not risk more than 10% of your capital.
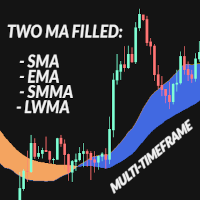
The Two MA Filled is a two moving averages indicator designed for traders seeking a more sophisticated and visual technical analysis. This indicator combines two customizable moving averages with a filling visual between them, allowing you to quickly visualize market trends and identify entry and exit opportunities. Key Features: Customizable Moving Averages: Set the periods and types of moving averages (SMA, EMA, SMMA, LWMA) for the fast and slow averages, tailoring the indicator to your tradin

This indicator is based on the strategy shared by TheMas7er on his youtube channel.
The IDR/DR range will help you identify the high and low of the day once a candle closes above or below the the DR levels.
The IDR/DR range is determined 1 hour after session open, 09:30 am est.
I have incorporated the fibonacci tool to help you mark the retracement for a good entry in the premium or discount zone.
Important
This indicator is designed for the indices and M5 timeframe,
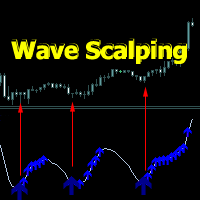
Wave Scalping indicator is a short-term trading strategy based on a wave system. It includes a wave line, entry points and position tracking.
Signal arrows appear when a candle closes.
It consists of a wave line along which signal arrows are built, and arrows - confirmation of directions after the signal arrows.
Signal arrows are built taking into account the direction of the trend direction. When confirming signal arrows, there are several types of alerts.
To configure the parameters, yo
To get access to MT4 version please click here . This is the exact conversion from TradingView: "VolATR" by "barrettdenning" This is a light-load processing. This is a non-repaint indicator. All input options are available. Buffers are available for processing in EAs. You can message in private chat for further changes you need.
Thanks for downloading...

일일 가격 범위 지표 일일 가격 범위 지표 는 각 거래일의 주요 가격 수준을 표시하도록 설계된 강력한 도구로, 트레이더가 시장의 동향을 바탕으로 신중한 결정을 내릴 수 있도록 도와줍니다. 이 지표는 차트에 자동으로 직사각형을 그려 세 가지 중요한 가격 포인트를 시각적으로 강조합니다. 일일 시가 : 매일 시장이 시작되는 위치를 쉽게 확인할 수 있도록 특별한 색상으로 표시됩니다. 일일 최고가 (하루 중 가장 높은 가격) : 해당 일의 최고 지점을 보여주는 직사각형으로 표시됩니다. 일일 최저가 (하루 중 가장 낮은 가격) : 하루 중 가장 낮은 가격을 나타내는 독특한 색상의 직사각형으로 강조됩니다. 이 지표는 현재 거래일의 가격 변동을 표시하는 것 외에도 지난 30일간의 시가, 최고가, 최저가 를 함께 보여주어 최근 시장 동향을 종합적으로 파악할 수 있습니다. 이러한 역사적 데이터는 트레이더가 과거 가격 범위를 분석하고, 반복되는 패턴을 찾아 미래의 움직임을 더 효과적으로 예측하는 데 도

Vice Daily Opening Indicator for MQL5 Overview:
Introducing the Vice Daily Opening Indicator for MQL5, a powerful tool designed for traders who want to enhance their daily trading strategies. This intuitive indicator provides clear visual cues on your trading chart by marking the opening price of each day with a prominent horizontal line. Key Features: Daily Opening Price Line: Automatically draws a horizontal line at the opening price of each day, giving traders a clear reference point for th

The Accumulation/Distribution (AD) Technical Indicator is a tool used in technical analysis to determine whether an asset is being accumulated (bought) or distributed (sold) in the market. Key Characteristics of the AD Indicator: Purpose: The AD indicator is used to assess the balance between buying (accumulation) and selling (distribution) of an asset. This helps traders and investors evaluate the strength of the current trend and potential reversals. Interpretation: Rising Indicator: Whe

The Accelerator Oscillator (AC) technical indicator measures the acceleration or deceleration of the current market strength. It is designed to identify potential trend reversal points and is used to determine the moment of buying or selling assets. The indicator helps traders make decisions based on changes in market dynamics. This implementation of the indicator is its creative version. Since the standard version is very limited by its built-in settings, this implementation has significantly

The AO (Accumulation/Distribution) technical indicator is a successful indicator for measuring market dynamics, which reflects specific changes in the market's driving force, which helps determine the strength of a trend, including its formation and reversal points. The AO indicator is a technical analysis tool that will help you trade more effectively. Main characteristics of the AO indicator: Purpose: The AO indicator is used to assess the balance between purchases (accumulation) and sales (di

MT5 스나이퍼 진입 인디케이터 다중 시간대 분석의 잠재력을 활용하세요. 우리의 혁신적인 MT5(메타트레이더 5) 스나이퍼 진입 인디케이터는 고시간대의 지배적인 추세에 기반하여 최적의 진입점을 식별하도록 설계된 강력한 도구입니다. 이를 통해 잘 기반이 다져진 트레이딩 전략을 보장합니다. 주요 특징: 다중 시간대 분석:
고시간대의 추세를 매끄럽게 분석하여 시장의 전반적인 방향성을 설정합니다. 이 인디케이터는 이 정보를 활용해 낮은 시간대에서 정확한 진입 기회를 포착합니다. 시각적 추세 표시:
인디케이터는 현재의 추세를 차트에 명확한 사각형으로 시각적으로 강조합니다. 이 사각형은 고시간대의 추세를 나타내어 시장 상황을 빠르게 평가할 수 있도록 합니다. 진입점 하이라이트:
자신 있게 스나이퍼 진입을 찾아보세요! 인디케이터는 진입점을 위 또는 아래로 향하는 화살표로 표시하여, 고시간대의 추세에 따라 매수 또는 매도 기회를 나타냅니다. 사용자 친화적인 인터페이스:
사용의 용이성

Tyr Bands Indicator (IC MARKETS GOLD). Just drag and drop.
This indicators gets you entry points for the market. it is for gold, but you can configure for any other currency. Tyr Band works with BB and 3 different deviations, plus the Stochastic confirmation. So when the price closes below/above the BB Reversal Band (Red) and the Stochcastic is in the confirmation zone, then the arrow (buy/sell) appears. This arrow indicates that we can entry to the market up/down on the next opening. Since it
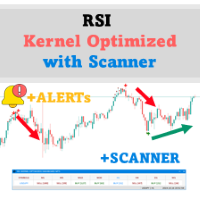
10개 한정, $49 – 가격이 $99로 오르기 전에 서둘러 구매하세요! MT5용 혁신적인 RSI Kernel Optimized with Scanner를 소개합니다. 이 최첨단 도구는 강력한 커널 밀도 추정(KDE) 알고리즘을 통합하여 전통적인 RSI 분석을 재정의합니다. 이 고급 지표는 실시간으로 시장 트렌드에 대한 인사이트를 제공할 뿐만 아니라, 여러 통화쌍과 시간 프레임을 동시에 스캔할 수 있는 대시보드를 포함하고 있습니다. 이 도구가 당신의 거래 도구 상자에 필수적인 이유를 살펴보겠습니다. 주요 기능: 혁신적인 피벗 감지 : KDE 알고리즘을 활용하여, 이 지표는 캔들스틱이 피벗 포인트를 형성할 확률을 추정하며, 거래자에게 시장 반전에 대한 독특한 관점을 제공합니다. 리페인트 없음 : 이 지표가 제공하는 신호는 캔들 막대가 닫힌 후 확정되며, 이후에는 변경되지 않습니다. 이를 통해 다음 캔들 시작 시 자신 있게 거래 전략을 시작할 수 있습니다. 사용자 지정 가능한 KDE 알

Automatic Fibonacci Levels Indicator The Automatic Fibonacci Levels Indicator is an essential tool for traders seeking to incorporate Fibonacci retracement and extension levels into their technical analysis seamlessly. This innovative indicator automatically identifies significant price movements and calculates key Fibonacci levels, providing traders with valuable insights into potential support and resistance areas. Key features: Automatic Calculation : Effortlessly plots Fibonacci levels base
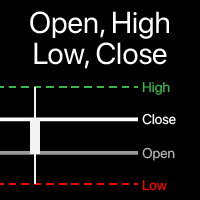
Visualization of Open, High, Low, Close levels on the chart You can choose any timeframe , not just the current one. The offset of the calculated bar can be adjusted : the current (floating) bar , or a set number of bars back . My #1 Utility : includes 65+ functions | Contact me if you have any questions | MT4 version In the settings of the indicator, you can configure: Offset of the calculated bar: 0 = current bar, 1 = previous bar, 2 = 2 bars back... "Include multiple bars " opti

Automatic Trendline Indicator The Automatic Trendline Indicator is a powerful tool designed to simplify technical analysis by automatically identifying and drawing trendlines on a price chart. It analyzes price movements to detect key support and resistance levels, plotting ascending and descending trendlines based on historical price action. This indicator helps traders identify market trends, potential breakout points, and reversal areas with minimal effort. Key features: Automatic Detection

Antabod Genius Indicator—an advanced trading tool designed to give you accurate buy and sell signals directly on your MetaTrader 5 platform. Harnessing the combined power of Moving Averages (MA) and the Stochastic Oscillator, this indicator helps you identify optimal entry and exit points with ease. Key Features: • Precision with Dual Moving Averages: The Genius Indicator uses a fast and slow MA to detect key market momentum shifts. Crossovers between the MAs serve as reliable indicators for pot

Special Fair Value Gap (SFVG) Indicator
Unlock your trading potential with the Special Fair Value Gap (SFVG) Indicator! This innovative tool identifies critical price imbalances in the market, helping you pinpoint potential buying and selling opportunities with precision.
Key Features: - Multi Timeframe - Smart Money Tool - Identifies Key Price Levels: Automatically detects STRONG HIGH PROBABILITY gaps in price action where retracements are likely to occur, allowing you to make informed t

# ConvolutionalAI 외환 예측기 프로
최첨단 인공지능으로 외환 거래를 향상시키세요. ConvolutionalAI 외환 예측기 프로는 딥 러닝과 합성곱 신경망의 힘을 활용하여 외환 시장에 대한 정확하고 시기적절한 예측을 제공합니다.
## 주요 특징: - 고급 AI: 정확한 시장 분석을 위해 최신 ONNX 모델 사용 - 실시간 예측: 최신 시장 동향 예측 제공 - 사용 편의성: 차트에 직접 표시되는 명확한 매수 및 매도 신호 - 적응형 학습: AI가 지속적으로 변화하는 시장 조건에 적응 - 맞춤 설정: 거래 스타일에 맞게 매개변수 조정 가능 - 다중 시간대 분석: 다양한 시간대에서 작동하여 포괄적인 시장 통찰력 제공
숙련된 트레이더이든 초보자이든, ConvolutionalAI 외환 예측기 프로는 오늘날의 경쟁이 치열한 외환 시장에서 필요한 우위를 제공합니다. 단순히 추세를 따르지 말고 AI 기반의 정확도로 예측하세요.
지금 바로 거래 전략을 업그레이드하고 C
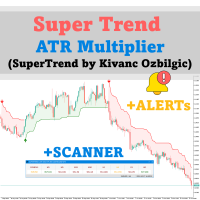
10부 한정 $49 – 가격이 $99로 오르기 전에 서둘러 확보하세요! SuperTrend ATR Multiplier with Scanner for MT5 를 소개합니다 – 시장 트렌드를 앞서기 위해 설계된 다기능 강력한 도구로, 사용자 맞춤형 기능과 실시간 알림을 제공합니다. Kivanc Ozbilgic 의 신뢰할 수 있는 SuperTrend 로직을 기반으로 한 이 지표는 정확한 트렌드 신호를 제공합니다. ATR 계산 방법을 RMA (상대 이동 평균)와 SMA (단순 이동 평균) 중에서 선택하여 최대한의 유연성을 제공할 수 있습니다. 기본 설정으로 ATR 기간은 10, 배수는 3으로 설정되어 있으며, SuperTrend 는 매수 및 매도 신호를 효율적으로 감지합니다. 내장된 스캐너와 알림 시스템은 여러 통화 쌍과 시간 프레임을 모니터링하여 실시간 알림을 제공해 즉각적인 조치를 취할 수 있도록 합니다. 주요 특징 : 검증된 SuperTrend 로직: Kivanc Ozbilgic 의

Antabod Multiplier , the ultimate trading indicator designed to simplify your decision-making process and maximize your trading potential. Built with a robust combination of moving averages and stochastic oscillators, this tool provides clear, actionable signals for both buy and sell opportunities. The Antabod Multiplier stands out with its dynamic trend detection and precision filtering, giving you real-time visual signals to catch trend reversals and optimal entry/exit points with ease. Whethe
MetaTrader 플랫폼 어플리케이션 스토어에서 MetaTrader 마켓에서 트레이딩 로봇을 구매하는 방법에 대해 알아 보십시오.
MQL5.community 결제 시스템은 페이팔, 은행 카드 및 인기 결제 시스템을 통한 거래를 지원합니다. 더 나은 고객 경험을 위해 구입하시기 전에 거래 로봇을 테스트하시는 것을 권장합니다.
트레이딩 기회를 놓치고 있어요:
- 무료 트레이딩 앱
- 복사용 8,000 이상의 시그널
- 금융 시장 개척을 위한 경제 뉴스
등록
로그인
계정이 없으시면, 가입하십시오
MQL5.com 웹사이트에 로그인을 하기 위해 쿠키를 허용하십시오.
브라우저에서 필요한 설정을 활성화하시지 않으면, 로그인할 수 없습니다.