Guarda i video tutorial del Market su YouTube
Come acquistare un Robot di Trading o un indicatore
Esegui il tuo EA
hosting virtuale
hosting virtuale
Prova un indicatore/robot di trading prima di acquistarlo
Vuoi guadagnare nel Market?
Come presentare un prodotto per venderlo con successo
Indicatori tecnici a pagamento per MetaTrader 5 - 70
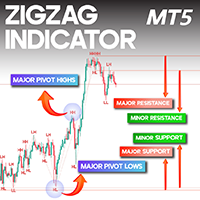
ZigZag Indicator with Labels for MT5
The ZigZag Indicator with Labels is a valuable tool for traders using MetaTrader 5 (MT5) to identify market structure by pinpointing significant highs and lows. This indicator enhances technical analysis by distinguishing between major turning points, which define broader trends, and minor fluctuations, which indicate internal price movements. It is especially useful for Elliott Wave analysts , enabling them to track market dynamics effectively and recognize
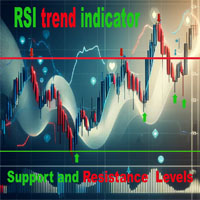
Индикатор RSI Уровни Поддержки/Сопротивления – это мощный инструмент технического анализа, который помогает трейдерам находить точки входа и выхода на основе сигналов RSI и ключевых уровней цены. Индикатор подтверждает зоны перепроданности и перекупленности с учетом исторических максимумов и минимумов. Основные особенности Сигналы на основе RSI: Покупка при перепроданности, продажа при перекупленности.
Динамические уровни: Автоматический расчет ключевых зон поддержки и сопротивления.
Визу

Este es un indicador que trabaja en indices BOOM 1000 y su equivalente en Weltrade Gain 1200. Basicamente trabaja en temporalidad de 15 minutos y su objetivo es cazar spikes. Se recomienda la temporalidad de 15 minutos por que genera un poco mas de precision. Se recomienda indices que general altos spikes, como el BOOM 1000. Lo interesante de cazar spikes es que se puede gestionar el riesgo. La configuracion ideal para BOOM 1000 y Gain 1200 es la que esta por defecto.

VWAP Bands Indicator – The Revolution in Trend Analysis! The VWAP Bands Indicator is the ultimate tool for traders seeking precision and clarity in market analysis! Based on the Volume-Weighted Average Price (VWAP) , this indicator not only displays the main trend but also adds three dynamic bands to capture volatility and identify strategic buy and sell zones . Why Use the VWAP Bands Indicator?
Professional Accuracy – Identifies support and resistance areas based on real volume.
Th
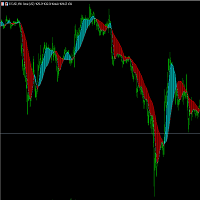
Trend Indicator Pro Use any currency and any time period you want For greater profitability use a risk return of at least 1:3 or 1:4 Entry Signal : Appears after the moving average crossover closes ️️
Histogram Flip : Signals important trend changes ️
Easy to use : Perfect for those who want fast, confident decisions!
Boost your accuracy : Find the best market entry moments with more confidence!
Get straight to the point and seize the best trend opportunities!
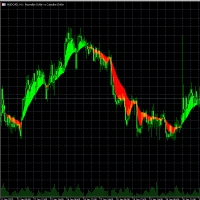
CrossMann is a simple and elegant indicator for MetaTrader 5, which represents the areas of intersection of moving averages.
This indicator displays two Exponential Moving Averages (EMA), with different periods, calculated by closing prices, and colors the ranges of their intersection in two colors - for buying and selling.
The indicator will work great on all trading instruments and timeframes in strategies where a similar principle is used.

Gaussian scalper indicator based off the same logic used in my gaussian scaler ea. Enjoy!!
The Gaussian Scalper is a precision scalping indicator designed for high-probability trend entries based on advanced filtering techniques. It utilizes a combination of Least Squares Moving Average (LSMA) and Gaussian filtering to detect trend direction and trade signals. The strategy is reinforced by ADX-based trend confirmation, MACD filtering, and a volume threshold for trade validation. Risk management
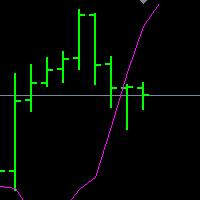
DINAPOLI,MACDP,DMP,XMP,MT5版本 帝纳波利主图MACD指标,国内又叫做:DMP,XMP,MACDP,DNMACDP。 是MACD主图化指标,参数为: FAST=8.3896 SLOW=17.5185 SIGNAL=9.0503 SHIFT=1; 主要作用: 趋势判断,动态压力辅助,SG识别。 是帝纳波利点位交易法不可缺少的指标工具。 1. 只使用 DiNapoliDMP 作为判定趋势的工具。不使用它作为判断超买 / 超卖或动量的指标。 2. 一个上升趋势信号在价格从下向上穿越DMP时被给出。一个下降趋势信号在价格从上向下穿越DMP时被给出。穿越时形成的角度非常重要,陡直的角度,接近于 90 度,往往决定了后续的趋势质量更高。 3. 正确的公式和数字的输入才能使这些研究有效。它们经历了时间的验证。
How Antabod Stochastic Works Antabod Stochastic is a cutting-edge technical indicator designed to analyze market momentum and identify overbought and oversold conditions with unparalleled precision. Here's a breakdown of how it works and what makes it a game-changer for traders: ________________________________________ 1. Core Concept At its heart, Antabod Stochastic is based on the stochastic oscillator principle, which measures the position of a current price relative to its range over a spec

This trend-following indicator calculates dynamic trailing stops using a modified (or unmodified) ATR method with a Wilder's moving average for smoothing. It displays separate bullish (green) and bearish (red) trailing stop lines that adjust as the market moves. recommended to be used in conjution with Gaussian Scalper XD indicator for trade entry with multiple confirmations. Gaussian Scalper XD: https://www.mql5.com/en/market/product/132204?source
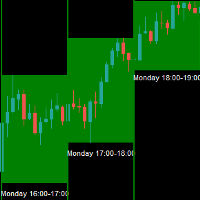
The Entry Signal Analyzer is a sophisticated MetaTrader 5 indicator designed to analyze and identify optimal trading hours based on price movement patterns. The indicator analyzes gold currency only a updated version is currently being developed for other symbol the indicator in the strategy tester is non-functional works on the real chart Statistical Analysis: Analyzes historical price movements for each hour of the trading day Tracks success rates and consistency of movements Calculates poi

The Idie indicator not only shows the trend direction, but also the change in slope angle, which allows you to filter signals using angle filters. This makes it useful when creating a trading bot based on this signal indicator. Idie is very sensitive to current price activity and displays signals effectively.
The color version of the indicator signals a change in trend, allowing traders to see a rising or falling trend. The indicator quickly reacts to trend changes and clearly shows price move
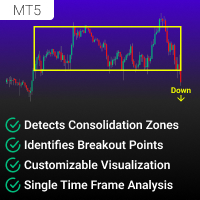
Il Consolidation and Breakout Detector è un avanzato indicatore MT5 a singolo timeframe progettato per i trader che vogliono identificare zone di consolidamento (mercati in range) e rilevare opportunità di breakout .
Analizza automaticamente l’azione dei prezzi storici, identifica le aree in cui il mercato si muove lateralmente e avvisa i trader quando si verifica un breakout valido. Questo strumento è utile per trader di breakout, trend follower e trader di range , aiutandoli a prendere decisio
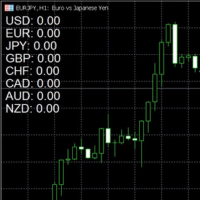
Nuovo Strumento di Trading: Ottimizza le tue Operazioni! Sono felice di presentarti un nuovissimo strumento che ho sviluppato per fare trading senza troppe riflessioni! A differenza degli indicatori tradizionali, questo non segue semplicemente la variazione dei prezzi. Analizza in profondità le correlazioni tra le valute e ti aiuta a individuare i momenti strategici per entrare nel mercato. Ecco come funziona: Zero = Nessuna operazione: Finché l'indicatore è a zero, significa che le condiz

ShoukatSRI is an advanced MQL5 indicator designed to help traders identify potential market trend changes before they fully develop. Using a combination of smoothing techniques and custom signal logic, the indicator processes market data to provide early alerts through clearly defined buy and sell signals. Key Features: • Early Trend Detection – The indicator employs advanced algorithms such as SuperSmoother, Gaussian filtering, and ALMA to smooth out market noise and highlight significant movem

The key logic of SignalTech is generated by Artificial Intelligence. The machine learning module should continue optimizing the core logic on the server side to guarantee that SignalTech System can accurately track the market's movement.
SignalTech can generate AI based signals with Buy/Sell Arrows and Pop-Up/Sound Alerts. Each signal has clear Entry and stop Loss levels, which should be automatically flagged on the chart, as well as potential Targets 1, 2, and 3.
SignalTech can work on EURU
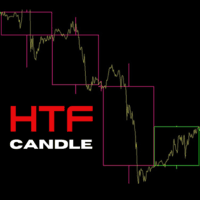
ICT Traders! Here's another cool Indicator that will allow to trade the HTF narrative while focus on price action on your entry timeframes. The following are the input for setup the indicator: Maximum Bar: The number of HTF bar you want to display High Timeframe: the Timeframe which narrative you want to base on and trade from the lower timeframe. Visual Timeframe: the largest Timeframe the indicator will print the HTF candles. Bullish Candle: The color of the bullish candle Bearish Candle: The
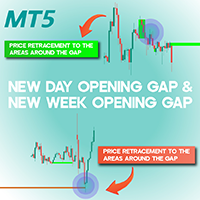
New Day Opening Gap and New Week Opening Gap NWOG NDOG MT5 The New Day and New Week Opening Gap (NDOG-NWOG) indicator is a powerful tool designed for traders using MetaTrader 5. It detects price gaps that emerge at the start of a new trading day or week and visually represents them on the chart. When the market reopens following a daily or weekly closure, the price often shifts from its prior closing level, leading to a gap. This indicator highlights weekly gaps (NWOG) in red and daily gaps (

A Fair Value Gap (FVG) is a three-candle price imbalance where price moves aggressively in one direction, creating a gap between the wicks of the first and third candle.
How to Identify an FVG: The second candle must have a large body , showing strong displacement.
The wick of the third candle must not overlap with the wick of the first candle , leaving an inefficiency. The third candle should not close beyond the high (bullish) or low (bearish) of the second candle.
Usage: Internal Range
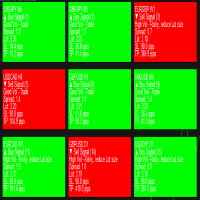
Introducing Telos Dashboard Indicator – Your Ultimate Trading Companion Optimized For Forex! Note: This is a dashboard indicator and won't work on the strategy tester. Demoing it there is a waste. Instead get the main indicator or, use the demo of DynamicCOG to see how it works with arrows, although Telos is a more refined and filtered version than the DynamicCOG indicator. Never Miss a Trading Opportunity Again!
Welcome to the future of trading with the Telos Dashboard Indicator ! Inspired
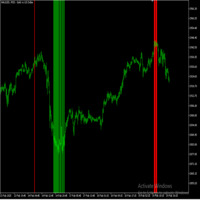
Reversal Radar – Indicatore Tecnico per l’Analisi delle Inversioni di Mercato Panoramica
Reversal Radar è un indicatore tecnico sviluppato per aiutare a identificare potenziali punti di inversione del mercato. Esamina i dati storici dei prezzi per individuare massimi e minimi significativi, fornendo segnali visivi che aiutano i trader a riconoscere le aree in cui il momentum del mercato potrebbe cambiare. Caratteristiche Principali Rilevamento dei Prezzi Estremi:
Identifica picchi e cadute no
ADBIN BAND – Adaptive Channel Indicator for XAUUSD and DE30
Description:
The ADBIN BAND is a trading indicator designed for analysis of XAUUSD (Gold) and DE30 (German Stock Index) . It generates dynamic price channels using an Adaptive Moving Average (AMA) to reflect market volatility. Functionality: Dynamic Channels : Plots upper and lower bands around price, adjusting to volatility via AMA. Signal Generation : A green arrow appears when price closes above the upper band. A r

The indicator is designed to help in making a decision on the direction of trading (buy or sell). It is a history scanner that searches for matches of the current pattern (combination of several current bars) with historical data in percentage terms by the relative vertical position of candles relative to each other, the size of each candle, the size of the candle body and the candle shadows. In history, the matches found are indicated by vertical lines on the candle of the beginning of the soug

Crash Raptor A Powerful Spike Trading System [VPS Recommended] Crash Raptor Spike Detector is a professional trading indicator designed to identify high-probability sell setups in Deriv Indices. This indicator combines the power of Reversal Strategy to generate reliable trading signals with precise entry, stop-loss, and take-profit levels. Only trading Signals when Crash 1000 is in Downtrend Key Features Clear Visual Signals : Prominent arrow markers for sell signals Automatic SL/TP Levels : St
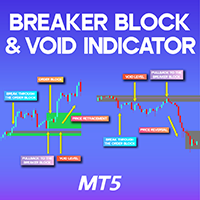
Breaker Block & Void Indicator MT5
A Breaker Block represents a price zone where the market revisits after breaching an Order Block . In simple terms, when the price pulls back to a previously broken order block, it forms a breaker block. The Breaker Block Indicator is designed to automatically detect these critical zones, marking them once an order block is violated and the price retraces. By analyzing market movements, it helps traders identify recurring patterns in price action. «Indicator I
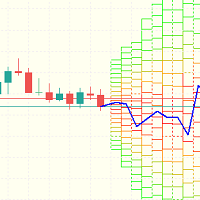
L'indicatore utilizza il moto browniano e le iterazioni di Monte Carlo per calcolare la probabilità che il prezzo si muova in una determinata direzione . Cosa mostra l'indicatore? Da un lato, traccia una mappa di calore che divide l'area in tre zone in base alla probabilità che il prezzo raggiunga determinati livelli: Zona rossa : Probabilità maggiore del 50% . Zona arancione : Probabilità tra il 25% e il 50% . Zona verde : Probabilità inferiore al 25% . D'altr

ATR Master – Il Maestro della Volatilità sul tuo Grafico! ATR Master è un indicatore ATR professionale che visualizza istantaneamente i dati chiave direttamente sul grafico! Ti aiuta a analizzare l’ampiezza del movimento del prezzo, determinare la distanza percorsa e il potenziale rimanente , oltre a monitorare il timer della candela e lo spread attuale. Perché i trader scelgono ATR Master? Analisi ATR giornaliera – Visualizza l’ampiezza media del movimento del prezzo della giornata,
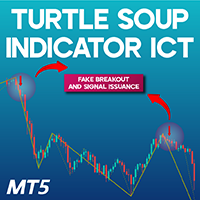
Turtle Soup Indicator ICT for MT5 The Turtle Soup Indicator for MetaTrader 5 is a specialized tool aligned with the "ICT" trading methodology. This indicator is designed to detect false breakouts (Fake Breakouts) and identify potential counter-trend trading setups when conditions are favorable. As a result, it is highly optimized for reversal trading strategies. The indicator simplifies false breakout identification by categorizing them into internal and external classifications. Moreover, newly

The "Setup Bivit" Indicator The "Setup Bivit" is an advanced technical indicator designed for MetaTrader 5, developed to provide a clear and comprehensive visual analysis of the financial market. Inspired by customized strategies, this indicator combines intuitive visual elements and decision-support tools, making it a powerful ally for traders looking to identify trends, support and resistance zones, and price patterns across different timeframes. With a rich and interactive graphical interface

Manyal trading system, CovEchoTrend Robot, focuses on reliability and flexibility. By employing statistical analysis methods to study the relationships between the base indicator and market patterns, the system enables a deeper understanding of market processes. Intelligent pattern analysis: The application of statistical data processing helps identify key trend reversal points more accurately, signaling significant market shifts. Informed decision-making is based on the intersection of indicato

Super Trend Indicator – Trend Following Tool
Description:
The Super Trend Indicator is a trend-following tool designed to assist traders in identifying market trends. Utilizing the Average True Range (ATR), it dynamically adjusts to market volatility and generates visual signals. The indicator plots lines directly on the chart, changing color based on trend direction. Crosses between the price and indicator line may suggest potential trend shifts. Key Features: Dynamic trend detection using ATR.
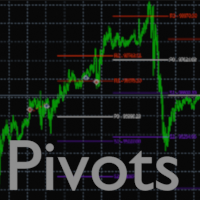
Pivots Points Indicator:
Displays the Pivots Points lines for the Daily, Weekly or Monthly periods
Several parameters are possible:
1 - Choice of calculation method:
- Classic
- Woodie
- Camarilla
- Fibonacci
2 - The choice of the period for calculating the pivot points ( Daily, Weekly or Monthly )
3 - The display or not of the price labels (to the right of each line) as well as the size of the associated font
4 - The number of pivot points (previous) that we want to display
5 - Po
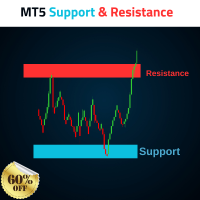
MT5 Support and Resistance Indicator Automatic Drawing of Multiple Supports and Resistances with levels. Supports As follow 1. Weak Support 2. Untested Support 3. Verified Support 4. Proven Support 5. Turncoat Support Resistances As follow 1. Weak Resistance 2. Untested Resistance 3. Verified Resistance 4. Proven Resistance 5. Turncoat Resistance Best Strategy to use 1. Identify Trend Direction on Daily Time Frame, Example Gold =
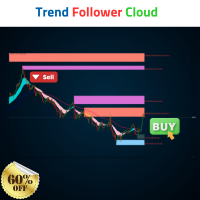
Trend Follower Cloud Trend is your freind. Advanced Indicator follow the trend, and gives a clear levels to buy and sell, and have Stop loss and Targets. Watch the Video to know how to use it combined with our Support and Resistance Indicator. Blue Trend Line Take a buy when we get a cloud intersection above the Bule line. Red Trend line Take a Sell when the Cloud drops below the Red line.

Range Breakout Signal (RBS) is a powerful trading indicator based on the Fair Value Gap (FVG) concept. This strategy identifies imbalances in price action, where liquidity gaps create high-probability trading opportunities. The indicator pinpoints these gaps and marks potential buy and sell zones for traders to capitalize on market inefficiencies. Key Features:
Detects Fair Value Gaps (FVG) for strategic entries Identifies strong breakout zones with price range expansion Displays clear buy a

Market Session Asia EU USA – Visualizza le sessioni di trading globali su qualsiasi timeframe Market Session è un potente indicatore per MetaTrader 5 che evidenzia le principali sessioni di trading— Asiatica, Europea e USA —direttamente sul grafico. Funziona su tutti i timeframe , consentendo ai trader di identificare rapidamente l'attività del mercato e la volatilità durante le diverse ore di trading globali. Caratteristiche:
️ Mostra i confini delle sessioni di Asia, Europa e USA
️ Funz

Indicator Description: "Currency Strength Panel with Trend Analysis" This indicator is designed for analyzing the strength of currency pairs and determining their current trends, helping traders make more informed trading decisions. It displays a panel on the chart that shows the strength of each currency pair based on price movements across different timeframes (H1, H4, D1) and identifies whether the pair is in a trend or counter-trend. How to Use this Indicator: Currency Pair Strength Analysis

Indicador IPCPayroll – O Segredo dos Traders de Sucesso! Quer operar com mais confiança e precisão com os preços do dia da divulgação do Payroll e do IPC Americano ? O Indicador IPCPayroll foi desenvolvido para traders que querem acompanhar o impacto dessas notícias no mercado de forma estratégica e organizada. Marcação Automática das Notícias
O indicador insere automaticamente linhas horizontais no preço de abertura do candle de 5 minutos das datas de Payroll e IPC. Visualização Clar

This Indicator enhances the default Relative Strength Index (RSI) by introducing several improvements. First, it visually highlights overbought and oversold regions by changing the RSI color from white to red. Second, it includes additional reference lines at 20, 40, 50, 60, and 80, providing a clearer framework for assessing RSI values. The most notable feature is the use of the middle 50-line to indicate the current market cycle. The color of the 50-line dynamically reflects the cycle: green f

Smart Key Levels Indicator for MT5- Advanced Support & Resistance Tool The Smart Key Levels Indicator is a professional-grade tool for traders seeking precise support and resistance levels. Using advanced algorithms, it identifies key price levels with dynamic strength scoring, volume filtering, and higher timeframe confluence. Perfect for all trading styles and timeframes, this indicator provides clear visual signals with customizable settings. Available for both MT4 and MT5 platforms. Unlo
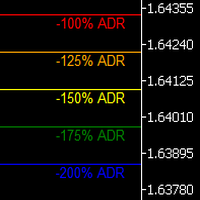
Uncover the market’s secret zones with the ADR Levels+ Indicator. This dynamic tool plots ADR extension levels at 100%, 125%, 150%, and 200% right on your chart. In most cases, price dances between these boundaries—but when it breaks out, it often signals a prime opportunity for a mean reversion trade or the start of an evolving trend. Plus, an integrated alarm system triggers as soon as these key levels are reached, ensuring you never miss a lucrative trading opportunity. Elevate your strategy
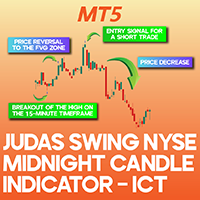
Judas Swing NYSE Midnight Candle Indicator ICT MT5 The Judas Swing Indicator is designed to operate between midnight and 5:00 AM New York time , offering precise buy and sell signals by detecting Change of Character (CHoCH) , Fair Value Gaps (FVGs) , and order block zones . This tool highlights CHoCH occurrences and price pullbacks to FVGs or order blocks with a gray arrow . If all trading conditions align, a green arrow represents a buy signal, whereas a red arrow signifies a sell opportunity.
NormaDevWaves is a manual system designed to trade the most juicy and liquid pairs, such as EURUSD, GBPUSD, and XAUUSD. Main idea: system implements the concept of a base indicator and utilizes statistical principles of correlation between price flow determination metrics in relation to standard deviations of prices from their driving force. This allows for a deep analysis of market behavior and the identification of hidden patterns. Market Adaptation: thanks to a balanced consideration of sh
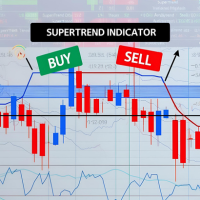
The Machine Learning Supertrend is a highly effective trading indicator specifically designed to identify and illustrate potential buy and sell signals through the use of clearly marked arrows.
One of the key advantages of this indicator is that it operates as a leading indicator, meaning it anticipates market movements rather than following them. Unlike many traditional indicators, the Machine Learning Supertrend does not lag or repaint, ensuring the signals provided are timely and reliable.
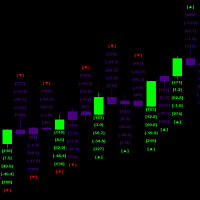
This indicator helps identify the start of significant market movements by analyzing candle patterns and their relative price action strength Key Features: Color-coded candles showing strong and weak movements Labels displaying key metrics for each candle Built-in wave and movement tolerance settings\ Pay close attention to the values of the red and green colored text labels as they are the most important Factor of whether or not a signal will be successful How to Use: Look for Strong Sig

Long&Short Cointegration Analyzer An advanced tool for traders looking to profit from cointegration. Analyzes any asset pair for Long&Short strategies. What does the Long&Short Cointegration Analyzer do? Identifies cointegrated pairs that revert to the mean, ideal for profitable trades. Provides a detailed panel with statistical data for confident decisions. Works with any currency pair, on any timeframe.
Find buying and selling opportunities based on cointegration. Minimize risks with a relia
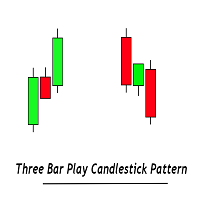
The Three Bar Reversal Pattern indicator identifies and highlights three bar reversal patterns on the user price chart.
The script also provides an option for incorporating various trend indicators used to filter out detected signals, allowing them to enhance their accuracy and help obtain a more comprehensive analysis.
USAGE Figure 1 The script automates the detection of three-bar reversal patterns and provides a clear, visually identifiable signal for potential trend reversals. Fi
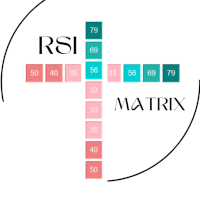
With the RSI matrix, you can display the RSI values from M5 to W1 very easily and clearly. This gives you a quick overview of the trend strengths on all superordinate and subordinate timeframes.
The threshold values used are 30, 40, 50, 60, 70. If these are exceeded or fallen short of, this is indicated by coloring. The colors can be customized by you.
* You can display the time frames you are interested in
* The display can be vertical or horizontal
* Colors can be set for the threshold va
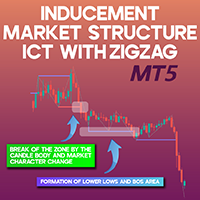
ICT Market Structure Indicator with Inducements MT5 The ICT Market Structure Indicator with Inducements is an advanced analytical tool built around Smart Money trading principles and is fully compatible with the MetaTrader 5 platform. This indicator utilizes three key components— Change of Character (CHoCH), Break of Structure (BOS), and Inducements (IDM) —to give traders a comprehensive and structured perspective on price action dynamics.
It automatically maps out Change of Character (CHoCH) le

Session Break Out Indicator – Lo Strumento Definitivo per il Trading Basato sulle Sessioni Unisciti ora e ricevi segnali live ogni giorno! https://t.me/sessionbreakout
Il Session Break Out Indicator è uno strumento all'avanguardia progettato per aiutare i trader a monitorare le sessioni di mercato e utilizzare strategie di trading basate sul tempo in modo efficace. I trader professionisti sanno che il tempo gioca un ruolo cruciale nel mercato forex, poiché la forza e la volatilità delle v
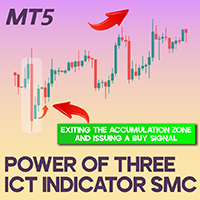
Power of Three ICT Indicator in Smart Money Concept MT5 The Power of Three Indicator is an advanced trading tool available for MetaTrader 5 , designed to highlight three crucial market phases: Accumulation, Manipulation, and Distribution , which align with Smart Money trading principles. These phases represent distinct price behaviors, guiding traders in analyzing market stability, liquidity movements, and directional trends. The indicator marks accumulation zones with red boxes, while manipulat

Sblocca un trading di precisione con Predator VWAP & Fibonacci!
Migliora la tua strategia di trading con questo indicatore semplice , che combina le dinamiche del VWAP con i rapporti di Fibonacci. Identifica i livelli chiave di supporto e resistenza e conferma potenziali breakout, inversioni e pattern in diverse strategie come SMC, ICT, Gann, Elliott Wave e altro ancora. Include un filtro di Kalman per un VWAP più fluido. Bonus: Ottieni la conferma dei rapporti di Fibonacci per configurazioni
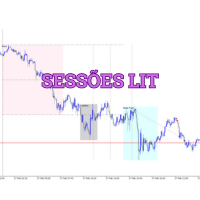
Domina il Mercato con l'Esclusivo Indicatore Sessões LIT! L'indicatore Sessões LIT è stato sviluppato appositamente per i trader che utilizzano la strategia LIT (Liquidity Inducement Trader) . Con esso, avrai una visualizzazione chiara e precisa delle principali sessioni di trading, oltre a marcature strategiche per identificare zone di liquidità e punti chiave del mercato. Tutto questo è personalizzabile e intuitivo, direttamente sul tuo MetaTrader 5. Vantaggi Principali: Visualizzazione
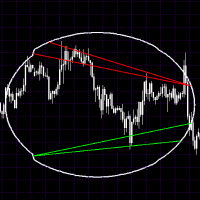
Trading concept: When price touches or exceeds the upper circle boundary = potential sell signal (overbought) When price touches or falls below the lower circle boundary = potential buy signal (oversold) The circle acts like a dynamic support/resistance band around the opening price The numbered points (1-24) help identify where in the cycle the price currently is This is similar to using Bollinger Bands or other envelope indicators, but with a fixed radius instead of standard deviations.
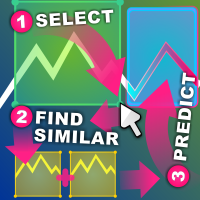
Indicatore di azione dei prezzi simili L'azione dei prezzi simile troverà sequenze passate di modelli di candele il più possibile simili a un'area del grafico che hai selezionato.
L'indicatore eseguirà una ricerca a partire da subito prima della prima candela della regione di azione dei prezzi che hai selezionato fino alla prima barra più vecchia del grafico.
Ci sono diversi criteri per valutare la somiglianza tra 2 sequenze: Le sequenze devono essere identiche in lunghezza, se la regione sel
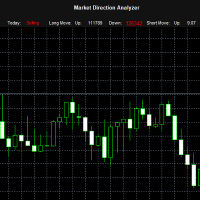
The "Market Direction Analyzer" is a technical indicator designed to provide traders with a comprehensive analysis of market trends, momentum, and potential reversals. By integrating multiple analytical tools, it offers a multi-dimensional perspective on market conditions, aiding in more informed trading decisions.
Using the Market Direction Analyzer in Trading: Trend Confirmation: By analyzing the aggregated sentiment score derived from its components, traders can confirm the prevailing market
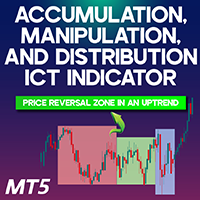
Accumulation, Manipulation, and Distribution ICT Indicator MT5
The AMD indicator is a sophisticated and highly effective tool designed for MetaTrader 5. By analyzing price fluctuations and trading volume across specific market sessions, it classifies price behavior into three key stages: Accumulation, Manipulation, and Distribution . To ensure clear distinction, the indicator highlights the Accumulation phase in pink, the Distribution phase in blue, and the Manipulation phase in green. «Indicat

Always Win Currency Strength Analyzer: Il dashboard definitivo per MT5 Questo indicatore autonomo per MT5 analizza la forza delle valute in tempo reale e offre avvisi personalizzabili. Essenziale per scalper e trader di tendenza. Caratteristiche principali:
Monitoraggio in tempo reale – Coppie forex e oro (XAU).
Analisi multi-tempo – Forza attuale, 1h, 4h, 8h, 24h e 1 settimana fa.
Avvisi personalizzabili – Imposta soglie per valute forti/deboli.
Dashboard – Visualizza i movimenti diret
VarMomentPulse is a unique manual trading algorithm developed with precision and flexibility in mind, based on an extensive historical data cluster. Its operation is grounded in the principles of analyzing crossovers between normalized moving averages and dispersions across various time intervals, enabling it to uncover new opportunities in evaluating market trends. Key Features of the VarMomentPulse Indicator: Adaptability to Volatility:The use of price dispersion analysis allows VarMomentPul

Overview The ToughCookie Indicator is a powerful and versatile tool designed specifically for traders employing Dollar-Cost Averaging (DCA) strategies. This indicator enhances your trading experience by providing detailed position information, visualizing the average entry price as a horizontal line, and integrating a customizable Simple Moving Average (SMA) for trend and entry identification. Ideal for both novice and experienced traders, ToughCookie streamlines decision-making and offers real

Gold Finger Buy Sell Arrows - Trend Trading Indicator with Moving Average Filter
Gold Finger is a powerful and versatile trend-following indicator designed for MetaTrader 5 (MT5) that combines the classic buy/sell signal logic with an optional Moving Average (MA) filter for enhanced accuracy. This indicator generates clear Buy and Sell signals with customizable arrow visuals and a robust alert system, including terminal alerts, mobile notifications, and email notifications. Perfect for trader
Haven Trend Tracker PRO è un indicatore professionale per determinare con precisione la tendenza su tutti i mercati finanziari. Monitorizza i movimenti dei prezzi e aiuta i trader a prendere decisioni di trading basate su segnali chiari. Altri prodotti -> QUI Caratteristiche principali: Visualizzazione chiara della tendenza - visualizzazione colorata della linea di tendenza con un sistema intuitivo: blu per tendenza al rialzo, rosso per tendenza al ribasso Segnali di trading chiari - le frecce

Fimathe Indicator The Fimathe Indicator is a tool for MetaTrader 5 designed to help traders identify support, resistance, neutral zones, and price channels. It features an interactive interface for drawing and managing support and resistance levels, generating take-profit channels and neutral zones, and providing visual and sound alerts for breakouts. Key Features Support and Resistance Lines: Dynamic and draggable lines to identify key levels. Reference Channel: Creates a channel between su
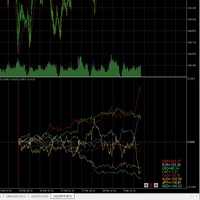
This indicator shows currency strength starting from the higher Zigzag.
In the parameter add_after, enter the additional characters used by each company.
Example: EURUSD_z → _z
Zigzag_timeframe determines the time frame of the Zigzag, but if the Zigzag timeframe is lower, the relevant timeframe will be used.
The left and right buttons at the bottom of the indicator move the Zigzag apex back and forth.
You can also move it to any location by selecting the vertical line that is the starting
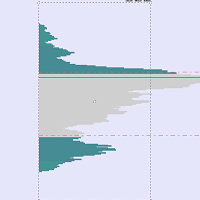
AVVISO IMPORTANTE – RICHIESTI LICENZA E ATTIVAZIONE
Istruzioni per l’attivazione:
Dopo aver completato l’acquisto, contattaci immediatamente per ricevere la tua chiave di licenza, password o i dettagli di attivazione. Senza questi, il software non funzionerà. Siamo qui per garantire un processo di attivazione fluido e assisterti con qualsiasi domanda.
Personalizzazione multilingue
Per migliorare la tua esperienza di trading, offriamo una personalizzazione completa del software in dive
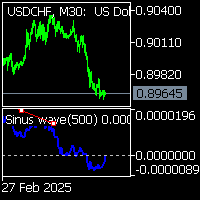
Sinus wave indicator is a extra ordinary oscillator.to find divergency.for mt5 it works all pairs and all timeframes. suitable for experienced and beginner traders.. indicator works on toward of the prices... while sinus wave go up side that means prices will up. and while sinus wave go down that means prices is going down. it gives divegency when trend reversals. there is wave to set default 500. on pictures divergency lines and letters has been drawn by hand.to explain how it works.
Title: MACD Signals Discover the MACD Signals indicator – your reliable assistant in the world of trading! Description: The "MACD Signals" indicator is designed to make your trading more successful and efficient. It displays signals on the main chart as bright vertical lines that are easy to spot. You can customize the color and thickness of these lines to perfectly match your style and preferences. Features: Signals: Vertical lines on the main chart that stand out among other elements.

L'indicatore per MT5 Currency Strength Inspector (CSI) misura e visualizza in modo intuitivo la forza relativa delle singole valute. Viene valutato l'interesse dei grossi investitori sulle principali valute del mercato forex (specificatamente AUD, CAD, CHF, EUR, GBP, JPY, NZD, e USD), considerandone gli andamenti rispetto a tutte le altre nello stesso paniere. Si aiuta in questo modo il trader ad avere una visione globale del mercato e del "sentimento" sottostante, come pure a identificare le m
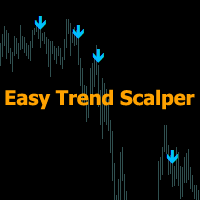
L'indicatore " Easy Trend Scalper MT5 " è progettato per il trading di scalping all'interno delle direzioni di tendenza.
Principio di funzionamento dell'indicatore.
L'indicatore determina in quale direzione si sta muovendo il mercato.
Le frecce rosse grandi indicano una direzione rialzista.
Frecce blu grandi: direzione ribassista.
All'interno di un trend rialzista o ribassista, esiste un algoritmo per generare segnali per lo scalping sotto forma di piccole frecce.
Le frecce arancioni indicano

Support & Resistance Auto Plot Lines Indicator for MT5 – Perfect for Scalping! Make your trading easier with our Support & Resistance Auto Plot Lines indicator for MT5. This powerful tool automatically detects key support and resistance levels on your chart, helping you make better trading decisions with minimal effort. Why Choose This Indicator? Perfect for Scalping – Quickly identify strong price zones for fast, precise entries and exits.
Automatic Level Detection – No need to manually dra
Il MetaTrader Market è il posto migliore per vendere robot di trading e indicatori tecnici.
Basta solo sviluppare un'applicazione per la piattaforma MetaTrader con un design accattivante e una buona descrizione. Ti spiegheremo come pubblicare il tuo prodotto sul Market per metterlo a disposizione di milioni di utenti MetaTrader.
Ti stai perdendo delle opportunità di trading:
- App di trading gratuite
- Oltre 8.000 segnali per il copy trading
- Notizie economiche per esplorare i mercati finanziari
Registrazione
Accedi
Se non hai un account, registrati
Consenti l'uso dei cookie per accedere al sito MQL5.com.
Abilita le impostazioni necessarie nel browser, altrimenti non sarà possibile accedere.