Смотри обучающее видео по маркету на YouTube
Как купить торгового робота или индикатор
Запусти робота на
виртуальном хостинге
виртуальном хостинге
Протестируй индикатор/робота перед покупкой
Хочешь зарабатывать в Маркете?
Как подать продукт, чтобы его покупали
Платные технические индикаторы для MetaTrader 5 - 64
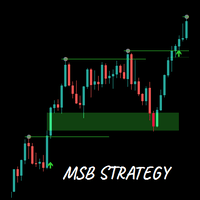
Capitalized on market structure and price gaps
The MSB Strategy indicator identifies swing highs and lows, detects high probability breakouts and price gaps (better knows as FVGs) which when price retests offer high probability entries. The indicator will draw an arrow to mark breakouts and when detected draw a rectangle FVG zone which you can use to define high probability entries. The 200 EMA is included to filter out noise and false signals. Summary of features Alerts on market structure br
Представляем Индикатор Следования за Трендом на Тройной EMA с Сигналами – идеальный инструмент для трейдеров, стремящихся к точной идентификации трендов и получению четких сигналов на покупку/продажу! Основные особенности: Анализ тренда на основе Тройной EMA : Индикатор использует две тройные экспоненциальные скользящие средние (TEMA1 и TEMA2) для эффективного захвата краткосрочных и долгосрочных трендов. TEMA1 быстро реагирует на изменения цен, в то время как TEMA2 фильтрует рыночный шум, помог
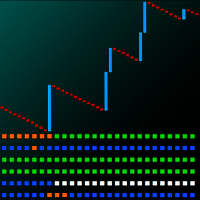
ASPCT Boom Crash Omniscope Описание ASPCT Boom Crash Omniscope - это скальперский индикатор, разработанный для анализа и визуализации движений цены на индексах Boom и Crash. Индикатор отслеживает шесть различных индексов: Boom 1000, Boom 500, Boom 300, Crash 1000, Crash 500 и Crash 300. Особенности Отображение сигналов для шести различных индексов Boom и Crash Использование цветовых индикаторов для обозначения различных рыночных состояний Отдельное окно индикатора с кнопками быстрого переключени
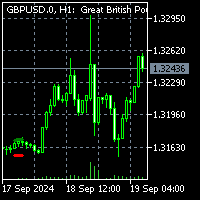
To get access to MT4 version please click here . This indicator is not a standard indicator and you may get into trouble installing it. Please contact via private chat if you face trouble. This is exact conversion from TradingView: "Consolidation Zones - Live" by "LonesomeTheBlue". This is a light-load processing indicator. Updates are available only upon candle closure. Buffers are available for processing in EAs. It is a repaint indicator. So previous buffer values do not represent exactly wh
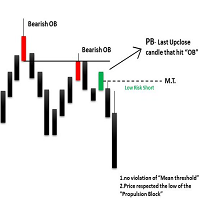
The ICT Propulsion Block indicator is meant to detect and highlight propulsion blocks, which are specific price structures introduced by the Inner Circle Trader (ICT). Note: THIS IS MTF version. Single Timeframe version avaiable at here
Propulsion Blocks are essentially blocks located where prices interact with preceding order blocks. Traders often utilize them when analyzing price movements to identify potential turning points and market behavior or areas of interest in the market.

Asia Range STDV I ndicator
This Indicator is designed not only to identify the Asia session trading range and Standard Deviation levels but also to assist traders in creating a systematic entry and exit strategy based on the higher timeframe daily trend . The indicator supports both bullish and bearish scenarios, allowing traders to focus on key moments when the Asia range's high or low is "swept" (broken) in line with the confirmed trend. Strategy Overview: 1. Confirming the Daily Trend (B
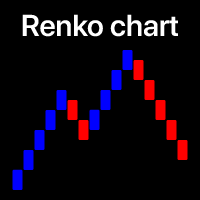
Filter out small price movements and focus on the larger trend . Renko chart indicator will help you to filter out a minor price movements so that you can focus on the overall trend. The price must move a specified amount to create a Renko brick. This makes it easy to spot the current trend direction in which the price is moving. My #1 Utility : includes 65+ features | Contact me if you have any questions | MT4 version In the settings of the indicator, you can configure: Calculation Se

VWAP Multi – Your Comprehensive Volume Weighted Average Price Indicator Overview:
VWAP Multi allows you to calculate the Volume Weighted Average Price (VWAP) across multiple timeframes, helping you analyze the market based on volume and price movements. This indicator supports VWAP calculations on daily, weekly, monthly, yearly, and session-based levels. Key Features: Multiple Timeframes: Calculate VWAP based on daily, weekly, monthly, yearly, or session periods. Flexible Price Types: Choose f
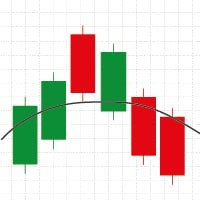
Скользящая средняя Вайлдера (Wilder's MA) — это тип сглаженной скользящей средней, разработанный Дж. Уэллесом Вайлдером. Она придаёт большее значение последним данным, при этом оставаясь более сглаженной по сравнению с традиционными скользящими средними. Главное отличие между скользящей средней Вайлдера и стандартной экспоненциальной скользящей средней (EMA) заключается в способе её расчёта. Формула, используемая в MA Вайлдера, включает фактор сглаживания, который уменьшает влияние резких скачко

Silver Bullet Indicator - Optimize Your Market Analysis with the ICT Strategy Our Silver Bullet indicator is designed to help you conduct clearer and more effective analysis based on ICT's popular Silver Bullet Strategy. With advanced tools and customizable features, this indicator enhances your ability to identify trading opportunities. Key Features: Information Panel: Provides key data for your market analysis: DOL (Daily Objective Level): The target price for the session, where you should foc
We present to your attention a unique trading advisor called Stabilized DEMA cross robot designed for working on the 1-hour timeframe. It is used for the most popular pairs: AUDUSD, EURUSD, GBPUSD and USDCAD. Based on the scalping method, this robot uses a custom DEMA indicator and a standard DPO indicator to determine the trend state. Each new bar is classified into four main classes of signals confirmed by a two-stage filter of false signals.
System closes deals only after confirming buy

WaveTrend 3D is the mql version of this oscillator (By jdehorty and LazyBear). WaveTrend 3D (WT3D) is a novel implementation of the famous WaveTrend (WT) indicator and has been completely redesigned from the ground up to address some of the inherent shortcomings associated with the traditional WT algorithm.
WaveTrend 3D is an alternative implementation of WaveTrend that directly addresses some of the known shortcomings of the indicator, including its unbounded extremes, susceptibility to whip
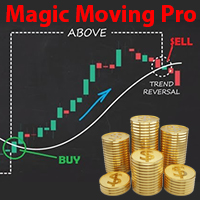
Представляем «Золотой индикатор» для NASDAQ 100!
Ищете мощный инструмент для повышения вашего успеха в торговле NASDAQ 100? Вы на правильном пути! Наш эксклюзивный индикатор был тщательно разработан после двух лет обширных исследований и анализа движения NASDAQ 100. Этот продвинутый индикатор скользящих средних использует принципы золотого сечения, уровни Фибоначчи и углы Ганна, чтобы точно определять моменты пересечения цены и скользящих средних. Почему стоит выбрать этот индикатор? Простота

Этот усовершенствованный индикатор MACD сохраняет основные функции стандартного MACD, предлагая при этом несколько дополнительных функций: Окрашивание гистограммы: Гистограмма использует четыре разных цвета для четкого отображения увеличений и уменьшений. Светло-зеленый для увеличивающихся положительных значений, серый для уменьшающихся положительных значений, красный для уменьшающихся отрицательных значений и оранжевый для увеличивающихся отрицательных значений. Стрелки пересечения сигнальной л

Этот код создает пользовательский индикатор для платформы MetaTrader 5. Индикатор генерирует сильные сигналы покупки и продажи, используя комбинацию ZigZag, скользящей средней (MA) и индекса относительной силы (RSI). Вот подробное объяснение кода:
Определение и свойства индикатора: - Индикатор отображается в окне графика. - Использует 5 индикаторных буферов и 3 графика. - Отдельные графики определены для ZigZag, сигналов покупки и продажи.
Входные параметры: - Определены различные параметры
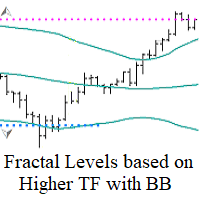
Fractal Levels based on Higher TF with BB Filter — этот инструмент предназначен для построения точных уровней поддержки и сопротивления на основе фракталов со старшего таймфрейма, отфильтрованных с помощью индикатора Bollinger Bands. Он предоставляет вам сигналы на покупку и продажу с удобными оповещениями. Принцип работы:
Индикатор анализирует фрактальные уровни, отфильтрованные с помощью индикатора Bollinger Bands на старшем таймфрейме, и отображает их на вашем текущем графике. Вы можете
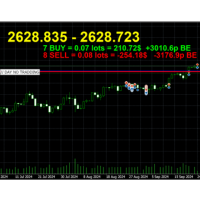
Breakeven Line v2 Indicator is a MetaTrader indicator that calculates breakeven level based on all open positions and displays it on your chart as a horizontal line. Additionally, it will calculate the total number trades, the total number of lots, and the distance to the breakeven line in points and profit/loss. The indicator is available for both MT5. Why use Breakeven Line Indicator? When you have multiple trades opened on a single symbol, it can be difficult to tell where your average ent

This LogReturnsIndicator.mq5 calculates and displays the logarithmic returns ("log returns") of the closing prices of a financial asset.
It computes the log-returns for each period using the formula:
log return=ln(close[i]close[i−1])
This measures the relative variation between consecutive closing prices in logarithmic terms, a method often used in finance to analyze the returns of financial assets.
Benefits of Log Returns:
Logarithmic returns are preferred in certain financial

This MQL5 indicator, named "Change Of State-(Poisson Law).mq5", is designed to identify significant change points in price movements using a model based on the Poisson distribution. Here’s a summary of how it works:
Purpose of the Indicator
The indicator aims to mark significant change points on the price chart by using arrows to indicate when price variation exceeds a threshold defined by the Poisson distribution.
Chart Display
The points where price variations exceed the Poisson thresh

This algorithm is a custom indicator for MetaTrader 5 (MT5) that plots two simple moving averages (SMA) on a financial chart to assist in the technical analysis of price movements. Here's what the algorithm does: Two Simple Moving Averages (SMA) : The indicator uses two different SMA periods: The first SMA (SMA1) has a longer period, set to 8 periods by default (SMA 8). The second SMA (SMA2) has a shorter period, set to 3 periods by default (SMA 3). Calculation of the Moving Averages : For each

This is an indicator that combines the Rate of Change and Bollinger Bands, with several functions: Identifying trends. Detecting overbought and oversold conditions. Determining potential reversal points. Applicable Chart: M5 The indicator is composed of four lines: the Upper Band, Lower Band, Fast Line, and Slow Line. Usage 1: Identifying Trends When the yellow line is above the red line and the green and blue lines are expanding, it indicates an upward trend. Conversely, if the yellow line is b

Machine Learning Adaptive SuperTrend - Take Your Trading to the Next Level!
Introducing the Machine Learning Adaptive SuperTrend , an advanced trading indicator designed to adapt to market volatility dynamically using machine learning techniques. This indicator employs k-means clustering to categorize market volatility into high, medium, and low levels, enhancing the traditional SuperTrend strategy. Perfect for traders who want an edge in identifying trend shifts and market condit
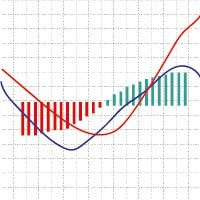
MACD Вайлдера (Moving Average Convergence Divergence) — это вариант традиционного индикатора MACD, использующий технику сглаживания Вайлдера для более точных сигналов тренда. Индикатор состоит из трёх основных компонентов: Линия MACD : Это разница между двумя экспоненциальными скользящими средними (EMA) — быстрой EMA и медленной EMA. Стандартные периоды обычно составляют 12 для быстрой EMA и 26 для медленной EMA. Линия сигнала : Сглаженная версия линии MACD, использующая скользящую среднюю Вайлд
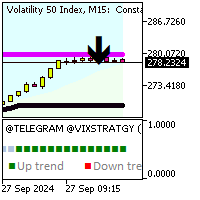
Ultimate Forex Trading Indicator Elevate your trading with our multi-functional indicator packed with advanced features! Key Features: 1. Non-repainting indicator for accurate signals 2. Max activations for peace of mind 3. 7+ strategies integrated for diverse trading styles 4. 10 Indicators all in one for comprehensive analysis 5. Perfect for Day and Swing Trading strategies 6. Trend following, reversal, and scalping strategies built-in 7. Create your own Custom strategies 8. Prop firm ready
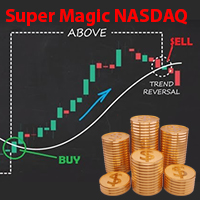
Индикатор, который у вас сейчас есть, безусловно, является одним из лучших инструментов для торговли на NASDAQ 100 в таймфреймах 1 минута и 5 минут. Хотя он также хорошо работает на других таймфреймах, он специально разработан для этих двух интервалов. Выдающаяся особенность этого индикатора заключается в том, что он не требует начальной настройки — просто запустите его и доверьтесь его сигналам. Точность и эффективность Этот инструмент тщательно откалиброван и сочетает в себе несколько индикато
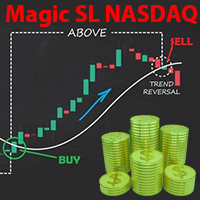
The indicator that is now available to you is undoubtedly one of the best tools for trading in the NASDAQ 100 market , especially in the 1-minute and 5-minute timeframes. It is meticulously designed for precision and can be adjusted for other timeframes as well. Simply run it and trust its powerful signals . Key Features: Specialized performance in the 1-minute and 5-minute timeframes : While this indicator works in other timeframes too, its primary focus is on these two timeframes. Compatibilit

aИндикатор Gann Box — это мощный и многофункциональный инструмент, разработанный для помощи трейдерам в выявлении и использовании ключевых уровней на рынке. Этот индикатор позволяет нарисовать на графике прямоугольник, который автоматически разделяется на несколько зон со стратегическими уровнями 0, 0.25, 0.50, 0.75, 1 . Когда цена касается одного из этих уровней, срабатывают предупреждения, что является ценным помощником в принятии торговых решений. Вы мгновенно видите, как развивается рынок п
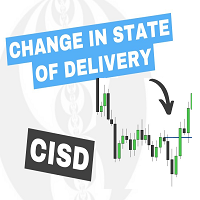
The Change In State Of Delivery (CISD) indicator detects and displays Change in State Of Delivery, a concept related to market structures.
Users can choose between two different CISD detection methods. Various filtering options are also included to filter out less significant CISDs.
USAGE Figure 2 A Change in State of Delivery (CISD) is a concept closely related to market structures, where price breaks a level of interest, confirming trends and their continuations from the resul
MT4 Version: https://www.mql5.com/en/market/product/124141 A Day in the Life of a Trader: Discovering the Forex Matrix Dashboard In the fast-paced world of forex trading, keeping track of multiple currency pairs can feel overwhelming. That’s where the Forex Matrix Dashboard comes in, making the life of a trader much easier. Imagine opening the dashboard and instantly seeing all your favorite currency pairs, like EUR/USD, GBP/USD, and USD/JPY, displayed clearly with their latest prices. No more
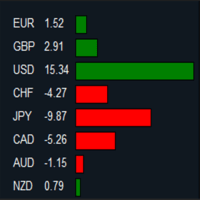
MT4 Version: https://www.mql5.com/en/market/product/124140 Imagine you’re at the helm of your trading terminal, scanning charts of various currency pairs, trying to figure out which ones are strong, which ones are weak, and where the real opportunities lie. It’s a lot to process—flipping between charts, calculating movements, and comparing performance. But what if all of that could be done for you, neatly displayed in one place? That’s where this Forex Strength Dashboard comes in. Picture thi

Дельта: танец цен на биржевом паркете Дельта - это не просто цифра, а отражение динамики рыночных сил, танцующих на биржевом паркете. Она показывает разницу между текущей ценой акции и ее начальной стоимостью. Подъем: Дельта в плюсе - это сигнал оптимизма. Цена акции растет, как пышный цветок, раскрывающийся под лучами солнца благоприятных новостей. Инвесторы видят перспективы и готовы платить больше за владение этой ценной бумагой. Падение: Дельта в минусе - это знак неуверенности. Цена акц

MT4 Version : https://www.mql5.com/en/market/product/124152 You’re sitting in your trading room, sipping coffee as the markets start their day. The screen in front of you is alive with numbers, price movements, and endless charts. Each one demands your attention. But you don’t have time to dive into every single detail. You need a quick, reliable way to read the market’s mood. That’s when you glance at your Sentiment Dashboard—a custom-built tool designed to simplify your trading decisions. Thi
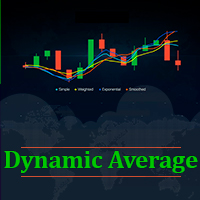
Вы наверняка замечали, каким непредсказуемым может быть движение цены. Иногда цена движется в определённом направлении почти без коррекций. В такие периоды хорошо работают трендовые стратегии. Однако как только направленное движение завершается, торговая стратегия перестаёт быть эффективной. Движения цены становятся резкими и "хаотичными". Цена резко меняет своё направление. Трендовые стратегии начинают выдавать много ложных сигналов, и это приводит к большому количеству убыточных сделок. В так
This indicator is the mql version of the SuperTrend indicator. SuperTrend is one of the most common ATR based trailing stop indicators.
In this version you can change the ATR calculation method from the settings. Default method is RMA, when the alternative method is SMA. The indicator is easy to use and gives an accurate reading about an ongoing trend. It is constructed with two parameters, namely period and multiplier. The default values used while constructing a superindicator are 10 for

Что такое Heiken Ashi? Heiken Ashi — это метод построения графиков, который можно использовать для прогнозирования будущего движения цены. Индикатор строит свечи, похожие на традиционные. Однако в отличие от обычного свечного графика, график Heiken Ashi пытается отфильтровать часть рыночного шума для лучшего определения трендовых движений на рынке.
Как рассчитывается Heiken Ashi? Heiken Ashi использует формулу COHL, которая означает «Закрытие, Открытие, Максимум, Минимум». Это четыре ком

Introducing the innovative AsiRocsOscillator — your reliable guide in the world of financial markets! Combining the power and accuracy of an oscillator with the speed of reaction for early signals, but confirmed by session close, AsiRocsOscillator offers unique opportunities for traders of any level.
AsiRocsOscillator key features: Multilevel market analysis: analyzes all price fluctuations, gaining access to a complete picture of the market. Accurate assessment of strength and direction: pr

Improve Your Trading with Buraq RSI Detector!
Buraq RSI Detector makes trading easier by spotting important RSI levels and marking them on your chart with clear bars. This helps you see exactly when to enter or exit trades. Key Features: Set Your Own RSI Levels: Choose the levels you want, and Buraq RSI Detector will mark them when the RSI touches those points. Clear Visual Signals: Bars appear on your chart as soon as the RSI hits your chosen levels, making it easy to find trading opportuniti
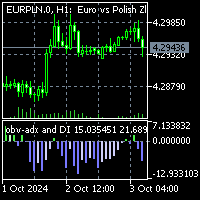
To get access to MT4 version please click here . This is the exact conversion from TradingView: "OBV ADX and DI" by " kocurekc ". This is a light-load processing and non-repaint indicator. All input options are available. Buffers are available for processing in EAs. You can message in private chat for further changes you need. I removed the background coloring option to best fit into MT platform graphics.

Want to create an Expert Advisor (EA) using an indicator that doesn’t store the required data in a buffer (visible in the Data Window) and only draws objects on the chart? This solution captures chart objects and places them into buffers, allowing you to create an EA—whether you're using EA Builder Pro or writing code with iCustom—by selecting the correct values using those buffers (modes). It works with any object visible in the Object List that has a unique Name or Description, such as: Trend

Indicator Description The indicator " TrendFusion " is designed for MetaTrader 5 and offers a comprehensive analysis by combining key technical indicators such as RSI, EMA, ATR, ADX, and MACD. It helps traders make informed decisions by visually representing these indicators and highlighting potential trading opportunities. This tool is especially useful for analyzing market dynamics across various assets, such as currency pairs or stocks. Functionality RSI (Relative Strength Index): Measures m

Support Resistance Indicator The "Support Resistance" indicator is a versatile tool designed to help traders identify key support and resistance levels based on an underlying algorithm. These levels indicate price points where an asset historically experiences buying (support) or selling (resistance) pressure. The indicator allows traders to visualize these levels on their charts, making it easier to make informed decisions. All Products | Contact PARAMETERS: Timeframe :
Users can select th
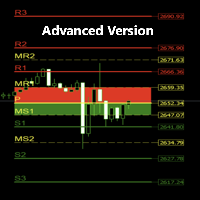
Detailed Description: The Pivot Points Buy Zone Advanced Indicator takes the concept of pivot points to a whole new level, providing traders with enhanced functionality, customizations, and in-depth visualizations. Unlike the free basic version, this advanced indicator allows users to customize more settings, analyze current and historical pivot points, enable potential buy (green) and sell (red) set-ups on the chart, use alerts and pop-up messages, ... etc. Extra Key Advanced Features: Fully C

Индикатор Neuro Trend использует современные технологии для предоставления ранних сигналов о разворотах трендов на рынках. Благодаря точной цветовой кодировке индикатор показывает текущее направление тренда: Зелёный сигнализирует о росте цен (бычий тренд), а Красный указывает на падение цен (медвежий тренд). Чем дальше индикатор от нулевой точки, тем сильнее выражен тренд. Значения выше нуля указывают на сильный восходящий тренд, а значения ниже нуля – на ярко выраженный нисходящий тренд. С помо
This indicator is the mql version of the SSLHybrid indicator (By Mihkel00). Description of TradingView version: This script is designed for the NNFX Method, so it is recommended for Daily charts only.
Tried to implement a few VP NNFX Rules
This script has a SSL / Baseline (you can choose between the SSL or MA), a secondary SSL for continiuation trades and a third SSL for exit trades.
Alerts added for Baseline entries, SSL2 continuations, Exits.
Baseline has a Keltner Channel setting

About indicator > The indicator is a function based on one value (open/high prices up to now) and then it is a mathematical representation of the whole function that is totally independent from any else values. So, if you ask yourself will the future be as it is on the graph... I can tell you - as it was the same as the trading function up to the moment "now"... In conclusion, the point of the indicator is to try to show the future of the trading function into eternity.
The graphic is sometim

The Поддержка Сопротивление Шепчущий MT5 мощный инструмент, разработанный для помощи трейдерам в определении важных уровней поддержки и сопротивления на рынке. Этот индикатор использует ценовое действие для динамического рисования красных линий сопротивления и зеленых линий поддержки на вашем графике, предлагая четкое и наглядное представление ключевых ценовых зон, где могут произойти потенциальные развороты или прорывы рынка. В отличие от традиционных методов, которые полагаются на

The Индикатор зоны FVG MT5 мощный инструмент, предназначенный для определения разрывов справедливой стоимости (FVG) на рынке, подчеркивающий ценовой дисбаланс между справедливой стоимостью и рыночной ценой. Это точное определение разрывов позволяет трейдерам определять потенциальные точки входа и выхода с рынка, значительно повышая их способность принимать обоснованные торговые решения. Благодаря интуитивно понятному и удобному интерфейсу индикатор FVG Zone автоматически сканирует гр

The 'Daily OHLC Levels Visualizer' is an indicator that displays the previous day's open, high, low and close levels as well as today's opening price in customizable color and style and optionally 2 vertical lines at customizable times to indicate a trading session. Main features of the Daily OHLC Levels Visualizer OHLC Display Shows previous day's Open, High, Low, and Close prices Additionally visualizes the current day's opening price Supports display of a customizable number of past days
Hi
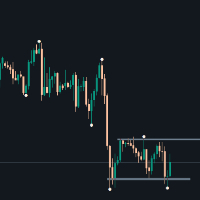
Enhance your chart analysis with the Dots indicator. This custom tool highlights key turning points in price action, allowing you to spot potential trend reversals and entry/exit opportunities at a glance. Features: Clear visual representation of market structure Customizable parameters for fine-tuning Efficient recalculation of recent price action Easy-to-use interface for traders of all levels

You can enter a sell when a red arrow appears and take profit according to your trading strategy or when a blue arrow appears. Buy when a blue arrow appears and take profit according to your strategy or when a red arrow appears. The stop for selling is always the last peak recorded by the price in the short term and the stop for buying is the last bottom recorded by the price in the short term. You should always manage your capital and not risk more than 10% of your capital.
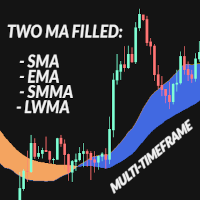
The Two MA Filled is a two moving averages indicator designed for traders seeking a more sophisticated and visual technical analysis. This indicator combines two customizable moving averages with a filling visual between them, allowing you to quickly visualize market trends and identify entry and exit opportunities. Key Features: Customizable Moving Averages: Set the periods and types of moving averages (SMA, EMA, SMMA, LWMA) for the fast and slow averages, tailoring the indicator to your tradin

This indicator is based on the strategy shared by TheMas7er on his youtube channel.
The IDR/DR range will help you identify the high and low of the day once a candle closes above or below the the DR levels.
The IDR/DR range is determined 1 hour after session open, 09:30 am est.
I have incorporated the fibonacci tool to help you mark the retracement for a good entry in the premium or discount zone.
Important
This indicator is designed for the indices and M5 timeframe,
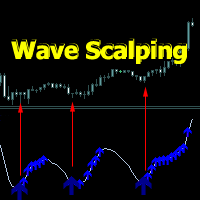
Индикатор Wave Scalping - краткосрочная стратегия торговли построенная по волновой системе. Включает в себя волновую линию, точки входа и сопровождения позиций.
Сигнальные стрелки появляются по закрытию свечи.
Состоит из волновой линии по которой строятся сигнальные стрелки, и стрелок - подтверждения направлений после сигнальных стрелок.
Сигнальные стрелки строятся с учетом направления трендового направления. При подтверждении сигнальных стрелок есть несколько типов оповещений.
Для настр
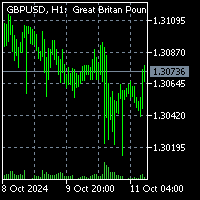
To get access to MT4 version please click here . This is the exact conversion from TradingView: "VolATR" by "barrettdenning" This is a light-load processing. This is a non-repaint indicator. All input options are available. Buffers are available for processing in EAs. You can message in private chat for further changes you need.
Thanks for downloading...

Индикатор Дневного Диапазона Цен Индикатор Дневного Диапазона Цен — это мощный инструмент, предназначенный для отображения ключевых уровней цен для каждого торгового дня, который помогает трейдерам принимать взвешенные решения на основе динамики рынка. Этот индикатор автоматически рисует прямоугольники на графике, визуально выделяя три ключевые ценовые точки: Цена открытия дня : Отмечена особым цветом, чтобы легко определить, где начался рынок каждый день. Максимум дня (самая высокая цена дня) :

Vice Daily Opening Indicator for MQL5 Overview:
Introducing the Vice Daily Opening Indicator for MQL5, a powerful tool designed for traders who want to enhance their daily trading strategies. This intuitive indicator provides clear visual cues on your trading chart by marking the opening price of each day with a prominent horizontal line. Key Features: Daily Opening Price Line: Automatically draws a horizontal line at the opening price of each day, giving traders a clear reference point for th

Технический индикатор AD (Accumulation/Distribution) — это инструмент технического анализа, который помогает определить, происходит ли накопление или распределение актива на рынке. Основные характеристики индикатора AD: Цель: Индикатор AD используется для оценки баланса между покупками (накоплением) и продажами (распределением) актива. Это позволяет трейдерам и инвесторам оценить силу текущего тренда и возможные развороты. Интерпретация: Рост индикатора: Когда индикатор AD растет, это ука

Технический индикатор AC (Accelerator Oscillator) измеряет ускорение или замедление текущей рыночной силы. Он разработан для выявления возможных точек разворота тренда и используется для определения момента покупки или продажи активов. Индикатор помогает трейдерам принимать решения, основываясь на изменениях в динамике рынка.
Данная реализация индикатора является его креативной версией. Поскольку стандартная версия очень ограничена встроенными в неё настройками, эта реализация имеет значите

Технический индикатор AO (Accumulation/Distribution) — это удачный индикатор для измерения рыночной динамики, который отражает конкретные изменения движущей силы рынка, что помогает определить силу тренда, включая точки его формирования и разворота. Индикатор AO– это инструмент технического анализа, который поможет вам торговать более эффективно.
Основные характеристики индикатора AO: Цель: Индикатор AO используется для оценки баланса между покупками (накоплением) и продажами (распределением)

Индикатор Снайперского Входа для MT5 Раскройте потенциал анализа на нескольких временных интервалах с нашим инновационным Индикатором Снайперского Входа для MetaTrader 5 (MT5). Этот мощный инструмент предназначен для помощи трейдерам в определении оптимальных точек входа на основе преобладающих трендов с высших временных интервалов, обеспечивая хорошо обоснованную торговую стратегию. Ключевые функции: Анализ на нескольких временных интервалах:
Легко анализируйте тренды с высших временных интер

Tyr Bands Indicator (IC MARKETS GOLD). Just drag and drop.
This indicators gets you entry points for the market. it is for gold, but you can configure for any other currency. Tyr Band works with BB and 3 different deviations, plus the Stochastic confirmation. So when the price closes below/above the BB Reversal Band (Red) and the Stochcastic is in the confirmation zone, then the arrow (buy/sell) appears. This arrow indicates that we can entry to the market up/down on the next opening. Since it
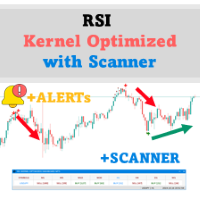
Только 10 копий по цене $49 – успейте купить, пока цена не повысилась до $99! Представляем революционный индикатор RSI Kernel Optimized with Scanner для MT5 — передовой инструмент, который переосмысливает традиционный анализ RSI, интегрируя мощный алгоритм оценки плотности ядра (KDE). Этот продвинутый индикатор не только предоставляет информацию о рыночных трендах в реальном времени, но и включает панель управления для одновременного сканирования нескольких валютных пар и таймфреймов. Давайте р

Automatic Fibonacci Levels Indicator The Automatic Fibonacci Levels Indicator is an essential tool for traders seeking to incorporate Fibonacci retracement and extension levels into their technical analysis seamlessly. This innovative indicator automatically identifies significant price movements and calculates key Fibonacci levels, providing traders with valuable insights into potential support and resistance areas. Key features: Automatic Calculation : Effortlessly plots Fibonacci levels base
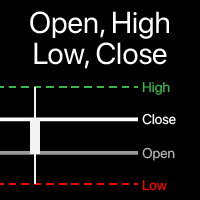
Visualization of Open, High, Low, Close levels on the chart You can choose any timeframe , not just the current one. The offset of the calculated bar can be adjusted : the current (floating) bar , or a set number of bars back . My #1 Utility : includes 65+ functions | Contact me if you have any questions | MT4 version In the settings of the indicator, you can configure: Offset of the calculated bar: 0 = current bar, 1 = previous bar, 2 = 2 bars back... "Include multiple bars " opti

Automatic Trendline Indicator The Automatic Trendline Indicator is a powerful tool designed to simplify technical analysis by automatically identifying and drawing trendlines on a price chart. It analyzes price movements to detect key support and resistance levels, plotting ascending and descending trendlines based on historical price action. This indicator helps traders identify market trends, potential breakout points, and reversal areas with minimal effort. Key features: Automatic Detection

Antabod Genius Indicator—an advanced trading tool designed to give you accurate buy and sell signals directly on your MetaTrader 5 platform. Harnessing the combined power of Moving Averages (MA) and the Stochastic Oscillator, this indicator helps you identify optimal entry and exit points with ease. Key Features: • Precision with Dual Moving Averages: The Genius Indicator uses a fast and slow MA to detect key market momentum shifts. Crossovers between the MAs serve as reliable indicators for pot

Special Fair Value Gap (SFVG) Indicator
Unlock your trading potential with the Special Fair Value Gap (SFVG) Indicator! This innovative tool identifies critical price imbalances in the market, helping you pinpoint potential buying and selling opportunities with precision.
Key Features: - Multi Timeframe - Smart Money Tool - Identifies Key Price Levels: Automatically detects STRONG HIGH PROBABILITY gaps in price action where retracements are likely to occur, allowing you to make informed t

# ConvolutionalAI Forex Predictor Pro
Поднимите свою торговлю на форексе на новый уровень с помощью передового искусственного интеллекта. ConvolutionalAI Forex Predictor Pro использует мощь глубокого обучения и сверточных нейронных сетей для обеспечения точных и своевременных прогнозов для рынка форекс.
## Ключевые особенности: - Продвинутый ИИ: Использует современные модели ONNX для точного анализа рынка - Прогнозы в реальном времени: Получайте актуальные прогнозы движения рынка - Простота
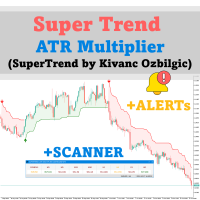
Только 10 копий доступны по цене $49 – успейте приобрести, пока цена не поднялась до $99! Представляем SuperTrend ATR Multiplier with Scanner for MT5 – универсальный и мощный инструмент, созданный, чтобы помочь вам оставаться впереди рыночных трендов, с возможностью настройки и оповещениями в реальном времени. Следуя проверенной логике SuperTrend от Kivanc Ozbilgic , этот индикатор обеспечивает точные сигналы трендов. Вы можете настроить метод расчета ATR между RMA (относительная скользящая сре

Antabod Multiplier , the ultimate trading indicator designed to simplify your decision-making process and maximize your trading potential. Built with a robust combination of moving averages and stochastic oscillators, this tool provides clear, actionable signals for both buy and sell opportunities. The Antabod Multiplier stands out with its dynamic trend detection and precision filtering, giving you real-time visual signals to catch trend reversals and optimal entry/exit points with ease. Whethe
Узнайте, как легко и просто купить торгового робота в MetaTrader AppStore - магазине приложений для платформы MetaTrader.
Платежная система MQL5.community позволяет проводить оплату с помощью PayPal, банковских карт и популярных платежных систем. Кроме того, настоятельно рекомендуем протестировать торгового робота перед покупкой, чтобы получить более полное представление о нем.
Вы упускаете торговые возможности:
- Бесплатные приложения для трейдинга
- 8 000+ сигналов для копирования
- Экономические новости для анализа финансовых рынков
Регистрация
Вход
Если у вас нет учетной записи, зарегистрируйтесь
Для авторизации и пользования сайтом MQL5.com необходимо разрешить использование файлов Сookie.
Пожалуйста, включите в вашем браузере данную настройку, иначе вы не сможете авторизоваться.