Regardez les tutoriels vidéo de Market sur YouTube
Comment acheter un robot de trading ou un indicateur
Exécutez votre EA sur
hébergement virtuel
hébergement virtuel
Test un indicateur/robot de trading avant d'acheter
Vous voulez gagner de l'argent sur Market ?
Comment présenter un produit pour qu'il se vende bien
Indicateurs techniques payants pour MetaTrader 5 - 64
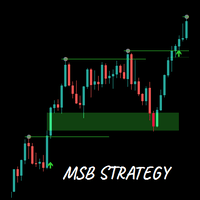
Capitalized on market structure and price gaps
The MSB Strategy indicator identifies swing highs and lows, detects high probability breakouts and price gaps (better knows as FVGs) which when price retests offer high probability entries. The indicator will draw an arrow to mark breakouts and when detected draw a rectangle FVG zone which you can use to define high probability entries. The 200 EMA is included to filter out noise and false signals. Summary of features Alerts on market structure br
Introducing the Triple EMA Trend Following + Signals Indicator – the perfect tool for traders seeking precise trend identification and actionable buy/sell signals! Key Features: Triple EMA Trend Analysis : This indicator uses two Triple Exponential Moving Averages (TEMA1 and TEMA2) to capture short-term and long-term trends effectively. TEMA1 reacts to rapid price changes, while TEMA2 filters out market noise, helping you stay on the right side of the trend. RSI and ATR Filters : It incorporates
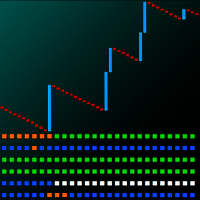
ASPCT Boom Crash Omniscope Description ASPCT Boom Crash Omniscope is a scalping indicator designed to analyze and visualize price movements on the Boom and Crash indices. The indicator tracks six different indices: Boom 1000, Boom 500, Boom 300, Crash 1000, Crash 500 and Crash 300. Peculiarities Display signals for six different Boom and Crash indices Using color indicators to indicate different market conditions Separate indicator window with buttons for quick switching between symbols Works ex
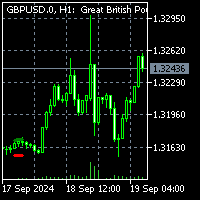
To get access to MT4 version please click here . This indicator is not a standard indicator and you may get into trouble installing it. Please contact via private chat if you face trouble. This is exact conversion from TradingView: "Consolidation Zones - Live" by "LonesomeTheBlue". This is a light-load processing indicator. Updates are available only upon candle closure. Buffers are available for processing in EAs. It is a repaint indicator. So previous buffer values do not represent exactly wh
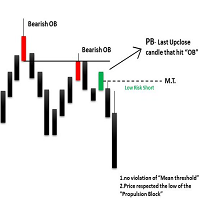
The ICT Propulsion Block indicator is meant to detect and highlight propulsion blocks, which are specific price structures introduced by the Inner Circle Trader (ICT). Note: THIS IS MTF version. Single Timeframe version avaiable at here
Propulsion Blocks are essentially blocks located where prices interact with preceding order blocks. Traders often utilize them when analyzing price movements to identify potential turning points and market behavior or areas of interest in the market.

Asia Range STDV I ndicator
This Indicator is designed not only to identify the Asia session trading range and Standard Deviation levels but also to assist traders in creating a systematic entry and exit strategy based on the higher timeframe daily trend . The indicator supports both bullish and bearish scenarios, allowing traders to focus on key moments when the Asia range's high or low is "swept" (broken) in line with the confirmed trend. Strategy Overview: 1. Confirming the Daily Trend (B
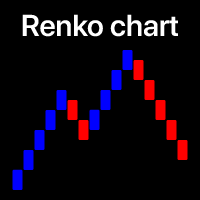
Filter out small price movements and focus on the larger trend . Renko chart indicator will help you to filter out a minor price movements so that you can focus on the overall trend. The price must move a specified amount to create a Renko brick. This makes it easy to spot the current trend direction in which the price is moving. My #1 Utility : includes 65+ features | Contact me if you have any questions | MT4 version In the settings of the indicator, you can configure: Calculation Se

VWAP Multi – Your Comprehensive Volume Weighted Average Price Indicator Overview:
VWAP Multi allows you to calculate the Volume Weighted Average Price (VWAP) across multiple timeframes, helping you analyze the market based on volume and price movements. This indicator supports VWAP calculations on daily, weekly, monthly, yearly, and session-based levels. Key Features: Multiple Timeframes: Calculate VWAP based on daily, weekly, monthly, yearly, or session periods. Flexible Price Types: Choose f
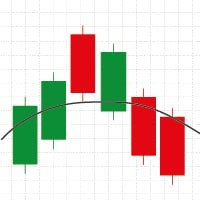
Wilder's Moving Average (Wilder's MA) is a smoothing technique developed by J. Welles Wilder, designed to reduce the impact of short-term price fluctuations and highlight longer-term trends. Unlike the standard Exponential Moving Average (EMA), Wilder's MA uses a unique smoothing factor, which gives it a slower and more stable response to changes in price. The calculation method emphasizes a more gradual adaptation to market changes, making it particularly useful in volatile markets. It helps tr

Silver Bullet Indicator - Optimize Your Market Analysis with the ICT Strategy Our Silver Bullet indicator is designed to help you conduct clearer and more effective analysis based on ICT's popular Silver Bullet Strategy. With advanced tools and customizable features, this indicator enhances your ability to identify trading opportunities. Key Features: Information Panel: Provides key data for your market analysis: DOL (Daily Objective Level): The target price for the session, where you should foc
We present to your attention a unique trading advisor called Stabilized DEMA cross robot designed for working on the 1-hour timeframe. It is used for the most popular pairs: AUDUSD, EURUSD, GBPUSD and USDCAD. Based on the scalping method, this robot uses a custom DEMA indicator and a standard DPO indicator to determine the trend state. Each new bar is classified into four main classes of signals confirmed by a two-stage filter of false signals.
System closes deals only after confirming buy

WaveTrend 3D is the mql version of this oscillator (By jdehorty and LazyBear). WaveTrend 3D (WT3D) is a novel implementation of the famous WaveTrend (WT) indicator and has been completely redesigned from the ground up to address some of the inherent shortcomings associated with the traditional WT algorithm.
WaveTrend 3D is an alternative implementation of WaveTrend that directly addresses some of the known shortcomings of the indicator, including its unbounded extremes, susceptibility to whip
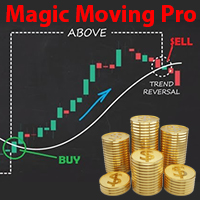
*Présentation de l'indicateur Golden pour le NASDAQ 100 !*
Vous recherchez un outil puissant pour améliorer votre succès de trading sur le NASDAQ 100 ? Ne cherchez plus ! Notre indicateur exclusif a été méticuleusement développé après deux ans de recherche approfondie et d'analyse des mouvements du NASDAQ 100.
Cet indicateur avancé de moyenne mobile utilise les principes du nombre d'or, les niveaux de Fibonacci et les angles de Gann pour identifier avec précision les points de croisement en

Cet indicateur MACD avancé conserve les fonctions de base du MACD standard tout en offrant plusieurs fonctionnalités supplémentaires : Coloration de l'histogramme : L'histogramme utilise quatre couleurs différentes pour montrer clairement les augmentations et les diminutions. Vert clair pour les valeurs positives croissantes, gris pour les valeurs positives décroissantes, rouge pour les valeurs négatives décroissantes et orange pour les valeurs négatives croissantes. Flèches de croisement de la

Bu kod, MetaTrader 5 platformu için özel bir gösterge oluşturur. Gösterge, ZigZag, Hareketli Ortalama (MA) ve Göreceli Güç Endeksi'nin (RSI) bir kombinasyonunu kullanarak güçlü alım ve satım sinyalleri üretir. İşte kodun ayrıntılı bir açıklaması:
İndikatör Tanımı ve Özellikleri: - Gösterge, grafik penceresinde görüntülenir. - 5 gösterge arabelleği ve 3 çizim kullanır. - ZigZag, alış sinyalleri ve satış sinyalleri için ayrı grafikler tanımlanır.
Giriş Parametreleri: - ZigZag, MA ve RSI için
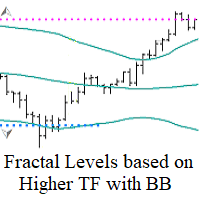
Fractal Levels based on Higher TF with BB Filter — Cet outil est conçu pour établir des niveaux précis de support et de résistance basés sur les fractales des unités de temps supérieures, filtrées à l’aide de l’indicateur Bollinger Bands. Il fournit des signaux d'achat et de vente avec des notifications pratiques. Principe de fonctionnement :
L'indicateur analyse les niveaux fractals filtrés à l'aide de l'indicateur Bollinger Bands sur une unité de temps supérieure et les affiche sur votre gra
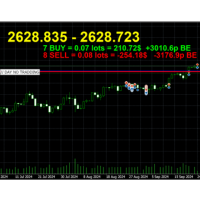
Breakeven Line v2 Indicator is a MetaTrader indicator that calculates breakeven level based on all open positions and displays it on your chart as a horizontal line. Additionally, it will calculate the total number trades, the total number of lots, and the distance to the breakeven line in points and profit/loss. The indicator is available for both MT5. Why use Breakeven Line Indicator? When you have multiple trades opened on a single symbol, it can be difficult to tell where your average ent

Cet indicateur LogReturnsIndicator.mq5 calcule et affiche les rendements logarithmiques (« log returns ») des prix de clôture d'un actif financier.
Il calcule les rendements logarithmiques pour chaque période en utilisant la formule :
rendement logarithmique = ln(close[i] / close[i−1])
Cela mesure la variation relative entre les prix de clôture consécutifs en termes logarithmiques, une méthode souvent utilisée en finance pour analyser les rendements des actifs financiers.
Avantages

Cet indicateur MQL5, nommé "Change Of State-(Poisson Law).mq5", est conçu pour identifier des points de changement significatifs dans les mouvements de prix en utilisant un modèle basé sur la distribution de Poisson. Voici un résumé de son fonctionnement : Objectif de l'indicateur L'indicateur vise à marquer les points de changement significatifs sur le graphique des prix en utilisant des flèches pour indiquer lorsque la variation des prix dépasse un seuil défini par la distribution de Poisson.

Cet algorithme est un indicateur personnalisé pour MetaTrader 5 (MT5), qui trace deux moyennes mobiles simples (SMA) sur un graphique financier, afin d'aider à l'analyse technique des mouvements de prix. Voici les principaux points sur ce que fait cet algorithme : Deux Moyennes Mobiles Simples (SMA) : L'indicateur utilise deux périodes de SMA différentes : Une première période (SMA1) plus longue, définie par défaut à 8 périodes (SMA 8). Une deuxième période (SMA2) plus courte, définie par défaut

This is an indicator that combines the Rate of Change and Bollinger Bands, with several functions: Identifying trends. Detecting overbought and oversold conditions. Determining potential reversal points. Applicable Chart: M5 The indicator is composed of four lines: the Upper Band, Lower Band, Fast Line, and Slow Line. Usage 1: Identifying Trends When the yellow line is above the red line and the green and blue lines are expanding, it indicates an upward trend. Conversely, if the yellow line is b

Machine Learning Adaptive SuperTrend - Take Your Trading to the Next Level!
Introducing the Machine Learning Adaptive SuperTrend , an advanced trading indicator designed to adapt to market volatility dynamically using machine learning techniques. This indicator employs k-means clustering to categorize market volatility into high, medium, and low levels, enhancing the traditional SuperTrend strategy. Perfect for traders who want an edge in identifying trend shifts and market condit
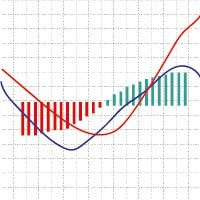
Wilder's MACD (Moving Average Convergence Divergence) is a variation of the traditional MACD indicator, incorporating Wilder's smoothing technique for more accurate trend signals. The indicator consists of three main components: MACD Line : This is the difference between two Exponential Moving Averages (EMAs) — a "Fast" EMA and a "Slow" EMA. The default periods are typically 12 for the Fast EMA and 26 for the Slow EMA. Signal Line : A smoothed version of the MACD Line using Wilder's Moving Avera
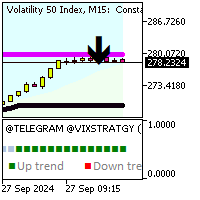
Ultimate Forex Trading Indicator Elevate your trading with our multi-functional indicator packed with advanced features! Key Features: 1. Non-repainting indicator for accurate signals 2. Max activations for peace of mind 3. 7+ strategies integrated for diverse trading styles 4. 10 Indicators all in one for comprehensive analysis 5. Perfect for Day and Swing Trading strategies 6. Trend following, reversal, and scalping strategies built-in 7. Create your own Custom strategies 8. Prop firm ready
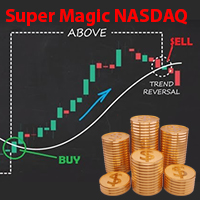
L'indicateur que vous avez actuellement à votre disposition est sans aucun doute l'un des meilleurs outils pour trader sur le marché NASDAQ 100 dans les cadres temporels de 1 minute et de 5 minutes. Cet indicateur fonctionne également sur d'autres cadres temporels, mais il a été spécifiquement conçu pour ces deux-là. Avec une précision élevée, cet indicateur ne nécessite aucun réglage initial. Il vous suffit de le lancer et de faire confiance à ses signaux. Précision et Efficacité Cet outil est
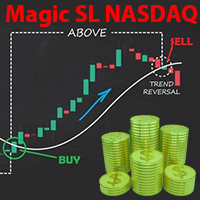
The indicator that is now available to you is undoubtedly one of the best tools for trading in the NASDAQ 100 market , especially in the 1-minute and 5-minute timeframes. It is meticulously designed for precision and can be adjusted for other timeframes as well. Simply run it and trust its powerful signals . Key Features: Specialized performance in the 1-minute and 5-minute timeframes : While this indicator works in other timeframes too, its primary focus is on these two timeframes. Compatibilit

L'indicateur Gann Box est un outil puissant et polyvalent conçu pour aider les traders à identifier et exploiter les niveaux clés du marché. Cet indicateur permet de dessiner un rectangle sur le graphique, qui est automatiquement divisé en plusieurs zones avec des niveaux stratégiques 0, 0.25, 0.50, 075, 1 . Lorsque le prix touche un de ces niveaux, des alertes se déclenchent, offrant ainsi une aide précieuse pour les décisions de trading. Vous savez instantanément l'évolution du marché par ra
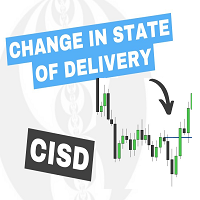
The Change In State Of Delivery (CISD) indicator detects and displays Change in State Of Delivery, a concept related to market structures.
Users can choose between two different CISD detection methods. Various filtering options are also included to filter out less significant CISDs.
USAGE Figure 2 A Change in State of Delivery (CISD) is a concept closely related to market structures, where price breaks a level of interest, confirming trends and their continuations from the resul
MT4 Version: https://www.mql5.com/en/market/product/124141 A Day in the Life of a Trader: Discovering the Forex Matrix Dashboard In the fast-paced world of forex trading, keeping track of multiple currency pairs can feel overwhelming. That’s where the Forex Matrix Dashboard comes in, making the life of a trader much easier. Imagine opening the dashboard and instantly seeing all your favorite currency pairs, like EUR/USD, GBP/USD, and USD/JPY, displayed clearly with their latest prices. No more
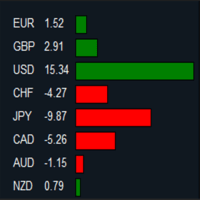
MT4 Version: https://www.mql5.com/en/market/product/124140 Imagine you’re at the helm of your trading terminal, scanning charts of various currency pairs, trying to figure out which ones are strong, which ones are weak, and where the real opportunities lie. It’s a lot to process—flipping between charts, calculating movements, and comparing performance. But what if all of that could be done for you, neatly displayed in one place? That’s where this Forex Strength Dashboard comes in. Picture thi

Дельта: танец цен на биржевом паркете Дельта - это не просто цифра, а отражение динамики рыночных сил, танцующих на биржевом паркете. Она показывает разницу между текущей ценой акции и ее начальной стоимостью. Подъем: Дельта в плюсе - это сигнал оптимизма. Цена акции растет, как пышный цветок, раскрывающийся под лучами солнца благоприятных новостей. Инвесторы видят перспективы и готовы платить больше за владение этой ценной бумагой. Падение: Дельта в минусе - это знак неуверенности. Цена акц

MT4 Version : https://www.mql5.com/en/market/product/124152 You’re sitting in your trading room, sipping coffee as the markets start their day. The screen in front of you is alive with numbers, price movements, and endless charts. Each one demands your attention. But you don’t have time to dive into every single detail. You need a quick, reliable way to read the market’s mood. That’s when you glance at your Sentiment Dashboard—a custom-built tool designed to simplify your trading decisions. Thi

You've probably noticed how unpredictable price movements can be. Sometimes the price moves in a certain direction with almost no corrections. Trend strategies work well during such periods. However, as soon as the directional movement is completed, the trading strategy ceases to be effective. Price movements become abrupt and "chaotic". The price abruptly changes its direction. Trend strategies start to give out a lot of false signals, and this leads to a large number of unprofitable trades.
This indicator is the mql version of the SuperTrend indicator. SuperTrend is one of the most common ATR based trailing stop indicators.
In this version you can change the ATR calculation method from the settings. Default method is RMA, when the alternative method is SMA. The indicator is easy to use and gives an accurate reading about an ongoing trend. It is constructed with two parameters, namely period and multiplier. The default values used while constructing a superindicator are 10 for

What is Heiken Ashi? Heiken Ashi is a charting method that can be used to predict future price movements. The indicator builds candlesticks similar to traditional ones. However, unlike a regular candlestick chart, the Heiken Ashi chart tries to filter out some of the market noise to better identify trend movements in the market.
How is Heiken Ashi calculated?
Heiken Ashi uses the COHL formula, which means "Close, Open, Maximum, Minimum". These are the four components that affect the s

Introducing the innovative AsiRocsOscillator — your reliable guide in the world of financial markets! Combining the power and accuracy of an oscillator with the speed of reaction for early signals, but confirmed by session close, AsiRocsOscillator offers unique opportunities for traders of any level.
AsiRocsOscillator key features: Multilevel market analysis: analyzes all price fluctuations, gaining access to a complete picture of the market. Accurate assessment of strength and direction: pr

Improve Your Trading with Buraq RSI Detector!
Buraq RSI Detector makes trading easier by spotting important RSI levels and marking them on your chart with clear bars. This helps you see exactly when to enter or exit trades. Key Features: Set Your Own RSI Levels: Choose the levels you want, and Buraq RSI Detector will mark them when the RSI touches those points. Clear Visual Signals: Bars appear on your chart as soon as the RSI hits your chosen levels, making it easy to find trading opportuniti
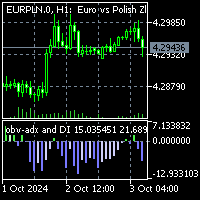
To get access to MT4 version please click here . This is the exact conversion from TradingView: "OBV ADX and DI" by " kocurekc ". This is a light-load processing and non-repaint indicator. All input options are available. Buffers are available for processing in EAs. You can message in private chat for further changes you need. I removed the background coloring option to best fit into MT platform graphics.

Want to create an Expert Advisor (EA) using an indicator that doesn’t store the required data in a buffer (visible in the Data Window) and only draws objects on the chart? This solution captures chart objects and places them into buffers, allowing you to create an EA—whether you're using EA Builder Pro or writing code with iCustom—by selecting the correct values using those buffers (modes). It works with any object visible in the Object List that has a unique Name or Description, such as: Trend

Indicator Description The indicator " TrendFusion " is designed for MetaTrader 5 and offers a comprehensive analysis by combining key technical indicators such as RSI, EMA, ATR, ADX, and MACD. It helps traders make informed decisions by visually representing these indicators and highlighting potential trading opportunities. This tool is especially useful for analyzing market dynamics across various assets, such as currency pairs or stocks. Functionality RSI (Relative Strength Index): Measures m

Support Resistance Indicator The "Support Resistance" indicator is a versatile tool designed to help traders identify key support and resistance levels based on an underlying algorithm. These levels indicate price points where an asset historically experiences buying (support) or selling (resistance) pressure. The indicator allows traders to visualize these levels on their charts, making it easier to make informed decisions. All Products | Contact PARAMETERS: Timeframe :
Users can select th
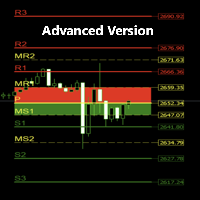
Detailed Description: The Pivot Points Buy Zone Advanced Indicator takes the concept of pivot points to a whole new level, providing traders with enhanced functionality, customizations, and in-depth visualizations. Unlike the free basic version, this advanced indicator allows users to customize more settings, analyze current and historical pivot points, enable potential buy (green) and sell (red) set-ups on the chart, use alerts and pop-up messages, ... etc. Extra Key Advanced Features: Fully C

L'indicateur Neuro Trend utilise une technologie moderne pour fournir des signaux précoces de retournements de tendance sur les marchés. Grâce à un codage couleur précis, l'indicateur affiche la direction actuelle de la tendance : le vert signale une hausse des prix (tendance haussière), tandis que le rouge indique une baisse des prix (tendance baissière). Plus l'indicateur s'éloigne du point zéro, plus la tendance est marquée. Des valeurs au-dessus de zéro indiquent une forte tendance haussière
This indicator is the mql version of the SSLHybrid indicator (By Mihkel00). Description of TradingView version: This script is designed for the NNFX Method, so it is recommended for Daily charts only.
Tried to implement a few VP NNFX Rules
This script has a SSL / Baseline (you can choose between the SSL or MA), a secondary SSL for continiuation trades and a third SSL for exit trades.
Alerts added for Baseline entries, SSL2 continuations, Exits.
Baseline has a Keltner Channel setting

About indicator > The indicator is a function based on one value (open/high prices up to now) and then it is a mathematical representation of the whole function that is totally independent from any else values. So, if you ask yourself will the future be as it is on the graph... I can tell you - as it was the same as the trading function up to the moment "now"... In conclusion, the point of the indicator is to try to show the future of the trading function into eternity.
The graphic is sometim

Le Support Résistance Whisperer MT5 est un outil puissant conçu pour aider les traders à identifier les niveaux de support et de résistance cruciaux sur le marché. Cet indicateur utilise l'action des prix pour dessiner de manière dynamique des lignes de résistance rouges et des lignes de support vertes sur votre graphique, offrant une représentation claire et visuelle des zones de prix clés où des inversions ou des ruptures potentielles du marché peuvent se produire. Contrairement au
Le Indicateur de zone FVG MT5 est un outil puissant conçu pour identifier les écarts de juste valeur (FVG) sur le marché, en mettant en évidence les déséquilibres de prix entre la juste valeur et le prix du marché. Cette identification précise des écarts permet aux traders de repérer les points d'entrée et de sortie potentiels du marché, améliorant considérablement leur capacité à prendre des décisions de trading éclairées. Grâce à son interface intuitive et conviviale, l'indicateur

Le 'Visualiseur de Niveaux OHLC Quotidiens' est un indicateur qui affiche les niveaux d'ouverture, de haut, de bas et de clôture de la veille ainsi que le prix d'ouverture d'aujourd'hui dans des couleurs et styles personnalisables. Il peut également afficher en option 2 lignes verticales à des heures personnalisables pour indiquer une session de trading. Principales caractéristiques du Visualiseur de Niveaux OHLC Quotidiens Affichage OHLC Montre les prix d'Ouverture, Haut, Bas et Clôture du jour
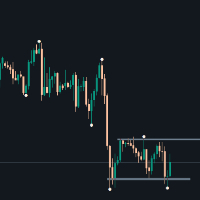
Enhance your chart analysis with the Dots indicator. This custom tool highlights key turning points in price action, allowing you to spot potential trend reversals and entry/exit opportunities at a glance. Features: Clear visual representation of market structure Customizable parameters for fine-tuning Efficient recalculation of recent price action Easy-to-use interface for traders of all levels

You can enter a sell when a red arrow appears and take profit according to your trading strategy or when a blue arrow appears. Buy when a blue arrow appears and take profit according to your strategy or when a red arrow appears. The stop for selling is always the last peak recorded by the price in the short term and the stop for buying is the last bottom recorded by the price in the short term. You should always manage your capital and not risk more than 10% of your capital.
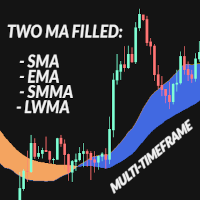
The Two MA Filled is a two moving averages indicator designed for traders seeking a more sophisticated and visual technical analysis. This indicator combines two customizable moving averages with a filling visual between them, allowing you to quickly visualize market trends and identify entry and exit opportunities. Key Features: Customizable Moving Averages: Set the periods and types of moving averages (SMA, EMA, SMMA, LWMA) for the fast and slow averages, tailoring the indicator to your tradin

This indicator is based on the strategy shared by TheMas7er on his youtube channel.
The IDR/DR range will help you identify the high and low of the day once a candle closes above or below the the DR levels.
The IDR/DR range is determined 1 hour after session open, 09:30 am est.
I have incorporated the fibonacci tool to help you mark the retracement for a good entry in the premium or discount zone.
Important
This indicator is designed for the indices and M5 timeframe,
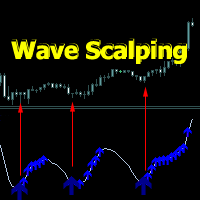
L'indicateur Wave Scalping est une stratégie de trading à court terme basée sur le système de vagues. Comprend une ligne de vagues, des points d'entrée et un suivi de position.
Des flèches de signal apparaissent lorsque la bougie se ferme.
Il se compose d'une ligne d'onde le long de laquelle les flèches de signal sont construites et d'une flèche qui confirme les directions après les flèches de signal.
Les flèches de signal sont construites en tenant compte de la direction de la tendance. Lo
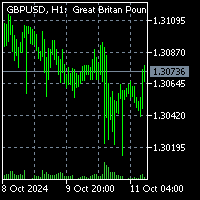
To get access to MT4 version please click here . This is the exact conversion from TradingView: "VolATR" by "barrettdenning" This is a light-load processing. This is a non-repaint indicator. All input options are available. Buffers are available for processing in EAs. You can message in private chat for further changes you need.
Thanks for downloading...

Indicateur de Plage de Prix Journalier L' Indicateur de Plage de Prix Journalier est un outil puissant conçu pour afficher les niveaux de prix clés de chaque jour de trading, aidant ainsi les traders à prendre des décisions éclairées en fonction de la dynamique du marché. Cet indicateur trace automatiquement des rectangles sur le graphique, mettant en évidence visuellement trois points de prix importants : Prix d'Ouverture Journalier : Marqué d'une couleur distincte pour identifier facilement où

Vice Daily Opening Indicator for MQL5 Overview:
Introducing the Vice Daily Opening Indicator for MQL5, a powerful tool designed for traders who want to enhance their daily trading strategies. This intuitive indicator provides clear visual cues on your trading chart by marking the opening price of each day with a prominent horizontal line. Key Features: Daily Opening Price Line: Automatically draws a horizontal line at the opening price of each day, giving traders a clear reference point for th

The Accumulation/Distribution (AD) Technical Indicator is a tool used in technical analysis to determine whether an asset is being accumulated (bought) or distributed (sold) in the market. Key Characteristics of the AD Indicator: Purpose: The AD indicator is used to assess the balance between buying (accumulation) and selling (distribution) of an asset. This helps traders and investors evaluate the strength of the current trend and potential reversals. Interpretation: Rising Indicator: Whe

The Accelerator Oscillator (AC) technical indicator measures the acceleration or deceleration of the current market strength. It is designed to identify potential trend reversal points and is used to determine the moment of buying or selling assets. The indicator helps traders make decisions based on changes in market dynamics. This implementation of the indicator is its creative version. Since the standard version is very limited by its built-in settings, this implementation has significantly

The AO (Accumulation/Distribution) technical indicator is a successful indicator for measuring market dynamics, which reflects specific changes in the market's driving force, which helps determine the strength of a trend, including its formation and reversal points. The AO indicator is a technical analysis tool that will help you trade more effectively. Main characteristics of the AO indicator: Purpose: The AO indicator is used to assess the balance between purchases (accumulation) and sales (di

Indicateur d'Entrée Sniper pour MT5 Déverrouillez le potentiel de l'analyse multi-temporelle avec notre innovant Indicateur d'Entrée Sniper pour MetaTrader 5 (MT5). Cet outil puissant est conçu pour aider les traders à identifier les points d'entrée optimaux en fonction des tendances prédominantes des périodes supérieures, garantissant ainsi une stratégie de trading bien informée. Caractéristiques Clés : Analyse Multi-Temps :
Analysez sans effort les tendances des périodes supérieures pour éta

Tyr Bands Indicator (IC MARKETS GOLD). Just drag and drop.
This indicators gets you entry points for the market. it is for gold, but you can configure for any other currency. Tyr Band works with BB and 3 different deviations, plus the Stochastic confirmation. So when the price closes below/above the BB Reversal Band (Red) and the Stochcastic is in the confirmation zone, then the arrow (buy/sell) appears. This arrow indicates that we can entry to the market up/down on the next opening. Since it
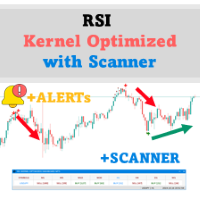
Seulement 10 copies disponibles à $49 – Réservez la vôtre avant que le prix n'augmente à $99 ! Nous vous présentons le RSI Kernel Optimized with Scanner pour MT5, un outil révolutionnaire qui redéfinit l'analyse RSI traditionnelle en intégrant l'algorithme puissant de l'estimation de densité par noyau (KDE). Cet indicateur avancé fournit non seulement des informations en temps réel sur les tendances du marché, mais il inclut également un tableau de bord pour scanner simultanément plusieurs pair

Automatic Fibonacci Levels Indicator The Automatic Fibonacci Levels Indicator is an essential tool for traders seeking to incorporate Fibonacci retracement and extension levels into their technical analysis seamlessly. This innovative indicator automatically identifies significant price movements and calculates key Fibonacci levels, providing traders with valuable insights into potential support and resistance areas. Key features: Automatic Calculation : Effortlessly plots Fibonacci levels base
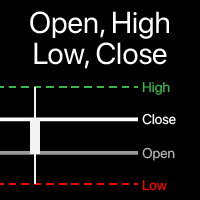
Visualization of Open, High, Low, Close levels on the chart You can choose any timeframe , not just the current one. The offset of the calculated bar can be adjusted : the current (floating) bar , or a set number of bars back . My #1 Utility : includes 65+ functions | Contact me if you have any questions | MT4 version In the settings of the indicator, you can configure: Offset of the calculated bar: 0 = current bar, 1 = previous bar, 2 = 2 bars back... "Include multiple bars " opti

Automatic Trendline Indicator The Automatic Trendline Indicator is a powerful tool designed to simplify technical analysis by automatically identifying and drawing trendlines on a price chart. It analyzes price movements to detect key support and resistance levels, plotting ascending and descending trendlines based on historical price action. This indicator helps traders identify market trends, potential breakout points, and reversal areas with minimal effort. Key features: Automatic Detection

Antabod Genius Indicator—an advanced trading tool designed to give you accurate buy and sell signals directly on your MetaTrader 5 platform. Harnessing the combined power of Moving Averages (MA) and the Stochastic Oscillator, this indicator helps you identify optimal entry and exit points with ease. Key Features: • Precision with Dual Moving Averages: The Genius Indicator uses a fast and slow MA to detect key market momentum shifts. Crossovers between the MAs serve as reliable indicators for pot

Special Fair Value Gap (SFVG) Indicator
Unlock your trading potential with the Special Fair Value Gap (SFVG) Indicator! This innovative tool identifies critical price imbalances in the market, helping you pinpoint potential buying and selling opportunities with precision.
Key Features: - Multi Timeframe - Smart Money Tool - Identifies Key Price Levels: Automatically detects STRONG HIGH PROBABILITY gaps in price action where retracements are likely to occur, allowing you to make informed t

# ConvolutionalAI Forex Predictor Pro
Élevez votre trading forex avec une intelligence artificielle de pointe. Le ConvolutionalAI Forex Predictor Pro exploite la puissance de l'apprentissage profond et des réseaux de neurones convolutifs pour fournir des prédictions précises et opportunes pour le marché des changes.
## Caractéristiques principales : - IA avancée : Utilise des modèles ONNX de pointe pour une analyse précise du marché - Prédictions en temps réel : Obtenez des prévisions à jou
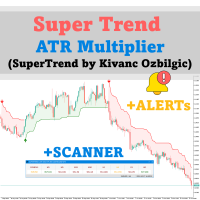
Seulement 10 copies disponibles à $49 – Obtenez la vôtre avant que le prix n'augmente à $99 ! Nous vous présentons le SuperTrend ATR Multiplier with Scanner for MT5 – un outil puissant et polyvalent conçu pour vous aider à anticiper les tendances du marché, avec des fonctionnalités personnalisables et des alertes en temps réel. Basé sur la logique éprouvée du SuperTrend de Kivanc Ozbilgic , cet indicateur offre des signaux de tendance précis. Vous pouvez ajuster la méthode de calcul de l' ATR e

Antabod Multiplier , the ultimate trading indicator designed to simplify your decision-making process and maximize your trading potential. Built with a robust combination of moving averages and stochastic oscillators, this tool provides clear, actionable signals for both buy and sell opportunities. The Antabod Multiplier stands out with its dynamic trend detection and precision filtering, giving you real-time visual signals to catch trend reversals and optimal entry/exit points with ease. Whethe
Le MetaTrader Market est un site simple et pratique où les développeurs peuvent vendre leurs applications de trading.
Nous vous aiderons à publier votre produit et vous expliquerons comment préparer la description de votre produit pour le marché. Toutes les applications de Market sont protégées par un cryptage et ne peuvent être exécutées que sur l'ordinateur de l'acheteur. La copie illégale est impossible.
Vous manquez des opportunités de trading :
- Applications de trading gratuites
- Plus de 8 000 signaux à copier
- Actualités économiques pour explorer les marchés financiers
Inscription
Se connecter
Si vous n'avez pas de compte, veuillez vous inscrire
Autorisez l'utilisation de cookies pour vous connecter au site Web MQL5.com.
Veuillez activer les paramètres nécessaires dans votre navigateur, sinon vous ne pourrez pas vous connecter.