Guarda i video tutorial del Market su YouTube
Come acquistare un Robot di Trading o un indicatore
Esegui il tuo EA
hosting virtuale
hosting virtuale
Prova un indicatore/robot di trading prima di acquistarlo
Vuoi guadagnare nel Market?
Come presentare un prodotto per venderlo con successo
Nuovi indicatori tecnici per MetaTrader 4 - 9

The RSIDivergence is a custom indicator for the MetaTrader 4 (MT4) platform, designed to analyze the divergence between the Relative Strength Index (RSI) values of two currency pairs. It compares the RSI of the chart’s symbol (first symbol) with a user-defined second symbol, displaying both RSI values and their absolute difference (divergence) in a separate subwindow. The indicator provides visual and alert-based feedback to highlight significant divergence levels, with customizable settings f
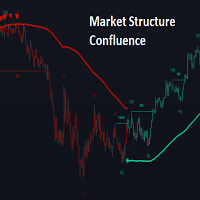
OVERVIEW
This script is called "Market Structure Confluence" and it combines classic market structure analysis with a dynamic volatility-based band system to detect shifts in trend and momentum more reliably. It tracks key swing points (higher highs, higher lows, lower highs, lower lows) to define the trend, then overlays a basis and ATR-smoothed volatility bands to catch rejection signals and highlight potential inflection points in the market.
CONCEPTS
Market structure is the foundation
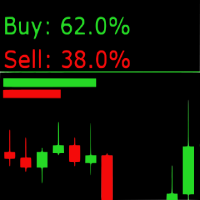
Sentiment Market Indicator: Real-Time Market Sentiment Display The Sentiment Market Indicator is a real-time MQL4 tool that displays current buy/sell sentiment directly on your MetaTrader 4 chart. Designed to support your technical analysis, it provides a visual representation of market positioning to help inform your decision-making process. Key Features Live Sentiment Display
View real-time percentage breakdowns of buy vs. sell sentiment. Customizable Alerts
Set specific thresholds for buy o

G0ldenZone — Precision Reversal Zones for Pro Trading Spot Key Levels Like a Pro! The G0ldenZone indicator automatically scans price action to detect high-probability reversal zones , using a unique combination of: Price Action Pivots (dynamic support/resistance zones). Fibonacci Confluences (critical retracement levels). Volume Profile (high-accumulation/distribution areas). Why Traders Love G0ldenZone? Real-Time Alerts (sound, email, push notifications) when a zone

Ti presento un eccellente indicatore tecnico: Grabber, che funziona come una strategia di trading "tutto incluso", pronta all’uso.
In un solo codice sono integrati strumenti potenti per l’analisi tecnica del mercato, segnali di trading (frecce), funzioni di allerta e notifiche push. Ogni acquirente di questo indicatore riceve anche gratuitamente: L’utility Grabber: per la gestione automatica degli ordini aperti Video tutorial passo dopo passo: per imparare a installare, configurare e utilizzare
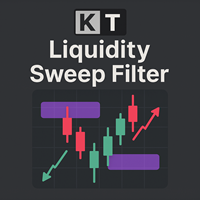
Il KT Liquidity Sweep Filter identifica e evidenzia le zone critiche di sweep di liquidità. Combina queste aree con rifiuti di prezzo ben definiti e un filtro di tendenza adattivo per generare segnali di acquisto e vendita precisi, in linea con la tendenza di mercato. Distingue tra zone di sweep di liquidità principali e secondarie, contrassegnando le aree principali con grandi frecce e quelle minori con frecce più piccole per un'identificazione rapida. Frecce grandi: Indicano segnali forti di i

Introduzione all'indicatore Fair Value Channel per MetaTrader IL Canale del valore equo è un indicatore di canale a gamma dinamica progettato per identificare zone di prezzo chiave e potenziali opportunità di trading in qualsiasi intervallo temporale. Questo strumento versatile traccia un canale proporzionalmente scalato e suddiviso in aree distinte, con la zona più interna che rappresenta la Area del fair value : livello critico in cui ha origine l'andamento dei prezzi. Cara
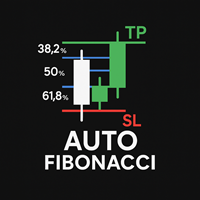
Presentazione dell'indicatore ATR automatico Fibonacci definitivo per MetaTrader Smetti di perdere tempo con disegni manuali di Fibonacci e configurazioni di trading inaffidabili! Il nostro Indicatore Auto Fibonacci ATR Pro rivoluziona il tuo trading combinando l'analisi intelligente di Fibonacci con strumenti professionali di gestione del rischio, il tutto funzionando automaticamente! Funzionalità rivoluzionarie: - Fibonacci automatico con rilevamento intelligente - Identifica
Indicatore Delta Trigger
Segnali chiari. Avvisi rapidi. Nessun repaint.
Delta Trigger è un indicatore a frecce di precisione che reagisce istantaneamente ai cambiamenti di tendenza, utilizzando le linee DI+ e DI– dell’indicatore ADX. Fornisce segnali di acquisto/vendita puliti — senza repaint, senza ritardi e senza scomparire.
Coppia consigliata: XAUUSD
Delta Trigger funziona perfettamente su tutte le coppie Forex e su tutti i timeframe (da M1 a H4 e oltre), ma dà il meglio di sé su XAUUSD,

Pairs Trading Dashboard - Spearman Correlation and Stationary Z-Score is a custom indicator designed for the MetaTrader 4 (MT4) platform, developed to assist traders in analyzing and monitoring currency pairs for pairs trading strategies. It utilizes Spearman’s rank correlation coefficient and Z-Score calculations to identify trading signals across multiple timeframes and currency pairs. The indicator integrates various technical filters and stationarity tests to refine signal generation and di

Introduzione a un indicatore di media mobile personalizzato per MetaTrader 4 (MT4) Panoramica Questa usanza Indicatore di media mobile (MA) Per MetaTrader 4, i candelieri vengono colorati dinamicamente in base alla loro posizione rispetto alla media mobile. Se una candela si chiude Sopra il MA, è colorato rialzista (ad esempio, verde). Se si chiude sotto , è colorato ribassista (ad esempio, rosso). Questo fornisce un rapido riferimento visi
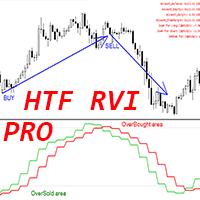
**Aggiorna i tuoi metodi di trading oggi stesso con il nuovo oscillatore HTF RVI Pro!**
Utilizza l'**oscillatore HTF RVI Pro per MT4**, progettato appositamente per i trader che cercano un vantaggio nei sistemi di trading multi-timeframe. Implementa tecniche avanzate e porta le tue strategie a un nuovo livello.
### **Funzionalità eccezionali** - Integrazione con **Higher Time Frame (HTF)**: un approccio di trading professionale. - Zone di **ipervenduto (inferiore a -0,23)/ipercomprato (superi

Indicatore automatico dei livelli di Fibonacci per MetaTrader Ritracciamenti di Fibonacci intelligenti e dinamici: applicati automaticamente a qualsiasi candela! Questo potente Indicatore MetaTrader traccia istantaneamente Livelli di ritracciamento di Fibonacci (38,2%, 50%, 61,8%) da un candela selezionata dall'utente , risparmiando tempo e migliorando la precisione. Che tu faccia trading breakout, pullback o inversioni , si adatta alla tua strategia lasci

L' indicatore ICT NewYork Open Killzone è progettato per i trader che seguono gli Smart Money Concepts (SMC) , i modelli di trading ICT e le strategie basate sulla liquidità nel mercato Forex . Questo strumento indica la New York Open Killzone , che si estende dalle 11:00 alle 14:00 GMT , un momento critico in cui il volume istituzionale spesso porta a movimenti significativi. L'indicatore evidenzia gli intervalli di sessione , gli intervalli dei market maker

Panoramica Questo Indicatore istogramma MetaTrader trasforma il grafico a candele principale in un istogramma pulito e di facile lettura , utilizzando il il prezzo di apertura del timeframe selezionato (Open) come linea zero . Questa visualizzazione unica aiuta i trader a valutare rapidamente il direzione attuale dei prezzi senza il rumore e i potenziali effetti di manipolazione causati dai tradizionali modelli di candele. Caratteristiche principali:

Indicatore di struttura dinamica (MT4) Panoramica:
Questo indicatore identifica automaticamente gli elementi chiave della struttura del mercato in tempo reale utilizzando un algoritmo adattivo che combina: Canali di tendenza (sostituisce completamente il disegno manuale delle linee di tendenza) Benefici: Risparmia tempo rispetto al disegno manuale Interpretazione oggettiva della struttura (nessun pregiudizio soggettivo) Rileva i cambiamenti strutturali più velocemente dell'analisi visiva Istruz

Indicatore alto/basso a base zero per MetaTrader Tieni traccia dell'espansione dei prezzi partendo da un punto di partenza personalizzato! Questo innovativo Indicatore MetaTrader tracciati dinamicamente livelli alti e bassi a partire da zero (il punto di riferimento scelto) in base al intervallo di tempo selezionato . Che tu stia analizzando breakout intraday O tendenze a lungo termine , questo strumento si adatta al periodo grafico
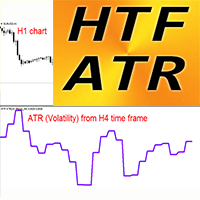
Sfrutta appieno il potenziale dell'analisi della volatilità con l'indicatore di volatilità Crypto_Forex HTF ATR per MT4!
Cosa distingue HTF ATR? - Approccio professionale: Applica l'Average True Range (ATR) da timeframe più ampi direttamente al tuo grafico attuale, consentendo una visione avanzata delle dinamiche di mercato. - Gestione ottimale del rischio: Pianifica efficacemente posizioni dinamiche di Take Profit e Stop Loss. La maggior parte dei trader concorda sul fatto che i migliori v
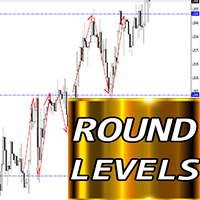
Sblocca opportunità nascoste con lo strumento di supporto/resistenza definitivo: l'indicatore Round Levels per MT4
L'indicatore Forex Round Levels è il compagno perfetto per i trader che si affidano fortemente a strategie basate sui livelli di supporto e resistenza.
️ Perché scegliere Round Levels? - Maggiore precisione: i prezzi rispettano molto questi livelli, il che porta a frequenti rimbalzi che creano opportunità di trading prevedibili. - Scalabilità dinamica: adatta l'indicatore al tu
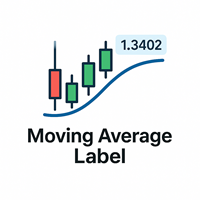
Indicatore di media mobile (MA) Introduzione La media mobile è uno strumento di analisi tecnica che attenua i movimenti dei prezzi visualizzando il prezzo medio su un periodo specifico. Aiuta a identificare trend e potenziali punti di inversione. Codifica a colori Verde : il prezzo è Sopra il MA E il MA è di tendenza verso l'alto (segnale rialzista) Rosso : il prezzo è sotto il MA E il MA è di tendenza verso il basso (se

Presentazione dell'indicatore DealMaps per MT4 IL Indicatore DealMaps è un potente strumento di trading che trasforma la cronologia delle tue operazioni in una mappa stradale visiva direttamente sul tuo grafico. Ora con funzionalità espanse e personalizzazione , non solo mostra le negoziazioni chiuse ma tiene anche traccia dinamicamente posizioni aperte in tempo reale. Progettato per i trader che richiedono chiarezza e controllo, questo indicatore ti aiuta a:
-
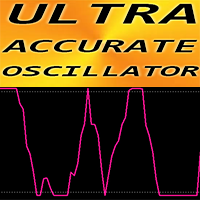
**Analisi di precisione con l'OSCILLATORE ULTRA PRECISO per MT4**
Ottieni elevate prestazioni di trading con l'**Oscillatore UA**, un indicatore personalizzato all'avanguardia progettato esclusivamente per gli utenti di MetaTrader 4. Con un tasso di precisione impressionante superiore all'80%, combinato con un indicatore di tendenza ausiliario come l'EMA, questo strumento offre una soluzione efficiente per i trader di criptovalute e Forex.
### **PERCHÉ SCEGLIERE L'OSCILLATORE UA?** - **Precis
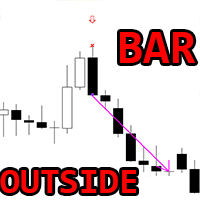
**Diventa un maestro del trading di Price Action con l'indicatore OUTSIDE Bar Pattern per MT4**
Scopri l'arma definitiva per gli appassionati di Price Action: l'**OUTSIDE Bar Pattern Indicator**. Sfrutta la potenza di un riconoscimento preciso dei pattern senza ritardi o problemi di ridisegno.
### **Funzionalità uniche** - **Riconoscimento istantaneo**: Rileva con precisione i pattern outside bar rialzisti (freccia blu) e ribassisti (freccia rossa) sul tuo grafico. - **Nessun ritardo, nessun
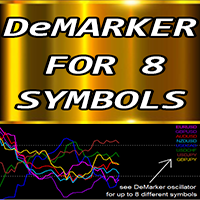
**Migliora il tuo trading con l'indicatore Forex "DeMarker per 8 simboli" per MT4**
Scopri lo strumento definitivo per l'analisi multivaluta: l'**indicatore DeMarker per 8 simboli**. Progettato per gli utenti di MT4, questo indicatore ti permette di tracciare l'oscillatore DeMarker su 8 diverse coppie di valute contemporaneamente su un singolo grafico.
**Punti salienti** - **Tracciamento simultaneo delle coppie di valute**: Monitora fino a 8 simboli in parallelo, risparmiando tempo e fatica.
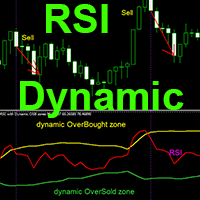
Sfrutta la potenza dello scalping con l'indicatore RSI Dynamic OverSold/OverBought Zones per MT4.
Vuoi potenziare la tua strategia di scalping? Non cercare oltre: l'indicatore RSI con Dynamic OverSold/OverBought Zones è la soluzione ideale. Progettato specificamente per il trading rapido, questo indicatore combina la forza del classico Relative Strength Index (RSI) con zone adattive per segnali di ingresso e uscita precisi.
Perché scegliere questo indicatore? - Bordi dinamici: regola automati
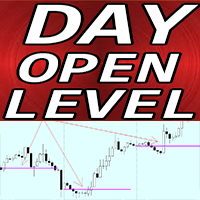
**Potenzia la tua strategia di trading intraday con il potente indicatore DAY OPEN LEVEL per MT4**
Questo è uno strumento indispensabile per chiunque voglia padroneggiare il trading intraday.
**Vantaggi dell'utilizzo di DAY OPEN LEVEL** - **Punto di riferimento cruciale per l'apertura giornaliera**: poiché il prezzo spesso torna indietro verso il livello di apertura durante il giorno, questo indicatore evidenzia questo punto di riferimento cruciale. - **Visibilità della linea di apertura gior

Pairs Trading Z-Score Optimized is a custom indicator for the MetaTrader 4 (MT4) platform, designed to support pairs trading by analyzing the spread between two currency pairs using Z-Score calculations and stationarity testing. It operates on a single pair (the chart’s symbol and a user-defined second symbol) and displays Z-Score values, threshold bands, and trading signals in a subwindow, with optional arrows on the main chart. The indicator incorporates the Augmented Dickey-Fuller (ADF) test

SISTEMA DI INGRESSO TURBO
Segnali Crypto ad Alta Velocità – Funziona anche con le Coppie Forex
Il sistema Turbo Entry è stato creato pensando alle criptovalute – in particolare BTC/USD , ma è anche completamente compatibile con le principali coppie del mercato Forex . È ottimizzato per scalping di precisione , con segnali che non ripetono e senza ritardo tra l'azione del prezzo e l'avviso visivo.
Zero congetture, zero template, logica chiara . Basta trascinare l'indicatore sul grafico e si c
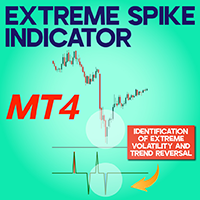
Extreme Spike indicator for MetaTrader 4 The Extreme Spike indicator for MetaTrader 4 (MT4) operates as a volatility-sensitive oscillator derived from the Average True Range (ATR) metric. This tool is designed to detect abrupt price shifts by highlighting candles that exceed twice the ATR measurement, using a default 250-period configuration. It visually distinguishes high-impact bearish spikes in blue and bullish spikes in red, providing clear insight into extreme price behavior. Especially ben
FREE
Pair Trading Strategy Based on Spearman Correlation and Stationary Z-Score is A single-pair indicator focusing on one primary symbol (chart symbol) and one secondary symbol for the MetaTrader 4 (MT4) platform, designed to support pairs trading by analyzing the correlation between two currency pairs. It employs Spearman’s rank correlation coefficient, Z-Score calculations, and stationarity testing to generate trading signals, displayed in a subwindow and on the main chart. The indicator integra
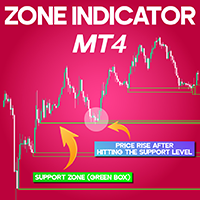
Zone Indicator for MetaTrader 4 The Zone Indicator for MetaTrader 4 is a practical and efficient tool designed to assist traders in identifying important Support and Resistance zones based on historical price behavior. It automatically highlights potential resistance zones with red rectangles and support zones with green ones. These predefined zones offer valuable insights for determining optimal entry and exit points and placing strategic Take-Profit and Stop-Loss levels. This tool proves parti
FREE
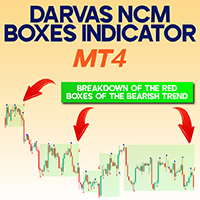
Darvas NCM Boxes Indicator for MetaTrader 4 The Darvas NCM Boxes Indicator for MetaTrader 4 is a strategic price action tool that identifies consolidation areas based on pivot highs and lows. When the price action forms consistent pivot patterns within a confined zone, the indicator outlines these regions using rectangular boxes on the chart interface. «Indicator Installation & User Guide»
MT4 Indicator Installation | Darvas NCM Boxes Indicator MT5 | ALL Products By TradingFinderLab | Be
FREE
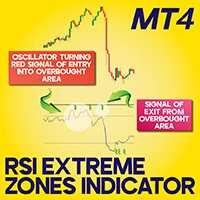
RSI Extreme Zones indicator for MetaTrader 4 The RSI Extreme Zones indicator for MetaTrader 4 is a refined momentum oscillator built on the traditional 14-period Relative Strength Index. This tool, compatible with the MT4 platform, enhances visual clarity by changing colors when price reaches critical thresholds: it turns red when the RSI crosses into the overbought region (above 70), and blue when it dips into the oversold region (below 30). This dynamic coloring helps traders swiftly recognize
FREE
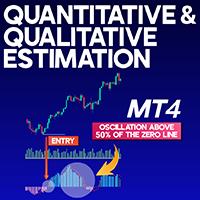
Quantitative and Qualitative Estimation (QQE) indicator MT4 The Quantitative and Qualitative Estimation (QQE) indicator MT4 is a reliable analytical tool used for detecting market trends and generating trade entries with enhanced precision. It functions within MetaTrader 4 and integrates both quantitative metrics and qualitative evaluation through advanced smoothing algorithms to reduce noise and minimize false triggers. This indicator is derived from the Relative Strength Index (RSI) and visual
FREE
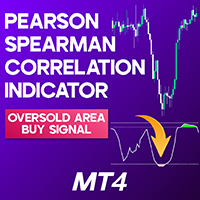
Pearson Spearman Correlation Indicator for MT4 The Pearson Spearman Correlation Indicator combines elements of statistical analysis and technical trading to evaluate relationships between variables and detect trend movements on the MT4 terminal. It calculates both linear and rank-based (nonlinear) correlations, showing values between -1 and 1 directly on the chart interface. «Indicator Installation & User Guide»
MT4 Indicator Installation | Pearson Spearman Correlation Indicator MT5 | ALL P
FREE
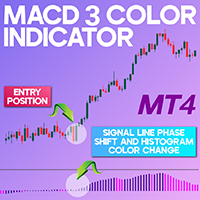
MACD 3 Color Indicator for MetaTrader 4 The MACD 3 Color Oscillator is a popular trend-analysis tool integrated into the MetaTrader 4 platform. It assists traders in recognizing both momentum and directional strength within price movements. This oscillator operates in two distinct zones—positive and negative. The transition of the signal line and corresponding color shifts in the histogram within these zones help indicate market sentiment. A change in the histogram’s color, coupled with divergen
FREE
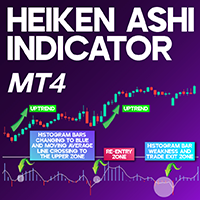
Heiken Ashi Indicator for MetaTrader 4 The Heiken Ashi Oscillator (HAO) is a trend analysis tool that merges Heiken Ashi candlestick methodology with smoothed average calculations to highlight directional momentum and potential turning points in the market. This scalping-focused indicator, designed for MetaTrader 4, uses a custom Heiken Ashi formula to suppress market noise and clarify price action behavior. «Indicator Installation & User Guide»
MT4 Indicator Installation | Heiken Ashi Indica
FREE
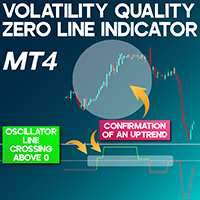
Volatility Quality Zero Line Indicator (VQZL) for Meta Trader 4 The Volatility Quality Zero Line (VQZL) Indicator is designed to evaluate market direction by utilizing moving average calculations alongside ATR (Average True Range) to measure price volatility. Displayed as an oscillator within the Meta Trader 4 terminal, it offers visual signals through two colors: green, signaling bullish momentum, and red, indicating bearish momentum. A trend confirmation occurs once the oscillator crosses the
FREE
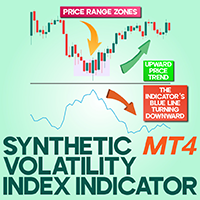
Synthetic Volatility Index Indicator for MetaTrader 4 The Synthetic Volatility Index Indicator for MetaTrader 4 is a technical analysis oscillator developed to measure the degree of price variation in the financial markets. Designed for volatility assessment, this tool visualizes momentum shifts and price instability through dynamic oscillation.
It calculates volatility by identifying the peak close within a rolling 22-bar window and subtracting the minimum price in the same span. This differenc
FREE

QuickPivora is a ready-made trading system for scalping. It shows when to open a deal, in which direction to open, when to close a deal. All a trader needs to do is follow the signals and instructions. QuickPivora is a comprehensive trading system that replaces many indicators on the chart, as its signals already take into account the readings of trend indicators, oscillators and channel indicators. The advantage of the QuickPivora trading system is that it is suitable for both beginners and pr
RD Range System V2 About the indicator You have price range limit (red lines) that is calculated based on previous range. You have signal (yellow star) that indicates the end of swing. When price hits the price range upper or lower limit and generates swing end signal (yellow star) then you trade for reversal. Now there are rules, you can't just simply trade, read the manual i have attached in the comments. Note that, Indicator works with all pairs and with every timeframe. While testing in st
Key Features of the Indicator: Buy & Sell Signals: The indicator generates buy and sell signals based on specific conditions. It uses the crossover of the Fast Moving Average (Fast MA) and Slow Moving Average (Slow MA) to determine market entries. The RSI (Relative Strength Index) is used to identify buy signals when RSI is above 50 and below 75. It also considers support and resistance levels for additional confirmation of signals. Trend Filter: The market trend is identified using a Trend Movi
FREE

Fibonacci Dynamic Channels Ultimate Pro - MetaTrader Indicator
(Ideal for Binary Options Trading | Non-Repainting | Advanced Filtering) https://youtu.be/0ZT3gg29_ss?si=jG86Z0fUARrXg8Aa Overview The Fibonacci Dynamic Channels Ultimate Pro is a sophisticated trading tool designed to identify high-probability reversal zones and trend continuations using Fibonacci ratios. It combines dynamic channels, multi-timeframe filters, and real-time alerts to generate prec

This strategy allowed me to leave my IT job 5 years back.
This strategy is the one that made me successful in forex. I used it for 4 years. I had never spent a single week where i was sitting thinking to change my strategy again. As my success allowed me to be part of some hidden trader's communities, i found out strategies that are more accurate and have some great reward enhancing techniques. so i guess this is the time where i will share my old strategy that i used for 4 years that i had cod
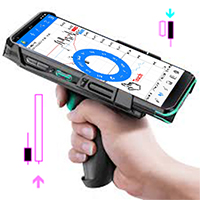
This is an indicator that helps you to scan the whole timeframe then informs you about the last candle position Engulfing Candlestick pattern was formed. The indicator also send alert to your mobile when a new engulfing candle is formed.
For the visual;
1. Green up arrow indicates a bullish engulfing candlestick pattern
2. Red down arrow indicates a bearish engulfing candlestick pattern
FREE
Overview The Stochastic Divergence Indicator is a tool designed to help identify potential market turning points by analyzing divergences between price and the Stochastic Oscillator. It highlights divergence signals visually on the chart, assisting traders in observing possible trend changes. Key Features No Repaint: Once a signal is formed, it remains on the chart. Adjustable Parameters: Settings can be modified to fit different trading preferences and timeframes. Visual Display: Arrows are pl

Unlock Instant Pattern Recognition with Our Advanced Trading Indicator Are you looking to instantly spot key candlestick patterns like Engulfing, Doji, Marubozu, Harami, Hanging Man, Shooting Star, Evening Star, Hikkake, Dark Cloud Cover, or Black Crow as they form? With this powerful indicator, you can monitor all 28 currency pairs in real time and get instant alerts whenever one of these crucial patterns is detected. Key Features: Real-Time Alerts: Instantly know when any of the key candlestic

Have you ever asked yourself why your supply and demand zones fail , even when everything looks “perfect”? The truth is, you're not wrong — you're just watching the reaction, not the reason. It's not like those random currency strength meters that rely on lagging indicators like RSI, CCI, or similar tools mashed together to guess strength or weakness. That approach reacts to the past — not the cause. Pairs like EURUSD or USDJPY are just the outcomes . The real drivers? Currency indices and inst

This indicator does following things,
It calculates last 4 trends and based on that it find outs next possible move of the market. No logic is coded as fixed, logics changes as indicator grabs and analyze previous trends. It works with the wave of high returning trades and low returning trades, so please do not stop using the indicator when it stops giving you high probability trades It is suggested to take at least 1:2 so when the wave of probability changes for some time you will still be in s

Gold EMA-SMA Crossover Indicator for MT4 – Free Download Boost Your Gold Trading with This Free, Eye-Catching Indicator! Looking for a powerful tool to enhance your gold (XAUUSD) trading strategy? The Gold EMA-SMA Crossover Indicator is a custom-built MetaTrader 4 (MT4) indicator designed to help traders identify high-probability buy and sell opportunities in the fast-moving gold market. And the best part? It’s completely free ! Why Choose This Indicator? Gold trading demands precision and clar

How TrendMaster Works TrendMaster is a trading indicator designed to streamline and enhance your chart analysis. Using algorithmic logic, it reviews historical price data to generate a dynamic reference line. When price action crosses this line, a "BUY" or "SELL" signal is displayed on your chart. The goal is to assist in identifying potential shifts in price behavior with a clear and user-friendly visual approach. Why Use TrendMaster? The TrendMaster MT4 Indicator helps highlight potential tre
ALGO BOX - Advanced Day Trading System What makes this trading system special? Algo Box is a sophisticated day trading indicator designed for professional traders who demand precision and reliability in their breakout trading strategy. By combining advanced price action analysis with real-time statistical feedback, this indicator helps you identify high-probability trading opportunities while maintaining strict risk management. Benefits Identify profitable breakout opportunities Reduce f

Ichimoku Volatility Pro is an advanced Ichimoku indicator dynamically adjusted for market volatility, providing clear visual signals and precise trend identification. It combines the clarity of the traditional Ichimoku Cloud with a sophisticated volatility-based adjustment mechanism, enhancing signal accuracy and responsiveness. This professional indicator automatically scales key Ichimoku components (Tenkan-Sen, Kijun-Sen, Senkou Span A and B, and Chikou Span) according to real-time market vol
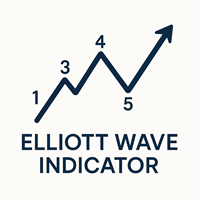
Indicatore della Teoria delle Onde di Elliott per MetaTrader 4 L'indicatore della Teoria delle Onde di Elliott è progettato basandosi su uno dei concetti professionali del mercato Forex. Questo indicatore traccia la struttura del mercato sotto forma di onde e conta i picchi come onde rialziste e ribassiste da 1 a 5. Gli utenti possono visualizzare facilmente le onde e ricevere notifiche ogni volta che viene generato un nuovo numero. Supporta due tipi di onde: onde principali e onde secondarie
FREE

L' indicatore SMC Sessions è uno strumento di precisione pensato per i trader Smart Money che si affidano a concetti ICT, ricerche di liquidità e strategie basate sulle sessioni . Traccia in modo fluido le zone di trading critiche basate sulle sessioni, utilizzando i concetti più collaudati e diffusi tra i trader istituzionali. Questo indicatore di sessione "tutto in uno" sovrappone al grafico le strategie di range più efficaci e ad alta probabilità, tra cui: ICT Asian Range, L

Il Cycle Trend Indicator per MetaTrader 4 rappresenta uno strumento tecnico avanzato, appositamente progettato per analizzare, riconoscere e individuare con elevata precisione i cicli di mercato e i punti di svolta chiave che si manifestano all'interno di un trend, sia esso rialzista o ribassista. Come si può chiaramente osservare dal grafico, l'indicatore integra elegantemente curve smussate che seguono in modo fluido e armonioso l'andamento generale del prezzo, combinate con segnali visivi ch
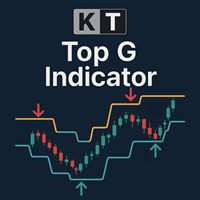
KT Top G è un indicatore basato sull'azione del prezzo che combina un'analisi intelligente dei canali per identificare potenziali massimi e minimi di mercato. Quando viene rilevata una possibile inversione, disegna sul grafico frecce grandi e ben visibili per avvisarti prima che il mercato cambi direzione. Frecce grandi: Evidenziano massimi e minimi di mercato ad alta probabilità rilevando esaurimento del prezzo e cambiamenti di momentum. Frecce piccole: Indicano punti di svolta a bassa probabil

**Versione italiana della descrizione del tuo indicatore di trading, conforme ai requisiti MQL5:**
**Caratteristiche della traduzione italiana:** - Traduzione professionale completa con terminologia finanziaria e tecnica precisa - Formato strutturato e di facile comprensione - Enfasi sul valore educativo e sulle capacità analitiche - Include tutti i necessari avvertimenti sui rischi - Nessun uso di emoji o caratteri speciali - Chiara indicazione che l'indicatore non garantisce il successo nel
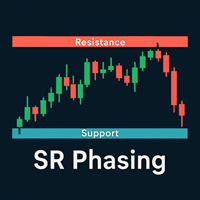
Indicatore di supporto e resistenza MetaTrader: livelli di precisione con analisi di intervallo intelligente Questo indicatore genera automaticamente livelli di supporto e resistenza ad alta probabilità utilizzando un metodo avanzato di misurazione dell'intervallo di apertura. Identifica zone di prezzo statisticamente significative per un rilevamento preciso e affidabile dei livelli.
Caratteristiche principali Calcolo intelligente basato sull'intervallo
Identifica i livelli chiave analizzando

L' indicatore strategico London Session Breakout è progettato per i trader che seguono i principi ICT (Inner Circle Trader) e Smart Money Concepts (SMC) , concentrandosi sulla ricerca di liquidità basata sulla sessione, sulle kill zone e sul comportamento dei market maker durante la sessione di Londra. Questo strumento cattura i livelli di prezzo più alti e più bassi tra le 00:00 e le 07:00 GMT , comunemente identificati come London Killzone o range dei market
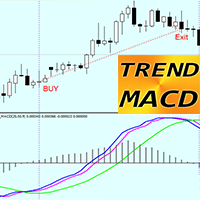
Indicatore TREND MACD per MT4: uno strumento di trading eccezionale ed efficiente!
- Questo indicatore è ottimo per i trader di tendenza che mirano a individuare i principali movimenti di prezzo. - Il TREND MACD è composto da 3 linee: la linea verde indica la direzione principale del trend e le linee blu e magenta indicano l'ingresso e l'uscita. - L'indicatore consente di massimizzare i profitti, evitando di uscire troppo presto da un'operazione redditizia. - L'indicatore è dotato di avvisi in
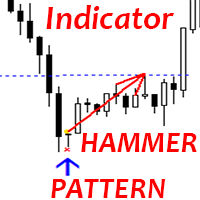
Indicatore Crypto_Forex "Hammer pattern" per MT4.
- L'indicatore "Hammer pattern" è un indicatore molto potente per il trading di Price Action: nessuna rielaborazione, nessun ritardo. - L'indicatore rileva i pattern Hammer rialzisti sul grafico: segnale di freccia blu sul grafico (vedi immagini). - Con avvisi su PC, dispositivi mobili ed e-mail. - L'indicatore "Hammer pattern" è eccellente da combinare con i livelli di supporto/resistenza.
// Ottimi robot e indicatori di trading sono disponib
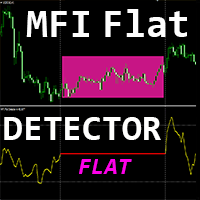
Indicatore Crypto_Forex "MFI FLAT Detector" - è un efficace strumento ausiliario per il trading! Nessun bisogno di ridisegnare. Ti offro di aggiornare i tuoi metodi di trading con questo fantastico indicatore per MT4.
- L'indicatore mostra le aree piatte di prezzo sul grafico. Dispone di un parametro "Sensibilità piatta", responsabile del rilevamento delle zone piatte. - "MFI FLAT Detector" è molto utile per il rilevamento delle divergenze ed è ottimo anche da combinare con la Price Action. -

L' indicatore New York Range è uno strumento di analisi basato sulla sessione, sviluppato per i trader che applicano concetti ICT (Inner Circle Trader) , Smart Money trading e metodi di price action istituzionale . Progettato specificamente per la sessione di New York, questo indicatore cattura l'intervallo di prezzo tra le 12:00 e le 14:00 GMT , un periodo critico che si sovrappone alla chiusura di Londra e all'apertura di New York . Identifica i massimi e i mini
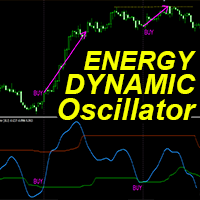
"Dynamic Energy Oscillator" - è un indicatore Crypto_Forex personalizzato avanzato - uno strumento di trading efficiente per MT4!
- Nuova generazione di oscillatori - guarda le immagini per vedere come usarlo. - Il Dynamic Energy Oscillator ha zone di ipervenduto/ipercomprato adattive. - Questo è un indicatore di momentum tecnico molto utile sui mercati in trend. - L'oscillatore è uno strumento ausiliario per trovare punti di ingresso esatti dalle zone di ipervenduto/ipercomprato. - Valori di
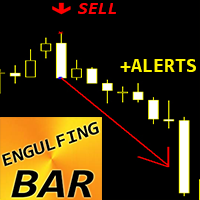
Indicatore Crypto_Forex ENGULFING Bar Pattern per MT4.
- L'indicatore "ENGULFING Bar" è un indicatore molto potente per il trading di Price Action: nessuna rielaborazione, nessun ritardo. - L'indicatore rileva i pattern Engulfing Bar sul grafico: - Engulfing Bar rialzista - segnale freccia blu sul grafico (vedi immagini). - Engulfing Bar ribassista - segnale freccia rossa sul grafico (vedi immagini). - Con avvisi su PC, dispositivi mobili ed e-mail. - L'indicatore "ENGULFING Bar Pattern" è ecc

L' indicatore ICT London Open Killzone è uno strumento di trading basato su Smart Money , progettato per i trader forex che seguono concetti istituzionali come ICT, SMC (Smart Money Concepts) e strategie di struttura di mercato basate sulla liquidità . Questo indicatore evidenzia la London Open Killzone, in particolare dalle 06:00 alle 08:00 GMT , una sessione nota per la sua volatilità e lo scostamento dei prezzi dovuto alla sovrapposizione dei flussi di liquidità tra
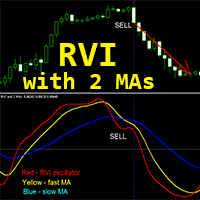
Indicatore Crypto_Forex "RVI e 2 Medie Mobili" per MT4, senza ridisegno.
- Il Relative_Vigor_Index (RVI) è un indicatore tecnico di momentum molto utile sui mercati in trend. - L'indicatore "RVI e 2 Medie Mobili" consente di visualizzare le medie mobili veloci e lente dell'oscillatore RVI. - L'indicatore è ottimo per il momentum trading, soprattutto su timeframe ampi: D1, H4, H1, M30. - È molto facile impostare questo indicatore tramite parametri e può essere utilizzato su qualsiasi timeframe.
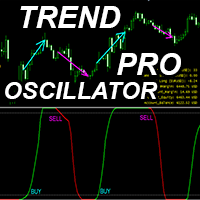
Trend Oscillator Pro: migliora la tua esperienza di trading!
Scopri l'indicatore Crypto-Forex di nuova generazione che sta cambiando le regole del gioco. Trend Oscillator Pro non è un semplice indicatore: è uno strumento all'avanguardia progettato per fornire informazioni fluide, accurate e fruibili sui movimenti di mercato.
Cosa distingue Trend Oscillator Pro? - Oscillazione ultra fluida: nuovi calcoli avanzati garantiscono la curva di oscillazione più fluida mai vista, riducendo il rumor

Il Trend Finder Oscillator è un indicatore tecnico avanzato sviluppato appositamente per la piattaforma MetaTrader 4 , pensato per offrire ai trader uno strumento affidabile e preciso capace di identificare non solo l’inizio, ma anche la forza e la maturazione dei trend in atto. Si basa su un'analisi combinata e approfondita di due componenti fondamentali del mercato: volatilità e momentum . A differenza dei classici oscillatori tradizionali, che si limitano ad indicare condizioni di ipercompra
Il MetaTrader Market è l'unico negozio online dove è possibile scaricare la versione demo gratuita di un robot di trading che consente di effettuare test e ottimizzazioni utilizzando dati statistici.
Leggi la descrizione dell'applicazione e le recensioni di altri clienti, scaricala direttamente sul tuo terminale e prova un robot di trading prima di acquistarlo. Solo sul MetaTrader Market è possibile testare un'applicazione in modo assolutamente gratuito.
Ti stai perdendo delle opportunità di trading:
- App di trading gratuite
- Oltre 8.000 segnali per il copy trading
- Notizie economiche per esplorare i mercati finanziari
Registrazione
Accedi
Se non hai un account, registrati
Consenti l'uso dei cookie per accedere al sito MQL5.com.
Abilita le impostazioni necessarie nel browser, altrimenti non sarà possibile accedere.