Indicadores técnicos para MetaTrader 4 - 139
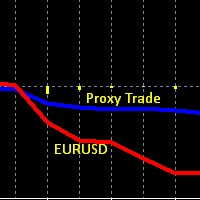
This is an obscure Hedge Fund like strategy, based one of our early indicators on EURUSD originally intended for day trading, while developing and testing the indicator we found out that the data used in this indicator (set of 4 currency pairs) follows EURUSD in a very peculiar way. On one hand these two are correlated, but the 4 currency proxy set tends to lag behind EURUSD, it lags on a day to day basis, and then catches up eventually after several days. And therefore can be used as a proxy
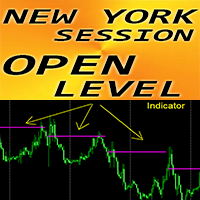
Indicador Forex "Nivel abierto de sesión de Nueva York" para MT4
El indicador "Nivel abierto de sesión de Nueva York" es un indicador auxiliar muy útil para el comercio intradiario El nivel de precio de apertura de la sesión es muy importante porque muy a menudo el precio regresa a esa zona durante el día. El indicador muestra el nivel de precio de apertura de la sesión de Nueva York diariamente para cada día También el indicador muestra el nivel de apertura semanal los lunes. Es útil para lo

* Pivot Points Magic : Effortlessly Plot Pivot Levels on Any Chart**
Pivot Points Magic simplifies the process of identifying critical pivot levels on any chart, across all timeframes. With just a few clicks, traders can instantly visualize pivot points, enabling them to make more informed trading decisions.
We value your feedback! Share your experience with Pivot Points Magic and help us improve. Your reviews and suggestions are essential for shaping future updates and enhancements to the
This indicator implements the following idea: if the current closing price (or the current average price) overcomes the smoothed value of the minimum/maximum prices for the selected period, this indicates a change in trend. The indicator effectively follows price movements in trending areas of the market and clearly demonstrates areas of sideways price movement. The product can be useful for both beginners and experienced traders as it is easy to use and intuitive. The indicator allows you to se

Why the RSI Alert Indicator is Essential for Your Trading Toolkit
In the fast-paced world of trading, timely and accurate information is crucial. The RSI Alert Indicator is a powerful tool designed to help you stay ahead of the market by providing real-time alerts when the Relative Strength Index (RSI) reaches critical levels. Whether you're a novice trader or a seasoned professional, this indicator can significantly enhance your trading strategy by pinpointing potential market reversals with

This is the higher timeframe pivot scanner. There are quite a few input options to choose from, to calculate the Daily, Weekly, or the Monthly Pivots, for any forex pairs / or your own pairs. You can use the Fibonacci way of calculating the pivots, or the Standard way of calculation. The input choice also has 5 different ways to choose from: - using the averages of High, Low and Close. - using the averages of High, Low, Close, and Close. - using the averages of High, Low, Open, and Close.

The KeyLevels Pro indicator is a powerful tool designed to identify significant support and resistance levels based on pivot highs and lows in the price action. This indicator is perfect for traders who rely on market structure and key price levels to make informed trading decisions. It features customizable parameters, automatic detection of pivot points, and visual representation of key levels with optional labels. Features Pivot Detection : Automatically detects pivot highs and lows based on

The “Sharp Scalper” indicator is high-frequency trading tool designed for quick, short term trades in the forex market. It focus on identifying rapid price movement and generating signals for best entry. This indicator is known for its ability to capture small profit opportunities multiple times throughout the day making it ideal for scalpers looking to capitalize on market volatility. The” sharp scalper” indicator employs advance algorithms to detect market trends and fluctuation, helping trade
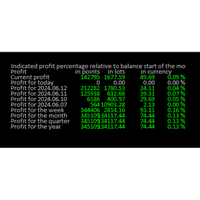
Online Diary: This indicator is designed to help traders keep track of profits and losses over various time periods, such as current profit, today’s profit, yesterday’s profit, and so on, up to the profit for the current year. The indicator offers several configuration options, such as the calculation of profit percentage relative to the balance at the beginning of the day, week, month, quarter, or year. It also allows for the customization of text placement and colors to suit the user’s needs

This is a Halftrend Scalper for MT4. Meant for Swinging markets with good volatility. Not suitable during low volatility. Features:
Wait for Price to cross Halftrend line. Select which HTF halftrend(Main Signal) Check Halftrend alignment between Higher Timeframes Check High Volume Bar (Optional) Halftrend Trends stacked (Optional) What's in the Downloads Package Extras:
- HT Scalper Scanner Dashboard (Keep in same directory as your Arrows indicator - or else won't work)
- Modified MTF Ha
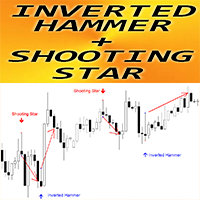
Indicador Forex "Patrón de martillo invertido y estrella fugaz" para MT4
El indicador "Patrón de martillo invertido y estrella fugaz" es un indicador muy potente para el comercio de acción del precio: sin repintado, sin demoras; El indicador detecta patrones alcistas de Martillo Invertido y Estrella Fugaz bajista en el gráfico: Martillo invertido alcista: señal de flecha azul en el gráfico (ver imágenes) Estrella fugaz bajista: señal de flecha roja en el gráfico (ver imágenes) Se incluyen ale

The 10PIPS Dynamite is a semi-automated cutting-edge Forex indicator designed to automatically revolutionize your trading skills from a being a losing trader to becoming a profitable trader simply by Scalping 10 pips per Trade setup generated by the software. 10PIPS Dynamite Indicator once attached on the main chart it starts an in-depth market analysis based on its unique in-built advanced algorithm which seamlessly combines powerful indicators, statistical analysis, and trend recognition

The SuperTrend MTF indicator is an excellent trend tracking indicator . It can not only display SuperTrend trends within the timeframe of the chart, but also set up to display SuperTrend trends for larger time frames simultaneously . This will be beneficial for grasping trends at a larger time scale and predicting future trends . At the same time, the price of the trend line can also be displayed at a glance, making it easy to observe. Input parameters : ATR period used at chart timeframe

The indicator is a double Rsi based oscillator with color change.
The coloring sometimes repaint one bar because of smoothing.
Check out my indicators and Expert Advisors - https://www.mql5.com/en/users/ptr777/seller
# Please note the demo doesn't perform correctly in the backtester.
The values and colors can be changed as preferred.
The fast line gives earlier signals but if you want confirmation wait for the cross or slow line to change color also.
Buy when lines is closer to
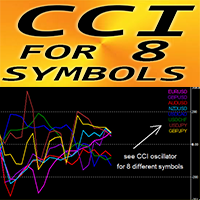
Indicador Forex "CCI para 8 símbolos" para MT4.
CCI es uno de los osciladores más populares para operar. El índice del canal de productos básicos (CCI) mide la diferencia entre el precio actual y el precio promedio histórico. Niveles importantes: +/-200; Es genial aceptar entradas de Venta desde la zona superior a +200 y entradas de Compra desde menos de -200. "CCI para 8 símbolos" brinda la oportunidad de controlar los valores de CCI de hasta 8 símbolos diferentes en 1 gráfico Este indicador

TMA Channel is a price channel obtained through a special calculation method based on traditional TMA . The channel has upper, middle, and lower tracks . When the price approaches or exceeds the upper track, it is already in an overbought state, and attention should be paid to the situation of reversal and decline; When the price approaches or falls below the lower track, it is already in an oversold state, and attention should be paid to the situation of reversal and rise . The indicator will d
el indicador PERFECTO
Este indicador es varias veces mejor que el indicador BRICS. Y eso es muy bueno.
En primer lugar porque da señales con más frecuencia. Se pueden operar varias veces al día utilizando varios pares de divisas.
En segundo lugar, las transacciones suelen ser más largas. El beneficio objetivo puede superar los 10 pips. Aunque recomiendo por seguridad que sean 10 pips. Pero se puede hacer dependiendo de la situación.
En tercer lugar, este indicador se aplica a todos los

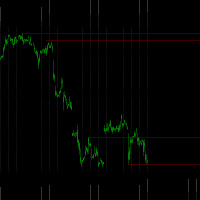

The author's indicator is based on automatically adjusted horizontal and inclined lines from significant market points. In the settings you can specify the period, color and thickness of the lines, disable or enable slanted lines and several other graphic settings.
Recommended rules for entering the market:
Using SELL as an example:
I place a pending order for a breakout - sell stop below the horizontal line of the indicator, then I monitor the work-out, stop loss and take profit are dete

This indicator has a lot of numerology analyzing methods that can support your analyzes or can work as custom strategy by it self ..we will start to explain them one by one : 1- Range channel that draws the limits of daily movements to detect places of buy and places of sell .
2- Angler will detect Dynamic numeral levels that result of time and price squaring with custom numeral method that works like support and resistant and will support your analyzes
3- Shepherd Levels it is l
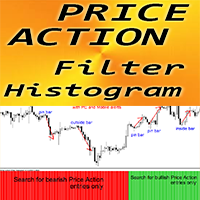
Histograma de filtro de acción de precio: es una herramienta comercial auxiliar eficiente para el comercio de acción de precio.
Este indicador sugiere al operador la dirección de las entradas. Entonces el operador sólo necesita buscar señales de acción del precio en esa dirección. El histograma del filtro de acción del precio debe combinarse con los patrones de acción del precio y los niveles de soporte/resistencia. Histograma de color verde: busque entradas alcistas Histograma de color rojo:
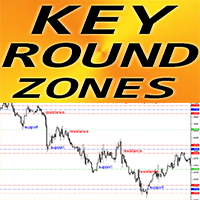
Indicador Forex "Zonas redondas clave" para MT4
El indicador "Zonas redondas clave" debe tener un indicador auxiliar para los operadores que toman en consideración el soporte/resistencia El precio respeta los niveles redondos de 1000 y 500: el precio se recupera muy a menudo. Los niveles principales 1000 también tienen fuertes zonas de soporte/resistencia (100 puntos en cada lado) a su alrededor. También los niveles de ronda 1000 y 500 son buenos para colocar Take Profits (frente al nivel de

The Onion Trend Indicator is a revolutionary trend trading and market data filtering solution that combines all the important features of a trend tool in one tool! It is great for any trader, be it Forex or binary options. No settings are required, everything is optimized by time and experience, it works effectively both in flat conditions and in trend conditions.
The Onion Trend Indicator is a technical analysis tool for financial markets that reflects current deviations in the price of

Histogramă PERFECTĂ Acest indicator este indicatorul săgeților PERFECT transformat într-un indicator histogramă. Faceți cumpărături la cercul albastru. Vindeți cercului roșu. Acest indicator este de câteva ori mai bun decât BRICS indicator. Și asta este foarte bine. În primul rând pentru că dă semnale mai des. Se poate tranzacționa de mai multe ori pe zi folosind mai multe valute Perechi. În al doilea rând, tranzacțiile sunt, în general, mai lungi. Profitul țintă poate depăși 10 sâmbur
The LewshaGen indicator is a technical analysis tool used in the Forex market. It helps traders make decisions when to enter or exit a trade based on analysis of market data. Let's look at how it works and why it can be useful.
How the LewshaGen indicator works: Trend Analysis: The indicator analyzes chart data and identifies key turning points and trends in the market. In the chart above, you can see how the indicator helps identify a decline of 180 points (PIP) and a subsequent rise of 330
Muon g-2
Bună ziua! Indicatorul Muon g-2 funcționează cel mai bine pe H1, M30 și H4 și pe toate perechile valutare.
Se poate tranzacționa de mai multe ori pe zi folosind mai multe perechi valutare.
Acest indicator pare să depășească indicatorul PERFECT.
Semnalele de cumpărare-vânzare sunt sub formă de săgeți.
Vă doresc succes!
IMPORTANT! Verificați mai întâi indicatorul sau expertul pe un cont DEMO, înainte de a-l cumpăra!
Analizați-l bine! Vorbeste cu vanzatorul! Închiriați-l pen

Indicador para negociación manual y análisis técnico de Forex.
Consiste en un indicador de tendencia con el nivel de apertura del día de negociación y un indicador de flecha para determinar los puntos de entrada.
El indicador no cambia de color; funciona cuando se cierra la vela.
Contiene varios tipos de alertas para flechas de señal.
Puede configurarse para funcionar en cualquier gráfico, instrumento comercial o período de tiempo.
La estrategia de trabajo se basa en la búsqueda de movi

The Dreadnought indicator carefully analyzes price dynamics, identifying temporary weakening of the trend and sharp changes in its direction. By monitoring this indicator, you can easily notice changes in the market and take appropriate action. Entering the market may be easy, but maintaining a position is much more difficult. With Dreadnought, you have reliable support to successfully stay ahead of the trend. This indicator analyzes historical data and provides the trader with the necessary in

Mysterium is a channel indicator without redraws, which is based on double smoothing of moving averages. Unlike channel indicators such as Bollinger, Mysterium uses double smoothed moving averages. This allows you to more accurately determine the direction of market movement, although it reduces the sensitivity of the indicator. However, double smoothing provides a clearer and more stable display of channels on the chart, which helps traders make informed trading decisions.
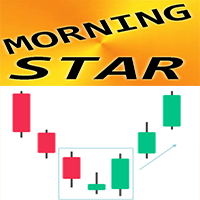
Indicador Forex "Patrón estrella de la mañana" para MT4
El indicador "Patrón Morning Star" es un indicador muy poderoso para el comercio de acción del precio: sin repintado, sin demoras; El indicador detecta patrones alcistas del Morning Star en el gráfico: señal de flecha azul en el gráfico (ver imágenes) Se incluyen alertas para PC, dispositivos móviles y correo electrónico También está disponible su hermano, el indicador bajista "Evening Star Pattern" (siga los enlaces a continuación) El i

Indicador Forex "Patrón de estrella vespertina" para MT4
El indicador "Patrón de estrella de la tarde" es un indicador muy poderoso para el comercio de acción del precio: sin repintado, sin demoras; El indicador detecta patrones bajistas de Evening Star en el gráfico: señal de flecha roja en el gráfico (ver imágenes) Se incluyen alertas para PC, dispositivos móviles y correo electrónico También está disponible su hermano, el indicador alcista "patrón Morning Star" (siga los enlaces a continua

Volatility Range is an indicator that calculates the range of volatility, predicting key levels such as potential resistance above and potential support below. The indicator can display volatility forecast ranges for the latest 50 days, 10 weeks, or 4 months. By observing these ranges, you can better identify reliable levels where combining with price action enhances trade accuracy significantly.
You have the option to fill the rectangle area with color for easier observation, or leave it unf

Price Action Scanner is an indicator that identifies price behaviors and provides alerts. This indicator can simultaneously detect signals for up to 6 different symbols across various timeframes. By setting a separator, you can add different symbol names and timeframes.
The indicator can detect multiple common signal types such as Pinbar, Engulfing Pattern, Inside Bar, Morning Star, Evening Star, Fakey, and display corresponding information in separate subcharts, indicating the direction of t

Price Action Scanner Pro is an indicator that identifies price behaviors and provides alerts, offering more features and customization compared to Price Action Scanner ( https://www.mql5.com/zh/market/product/118937?source=Site+Profile+Seller ) . This indicator can simultaneously detect signals for up to 15 symbols across different timeframes. You can configure it to detect signals during specific trading sessions such as Asian, European, and US sessions, using different timeframes. This

The Radiant Trend indicator calculates the saturation levels of the price chart. A signal to exit the oversold zone indicates a buy, and a signal to exit the overbought zone indicates a sell. For this indicator, it is usually necessary to set relative values for the overbought and oversold levels – Bottom and Top.
Often a good trend can be seen visually on the price chart. However, an experienced trader must clearly understand the current market situation before opening a position. The indi

The Candlestick Pattern Detector is an advanced MetaTrader 4 indicator designed to identify and highlight candlestick patterns on your charts. Currently, the indicator detects one specific candlestick pattern - the pinbar, known for its significance in technical analysis and trading strategies. This tool provides traders with visual cues, making it easier to spot potential market reversals or continuations. Features: Customizable Colors: Users can customize the colors of the bullish and bearish
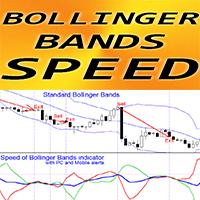
Velocidad de las bandas de Bollinger: es un indicador de tendencia único
El cálculo de este indicador se basa en ecuaciones de la física. La velocidad es la primera derivada de las bandas de Bollinger estándar. El indicador de velocidad de las Bandas de Bollinger muestra qué tan rápido la línea media de BB y los bordes de BB cambian de dirección Por defecto: la línea azul es la velocidad de la línea media BB, la línea roja es la velocidad del borde inferior, la verde es la velocidad del borde
Working with the Channel Motion Tracker indicator is as simple as possible. Just react to the arrows that the indicator displays. Each arrow represents an explicit command to action. The signals generated by this indicator are accurate enough to allow you to trade based on this information.
One of the main advantages of the indicator is its ability to build high-quality channels and generate signals for entering the market. This is great for the trader who always finds it difficult to choose

The Geliosx indicator is designed to visually display the trend. One of the key tasks when monitoring the currency market is to determine the trend - a stable direction of price movement. Geliosx uses special calculations to smooth out sharp fluctuations that do not have a significant impact on the overall picture of the price movement.
This indicator is created for those who value their time and money.
The trend can be ascending (bull trend) or descending (bear trend). Typically, the trend
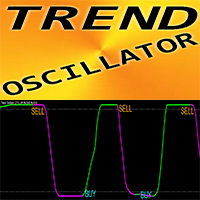
Trend Oscillator: es un indicador personalizado avanzado y una herramienta comercial eficiente.
Se utiliza un nuevo método de cálculo avanzado: 20 opciones para el parámetro "Precio para el cálculo" El oscilador más suave jamás desarrollado Color verde para tendencias al alza, color rojo para tendencias a la baja Valores de sobreventa: por debajo de 5; Valores de sobrecompra: más de 95 Hay muchas oportunidades para mejorar incluso las estrategias estándar con este indicador. con alertas de PC

Support and Resistance Levels is an intelligent indicator that displays horizontal support and resistance levels, suitable for traders of different trading frequencies. You can select your preferred trading frequency, and the indicator will automatically calculate the support and resistance levels relevant to that frequency. Among these, the Bull-Bear Line is an interval used to distinguish the strength of bullish and bearish forces, and is an important level.
You can combine it with other in
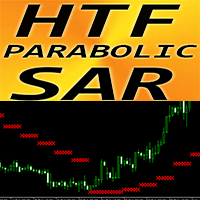
Indicador Forex Parabolic SAR Marco de tiempo más alto para MT4
Actualice sus métodos comerciales con un excelente indicador auxiliar HTF PSAR para MT4. HTF significa - Marco de tiempo más alto PSAR se utiliza para determinar la dirección de la tendencia y posibles reversiones en el movimiento de precios. Este indicador es excelente para usar con fines de Trailing Stop Si el PSAR se encuentra por encima del precio, es una tendencia a la baja. Si el PSAR se encuentra por debajo del precio, es

Product Description: Precision Pattern Indicator for Consistent Profits Elevate your trading with the Precision Pattern Indicator, an advanced tool designed to spot a highly profitable and specific trading pattern. This indicator is your key to unlocking consistent profits with minimal effort. Key Features: Accurate Entry Signals: Receive clear entry signals with green arrows for buy opportunities and red arrows for sell opportunities, ensuring you never miss a profitable trade. Defined Risk Man

The Arriator forex indicator algorithm allows you to quickly determine the current trend in the market. The Elephant indicator accompanies long-term trends and can be used without restrictions on instruments or timeframes. This indicator not only helps predict future values, but also generates buy and sell signals. It tracks market trends, ignoring wild swings and market noise around the average price. The indicator implements a type of technical analysis based on the idea of market cyclicalit
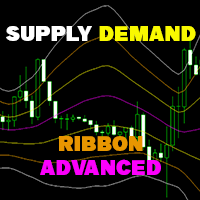
Supply Demand Ribbon is an indicator with moving supply and demand lines that help you identify price zones more easily.
The indicator helps you determine flexible entry, stop loss, and take profit areas.
There are also strategies for algorithmically changing ribbon colors.
From there you can come up with many trading strategies for yourself! You can try the Basic version here ! MT5 version: Click here! Feature in Advanced version: Hide/Show 2 Supply/Demand Over lines. Hide/Show 2

Indicatorul ANDROMEDA
Bun venit!
Indicatorul Andromeda este o creație nouă.
Acest indicator funcționează foarte bine pe H1.
Fiecare semnal asigură un profit cuantificat minim de 5, 10 sâmburi. Pentru profituri mai mari, se folosesc linii de rezistență, benzi TMA, Bollinger etc.
Singura problemă sunt știrile. Remediul pentru aceasta este Stop Loss.
Notă Este posibil ca acești indicatori pe care îi punem în vânzare să nu funcționeze pe anumite platforme. De câțiva ani, unele platfor

Lyre Histogram
Greetings!
The Lyre Histogram indicator is created for the M15 and M5 intervals.
Note Este posibil ca acești indicatori pe care îi punem în vânzare să nu funcționeze pe anumite platforme. De câțiva ani, unele platforme cu noi versiuni MT4 nu afișează toți indicatorii personalizați.
O soluție la această problemă este să descărcați acești indicatori pe o altă platformă de la un alt broker sau să reveniți la o versiune mai veche a MT4.
Am avut această problemă cu indicat

The Sirius X indicator reliably tracks market trends, ignoring wild swings and market noise. Suitable for trading on any timeframe, effectively filtering sudden price spikes and corrections by reducing market noise around the average price. For calculations, the indicator uses iLow, iHigh, iMA and iATR. The output based on these reliable indicators is also reliable. You can set up a sound signal and notifications, for example by email. The indicator does not redraw and works stably.
Configura
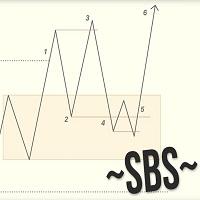
Swing Breakout Sequence | SBS presents a comprehensive trading strategy designed to help traders identify and capitalize on market swings and breakouts. The Swing Breakout Sequence (SBS) strategy is built around a series of well-defined steps to optimize trading decisions and improve profitability. Key Components of the SBS Strategy: Breakout Identification : The initial step involves identifying potential breakouts in the market. This is a crucial phase where traders look for key levels where t
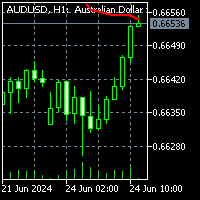
To download MT5 version please click here .
- This is the exact conversion from TradingView: "Chandelier Exit" By "everget". - This is a non-repaint and light processing load indicator - input options related to coloring and labels are removed to fit into MetaTrader graphics. - Buffers are available for processing within EAs. - You can message in private chat for further changes you need.
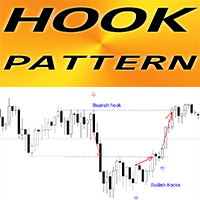
Indicador Forex "Patrón de gancho" para MT4
El indicador "Patrón de gancho" es un indicador muy poderoso para el comercio de acción del precio: sin repintado, sin demoras; El indicador detecta patrones Hook alcistas y bajistas en el gráfico: Gancho alcista: señal de flecha azul en el gráfico (ver imágenes) Gancho bajista: señal de flecha roja en el gráfico (ver imágenes) Se incluyen alertas para PC, dispositivos móviles y correo electrónico El indicador "Patrón de gancho" es bueno para combin

Gann Retracements Octaves Indicator Enhance your trading strategy with the Gann Retracements Octaves indicator, meticulously designed to integrate Gann's theories with modern technical analysis. This custom indicator provides you with precise retracement levels based on Gann's octaves, helping you identify key support and resistance levels, as well as potential reversal points in the market. Key Features: 24 Indicator Buffers : Tracks multiple retracement levels (-7/8 to 15/8) with distinct colo
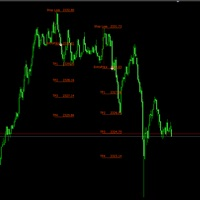
Best indicator for trend reversals Can be optimized for crypto trading or all currency pairs How to use:When the arrow appears, wait for the candle to close and open the order Level lines appear when candle closes, The system shows you the best entry levels It is simple and easy to use, no additional settings are required. Best indicator for beginners and professionals You can set the displayed stop loss and desired profit levels. You can use it alone or in addition to your strategy. Recommend
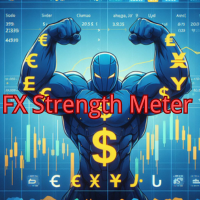
FX Strength Meter Pro es un poderoso indicador diseñado para traders que buscan oportunidades óptimas de trading en el mercado de divisas. Nuestro indicador muestra en tiempo real la fuerza relativa de los principales pares de divisas (USD, EUR, GBP, CHF, AUD, NZD, JPY, CAD), ayudándote a identificar rápidamente las monedas más fuertes y débiles para mejorar tu estrategia de trading.
Las características principales incluyen:
- Soporte multi-timeframe: Desde gráficos de minutos hasta mensual

Triarr is a trend indicator whose signals are displayed as arrows on the price chart. This indicator calculates instead of one, three specified periods on the current timeframe, and based on them, displays signals in the direction from the highest period to the lower one.
Triarr is suitable for any currency pair, any timeframe, and does not change its readings. 1H timeframe is recommended. The indicator is very easy to set up, which is a good advantage for research. Main Settings: HistoryBars

We mark the fair value gap (FVG) and wait for the price to reach that zone, but sometimes it reverses before getting there. This can happen because we didn't notice the Balanced Price Range (BPR). My tools will enhance your analysis by displaying everything on the chart, helping you identify potential price reversal areas so you can make informed decisions about when to enter the market. MT5 - https://www.mql5.com/en/market/product/119228/ So, what is BPR or Balanced Price Range? A Balanced Pr

Indicador Forex MA Aceleración para MT4, sin repintado.
MA Acceleration: es un indicador de especulación, diseñado como herramienta auxiliar para el indicador "MA Speed"
El cálculo de este indicador se basa en ecuaciones de la física. Le mostrará la aceleración de la línea de media móvil. Hay muchas oportunidades para actualizar incluso las estrategias estándar con MA Acceleration. Es posible utilizarlo para SMA, EMA y LWMA. La configuración del indicador es muy sencilla. El indicador de ac

¿Cansado de navegar en los mares de incertidumbre del mercado financiero? Imagina tener a un guía experimentado a tu lado, ayudándote a desentrañar los misterios de los gráficos y conduciéndote con seguridad hacia el éxito financiero . Con StakBank , tendrás en tus manos más que un simple indicador. Tendrás un arsenal completo de herramientas para tomar decisiones asertivas y rentables . Pero, ¿qué hace que StakBank sea tan especial? Volumen: Comprende la fuerza motriz detrás de los movimientos

Indicatorul Multivers
Bun venit!
Observați rezultatele foarte bune pe M15.
Dar funcționează bine și în celelalte intervale de timp. Trebuie doar să reglați TP, SL, Lot etc.
Noroc!
Notă Este posibil ca acești indicatori pe care îi punem în vânzare să nu funcționeze pe anumite platforme. De câțiva ani, unele platforme cu noi versiuni MT4 nu afișează toți indicatorii personalizați.
O soluție la această problemă este să descărcați acești indicatori pe o altă platformă de la un alt broke
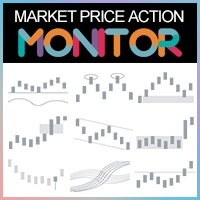
Why do I need to use the Market PA Monitor:
1.It is impossible to monitor multiple varieties and multiple TF of the market.
The market situation is constantly changing, with numerous varieties, and each variety has different timeframe from small to large. Each TF contains different market changes and trend alternations. Under numerous varieties and multiple TFs, there are countless trading opportunities every day. However, an ordinary trader cannot detect the trading opportunities of each v
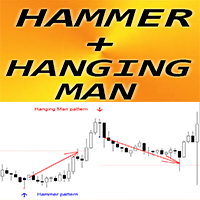
Indicador Forex "Patrones de martillo y hombre colgado" para MT4
El indicador "El martillo y el ahorcado" es un indicador muy potente para el comercio de acción del precio: sin repintado, sin retrasos; El indicador detecta patrones alcistas de Martillo y bajistas del Hombre Colgado en el gráfico: Martillo alcista: señal de flecha azul en el gráfico (ver imágenes) Hombre ahorcado bajista: señal de flecha roja en el gráfico (ver imágenes) con alertas para PC, móvil y correo electrónico El indic

The GT_SqueezeBreakOut signal indicator is a momentum based strategy using the bollinger bands and standard deviation indicators (which indicate periods of low volatility and eventual breakout) as well as the Fisher momentum/trend indicator to filter quality trade signals. It shows the squeeze (price consolidation) periods on chart and also signals on breakout of squeeze/price consolidation. You get instant alert/ push notification both on chart and on any other device used to receive alert sig
-90% OFF
Golden Range 2 is one of the top entry indicators securing its future with its results. Indicator settings: Points = how precise pattern detection is AlertConfirmation = turn on(true) off(false) alert CalculatedBars = how many bars will be calculated
Please leave Positive comments, reviews. Buffer 0 Buy Arrow, Buffer 1 Sell Arrow, Buffer2 Buy Signal(Value:1/0), Buffer3 Sell Signal(Value:1/0) Buy Green, Sell Red
If you have any questions please email: win2mywin@gmail.com

Powerful Order Block indicator in Tradingview platform. Indicator type: Price Action indicator Introduction: The Order Block Indicator - Elevating Your Price Action Analysis. If you're seeking a comprehensive Order Block indicator on the MQL5 platform, look no further.
Firstly, according to this indicator, an OB is understood as a zone of pending orders from large institutions that haven't been fully executed, revealing themselves in the market through subtle signs. Prices react strongly wh
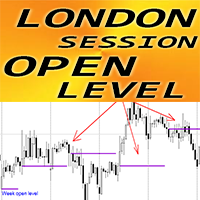
Indicador Forex "Nivel abierto de sesión de Londres" para MT4
El indicador "Nivel de apertura de sesión de Londres" es un indicador auxiliar muy útil para el comercio intradiario. El nivel de precio de apertura de la sesión es muy importante porque muy a menudo el precio regresa a esa zona durante el día. El indicador muestra el nivel de precio de apertura de la sesión de Londres diariamente para cada día También el indicador muestra el nivel de apertura semanal los lunes. Es útil para los op
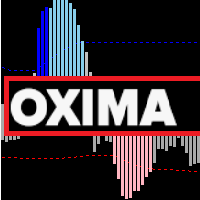
Oxima is an indicator designed to search for local extremes and determine the current trend. The author's methodology is used in the calculations of the indicator.
With the help of the indicator, you can determine the places of possible price reversals, preferably in the direction of the trend, but also with sufficient accuracy against it. You can also use the indicator to determine the current trend. The indicator is suitable for any currency pairs, but for an adequate display of the reading
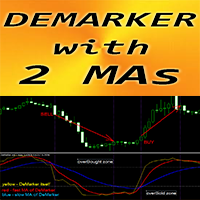
Indicador Forex "DeMarker y 2 medias móviles" para MT4
La curva del oscilador DeMarker indica la posición actual del precio en relación con los máximos y mínimos anteriores durante el período de cálculo del indicador. El indicador "DeMarker y 2 medias móviles" le permite ver las medias móviles rápidas y lentas del oscilador DeMarker Es fantástico aceptar entradas de Venta de la zona de Sobrecompra (por encima de 0,7) y entradas de Compra de la zona de SobreVenta (por debajo de 0,3). El indica
Compruebe lo fácil y sencillo que es comprar un robot en la MetaTrader AppStore, la tienda de aplicaciones para la plataforma MetaTrader.
El Sistema de pago MQL5.community permite efectuar pagos con ayuda de PayPal, tarjeta bancaria y los sistemas de pago más populares. Además, le recomendamos encarecidamente testar el robot comercial antes de la compra, para así hacerse una idea más completa sobre él.
Está perdiendo oportunidades comerciales:
- Aplicaciones de trading gratuitas
- 8 000+ señales para copiar
- Noticias económicas para analizar los mercados financieros
Registro
Entrada
Si no tiene cuenta de usuario, regístrese
Para iniciar sesión y usar el sitio web MQL5.com es necesario permitir el uso de Сookies.
Por favor, active este ajuste en su navegador, de lo contrario, no podrá iniciar sesión.