pro_:
(b) should not be lower than 5. So your option is questionable.
Well then it is only by looking at history, not on current data...
(b) should not be lower than 5. So your option is questionable.
In the absence of context (history), this mark-up is meaningless.
Speculator:
I don't get it - in the first picture the arrow was up!!!!
The arrow in the first picture is gone, and the last (outermost) picture is down???
It's the GP inverted classic. And you keep drawing numbers.
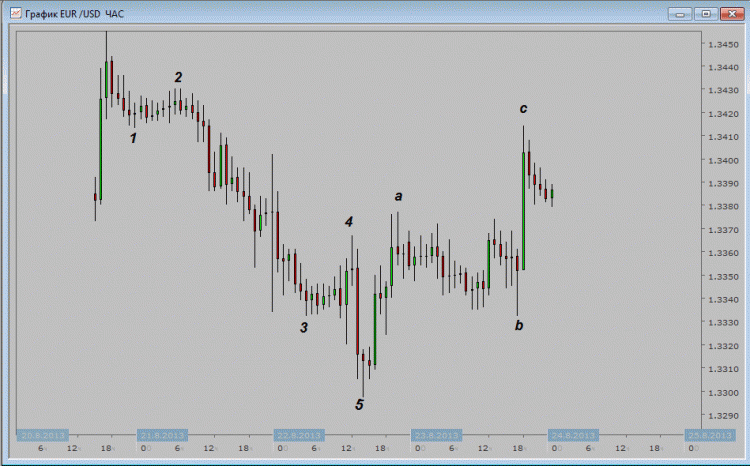
There really isn't much of a story, but there are some nuances that suggest that the last zigzag is indeed the ABC:
1. 5-A = 75 ; BC = 76. And they are known to be usually equal!
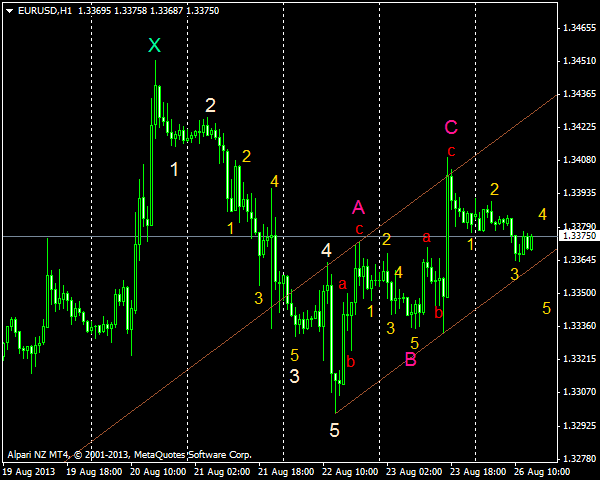
2. the minor waves are divided in the same order as the major waves, i.e. the corrective waves (both 5-A and BC) are divided by abc, and the impulse AB is divided by 1-2-3-4-5. The last movement also went in the same order (1-2-3-4-5).
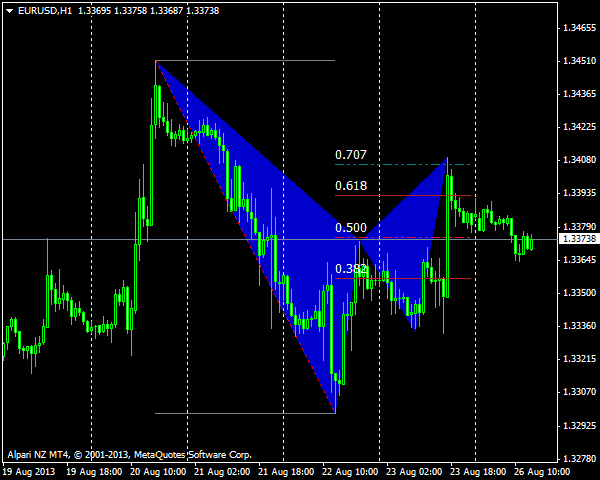
3. 5-A = 50% of X-5; 5-C = 70.7% of X-5.
4. X-5 = 45 bars; 5-C = 28 bars (45*.618 = 27.81 rounded 28 bars)
Well, no one can tell you what will happen next :)))). I myself try not to trade by waves, but to keep them in mind. So, whether to buy or to sell I cannot say.

p.s. I apologize in advance for the ugly colours. :)
I personally like this picture better. Points 3,4 from the previous post still apply.

But that's a long second wave, very, very long.
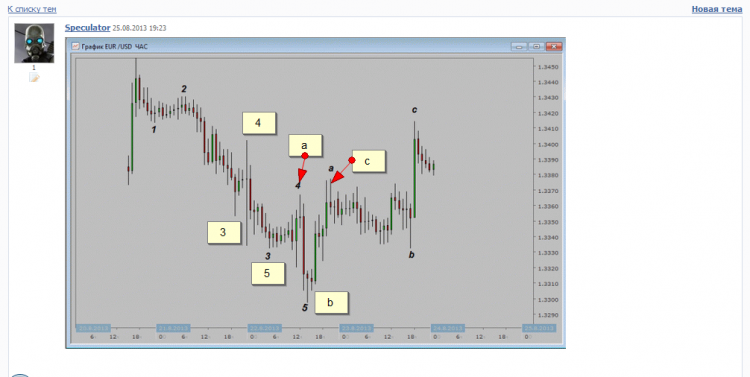
As for me, where you have a one, there is a fifth wave, then a correction, then from a to b there is a second five-wave, and then there are all corrections.
then explain to me how you got peak b below the first one ?
You are missing trading opportunities:
- Free trading apps
- Over 8,000 signals for copying
- Economic news for exploring financial markets
Registration
Log in
You agree to website policy and terms of use
If you do not have an account, please register
