Join the Dots.
Nice look and feel and very similar to what i trade with (well, guess most zigzags are !) and may I suggest you try a support/resistance overlay called "support and resistance" (make sure it has the "and" contained in the name.
only reason for stating this is to make it easier on the trader, who sounds like its you ---- with a support or resistance area in view, once youre moving on your zigzag trend, you can pretty well set and forget a tp point, and NOT have to wait for your next "dot" to exit.
try it !
enjoy and trade well
mp
Thanks for posting this Kamper. I've always enjoyed your posts and the logical simple approach you take. You also trade in my own style, which is to say a slower pace. I live on 4hr and daily charts.
I also use a bastardized version of bouncin' pips to trade. I can't put it on paper because it is 1/2 discretionary and 1/2 technical.
Ironically I think I use the same S&R indicator that MP just referenced 
Cheers
Thanks for posting this Kamper. I've always enjoyed your posts and the logical simple approach you take. You also trade in my own style, which is to say a slower pace. I live on 4hr and daily charts.
I also use a bastardized version of bouncin' pips to trade. I can't put it on paper because it is 1/2 discretionary and 1/2 technical.
Ironically I think I use the same S&R indicator that MP just referenced
Hey Lep.
Trust you are well and that the new year is treating you as well as it is treating me. :-)
H4 and D1 is where the money is. 
Most systems that fail or break even on lower time frames actually make money on the higher time frames, a lesson most newbies would be wise to take note of. Boring, but profitable.
Cheers
Wayne
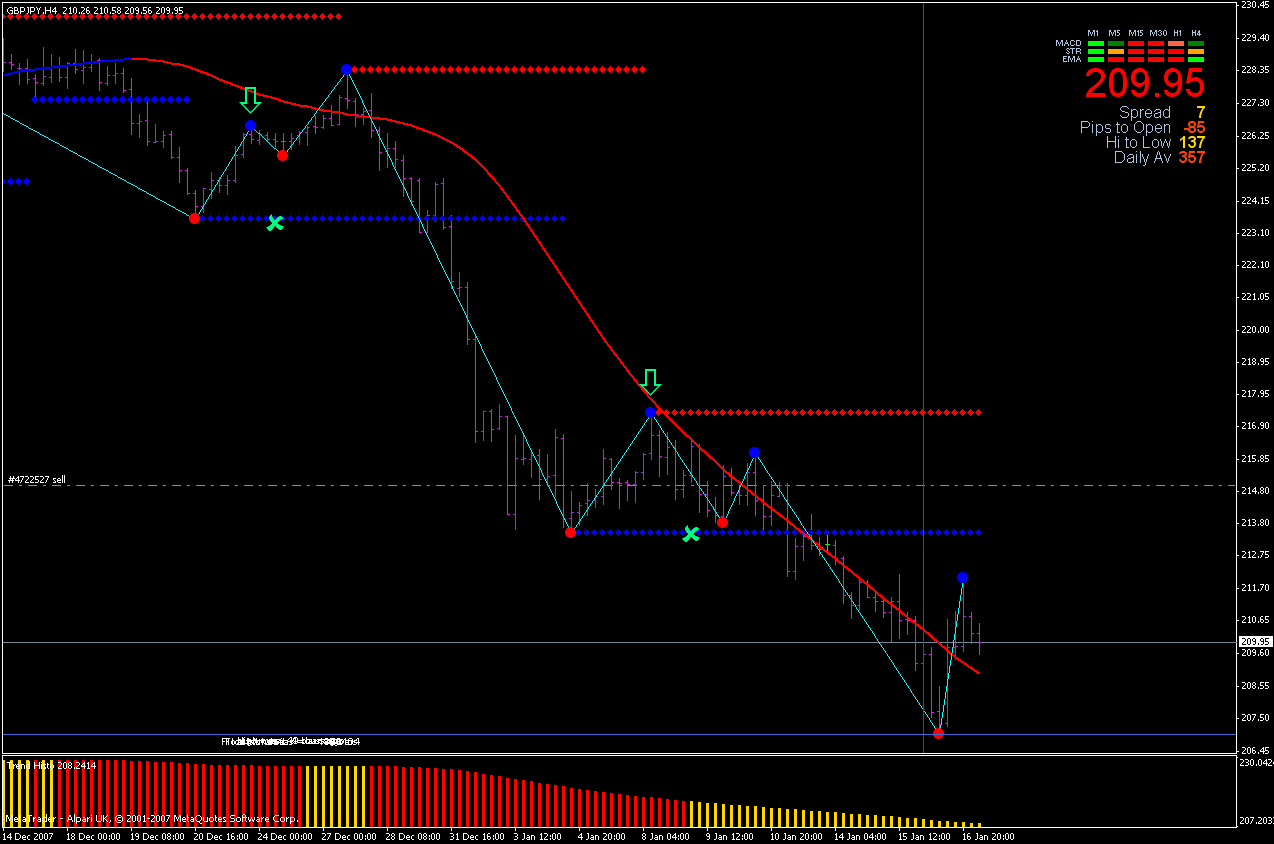
I think those are the same ones, or very similar. I'll post your set up with the S&R one I use. I marked entries with an arrow and possible targets with an "x"
Join the Dots.
Hi MP and Lep.
Thanks for the advice, just out of interest, I seem to have two in my indicators folder, one with underscores and one without, both by Barry Stander.
I have attached both, will you let me know which is the one you recommended or are they both identical? My code reading skills are non existant so I am unable to tell?
Thanks
Wayne
After a little advice, I have removed the indicators that were originally posted for two reasons.
1) Now everyone will have the same indicator.
2) Avoid any confusion as to which indicator is applied and used in future.
helo KamPer..... i try u sistem....but one indicator mega trand.... when i insert dosnt show anyting..can u help me...
thks...
Hey Lep
What exactly do the number of "dots" tell us that this indi draws at the peaks and troughs?
Thanks
Wayne
helo KamPer..... i try u sistem....but one indicator mega trand.... when i insert dosnt show anyting..can u help me... thks...
That is strange, can you have a look in your tabs, the Experts and the Journal tabs, and see if there are any errors listed?
I think those are the same ones, or very similar. I'll post your set up with the S&R one I use. I marked entries with an arrow and possible targets with an "x"
It is interesting to note how similar the initial exit is to the strategy I use of when the Trend Histo turns yellow?
Maybe waiting for both to change would bank a few more pips?
I like it, first impressions are good, thanks Lep, much appreciated.
Cheers
Wayne
How often does SwingZZ repaint the current bar? Or does this become a moot point? I know that this was a big deal in the bouncing pip thread.
- Free trading apps
- Over 8,000 signals for copying
- Economic news for exploring financial markets
You agree to website policy and terms of use
Hi Folks
Please understand that this system makes money as a manual trading system and I have no wish to pay a coder to code one of my systems and then still make money from it.
If that offends anyone, so be it, but at least it has been said right up front.
This originated after following the Bouncing Pip Thread, found here, and not liking the fact that ZigZag called the shots. So I reversed the logic and placed the trend determination first and only then trade the "Bouncing Pip".
I am not going to discuss the management or exit of the trades, anyone who does code will have a good idea as to what type of exit strategy suits this entry strategy once they understand it and manual coders will choose to exit based on what they see when they see it, much the same way that I do. I exit based mostly on Gut and Vision, this cannot be written into an EA but I am happy discuss options that may or may not be good idea's?
The basics are this;
H4 chart, any pair, although I mostly trade only the EUR pairs manually.
Long Trades
When Mega Trend and Trend Histo are both blue, trade any Red dot that appears as soon as the dot appears, do not wait for the end of the candle.
Short Trades
When Mega Trend and Trend Histo are both Red, trade any Blue dot that appears as soon as the dot appears, do not wait for the end of the candle.
SL is usually 21 or 34, but I vary this depending on my perception of trend strength.
Float is on the chart purely as a visual confirmation, it has a fairly decent ability to pick final Highs and Lows, which helps when I want to load a trade with a few more lots than normal.
This is the basis of the system, please don't fire questions at me about trade management and closing of trades, I do not have the answers, I close on what I see, all I can tell you is that I almost never close the entire trade, but if Trend Histo changes to Yellow, I usually close out half the position and allow the balance to trail with a fixed TS.
The value of the TS is normally anything from 34 to 144 and based purely my perception of the strength of the trend.
Thanks
Wayne
Picture added.
All Indicators used on the chart are posted in this post with the exception of "Magnified Market Price" which is just a visual aid and zigzag_pointerV2 which is purely there to show me any repainting that may occur from Swing_ZZ.