

In this video, we conduct a simple review of how we would trade the Heiken Ashi Smoothed MT4 indicator
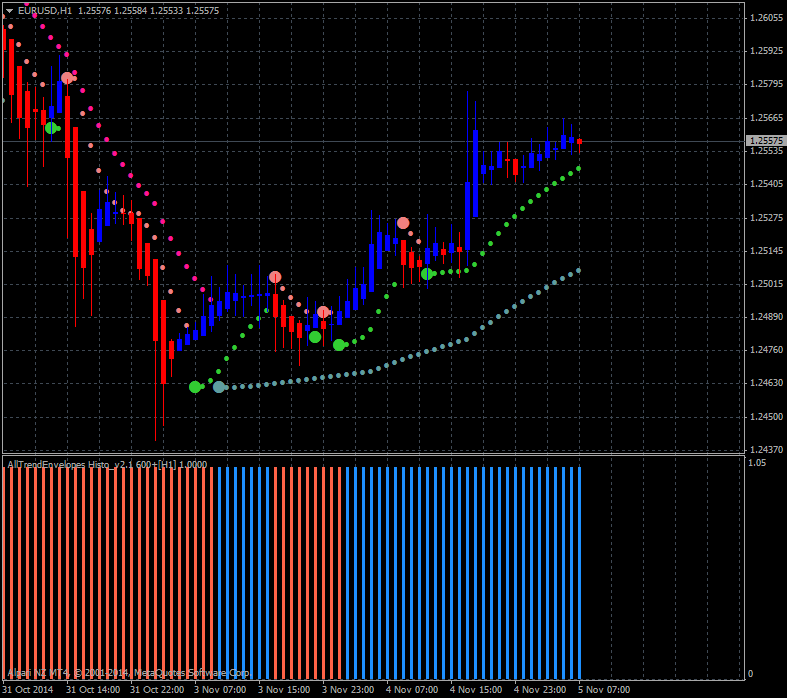
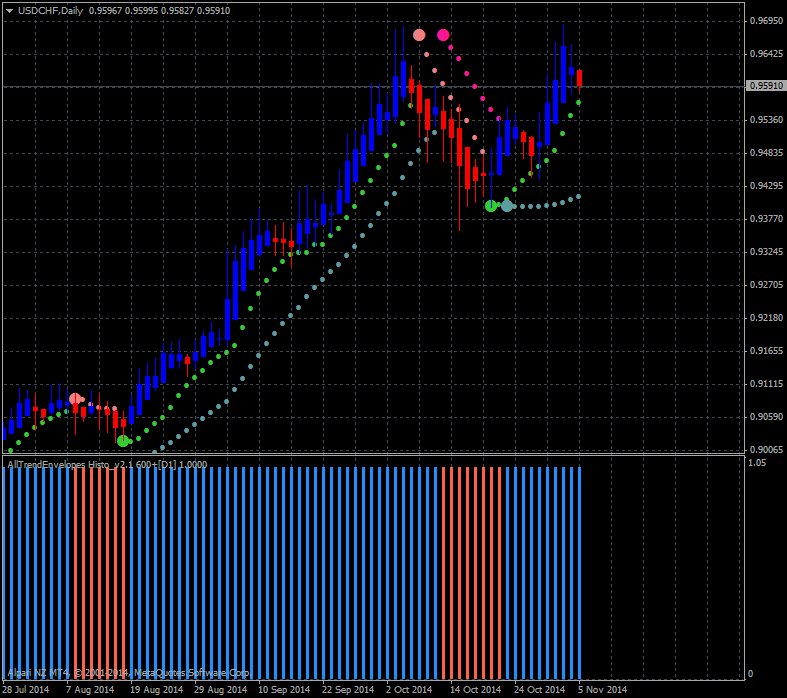
In the Video above, the silver moving line is the price. The blue and red indicators are the Heiken Ashi bars. Blue indicates bullish momentum, while red indicates bearish momentum.This indicator will probably work well in combination with another indicator. It reduces “fake-outs” and fake reversals while keeping you in trends with momentum indicated by the color of the bars.
Heikin Ashi is a type of trading chart that originated in Japan (heikin ashi translates as average bar). Heikin Ashi charts are similar to candlestick and bar charts in that they show similar information (the open, high, low, and close of the time frame), but Heikin Ashi charts calculate the information differently.
Heikin Ashi charts are used in trading in the same manner as standard candlestick or bar charts (i.e. chart patterns are used to indicate price movements). However, Heikin Ashi charts have an additional aspect in that the direction of the bar (i.e. its color for candlesticks) is supposed to indicate the overall direction of the market, while ignoring the intermediate direction (e.g. false changes of direction).
Heikin Ashi charts calculate their own open (HAO), high (HAH), low (HAL), and close (HAC), using the actual open (O), high (H), low (L), and close (C), of the time frame (e.g. the open, high, low, and close, of each five minutes).
Calculation:
HAO = (HAO-1 + HAC-1) / 2
HAC = (O + H + L + C) / 4
HAH = Highest(H, HAO, HAC)
HAL = Lowest(L, HAO, HAC)
All the charts here made by me (by newdigital) using free indicators (source codes) for MT4 and MT5:
- Heiken Ashi Smoothed - indicator for MetaTrader 5 (MT5 CodeBase)
- Heiken Ashi Smoothed - indicator for MetaTrader 4 (MT4 CodeBase)
- Heiken Parabolic Trading System is on this thread (external forum)


")