")
NEXUS EA Optimization Guide: Improve Trading Strategies with Lot Multipliers, Timeframes, and POC Filters (1/3)

Optimization of NEXUS EA: Basic Guide
Although this is not an exhaustive optimization guide like the one provided when purchasing NEXUS, it can serve as a starting point for understanding some fundamental principles in its use. Next, we will optimize some of the NEXUS EA parameters. We will take a linear approach, using the default configuration of the expert advisor as a reference. The tests will be conducted on the EUR/USD symbol, and a variable period will be set to obtain more precise results that adapt to different market conditions.
Market Entries
We will start the optimization with the market entry module. NEXUS has 9 entry strategies, and the selected level will determine the rigidity with which the EA will identify the first entry. Although this is not the most critical feature of the system, it can make a significant difference in the results. It is important to note that since NEXUS combines both trend and reversal conditions, using all the entries simultaneously may not be the most efficient option. Therefore, we will optimize the use of 1 to 9 strategies to evaluate the results.
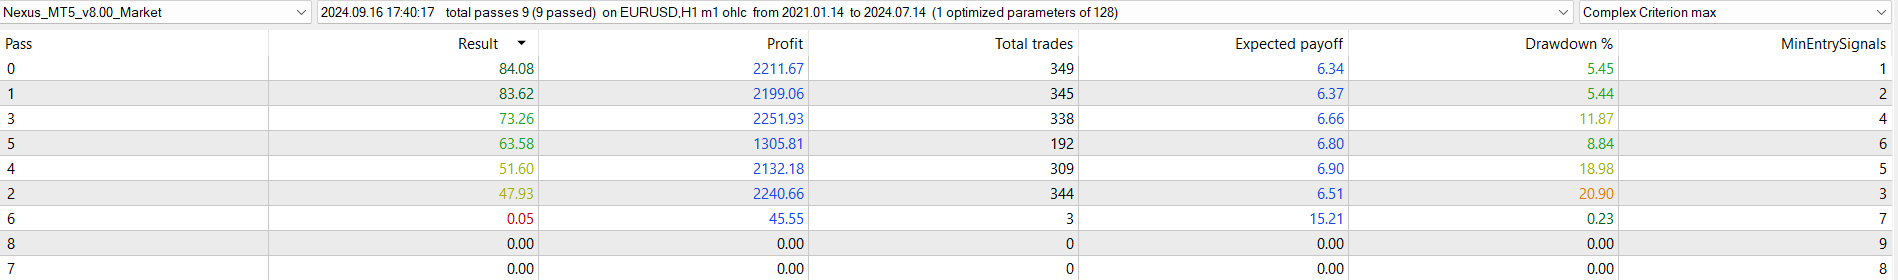
Conclusion: We have observed that selecting a reduced number of strategies can be more advantageous than using many at once. In fact, when certain strategies conflict, employing 8 to 9 may prevent trades from being executed. We continue testing with only one strategy at a time to open the first trade, thus maximizing system efficiency.
Internal Timeframes
Next, we will proceed to optimize NEXUS’s internal timeframes. The first timeframe defines the conditions for technical analysis, meaning those that determine market entries. The second timeframe, while also controlling internal processes like profit-taking, primarily regulates the minimum frequency with which the grid is monitored, i.e., the trades that compensate for losses. Since NEXUS only opens trades at the start of a bar, this condition is crucial for system performance and efficiency.
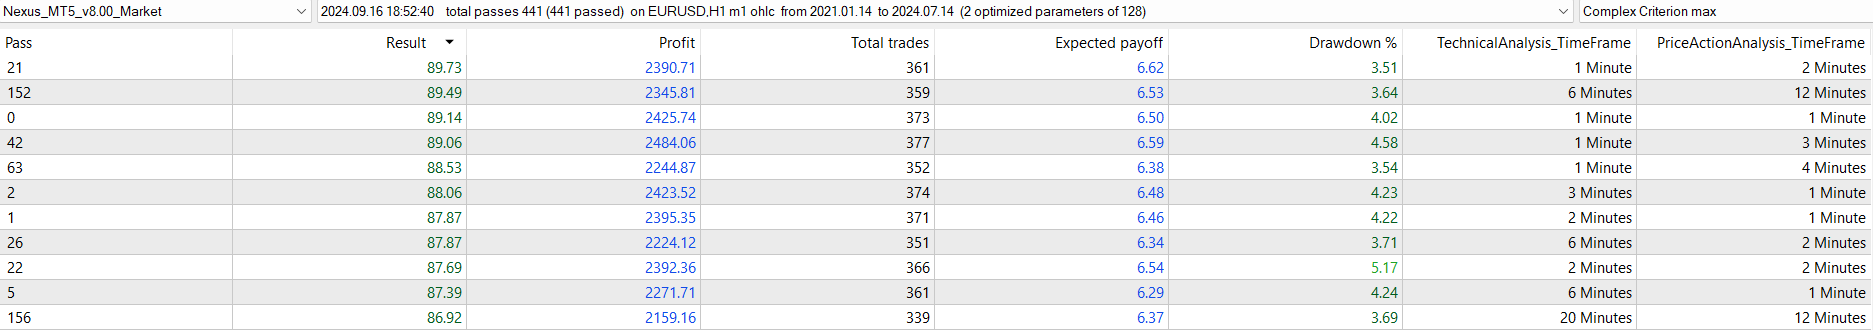
Conclusion: Contrary to what one might expect, lower timeframes have shown better performance. Although I believe higher timeframes should be more efficient when using indicators, in the case of Nexus, its strategies suggest that a lower timeframe serves as a quicker and more accurate trigger for signals. This could explain its better performance under these conditions.
Lot Multipliers and Risk Management Strategy
In an expert advisor that uses lot multipliers, this parameter defines the factor by which the volume of previous trades is increased, creating a recovery pyramid. However, if the multiplier is too high, it can put the account at risk, while if it's too low, it can prolong the time required to achieve a profit, which can be frustrating.
NEXUS employs two different multipliers. The first is applied to the initial trades, facilitating the construction of an initial recovery pyramid. Starting from the fifth trade, a second multiplier is used, designed to manage the accumulated positions more controlled. This approach allows adjusting the strategy based on the operational phase, balancing risk and recovery potential as the trading cycle progresses.
Additionally, NEXUS integrates various risk management strategies that assign different lot sizes depending on the conditions of the new position, such as whether it is above or below the average value of the open positions.
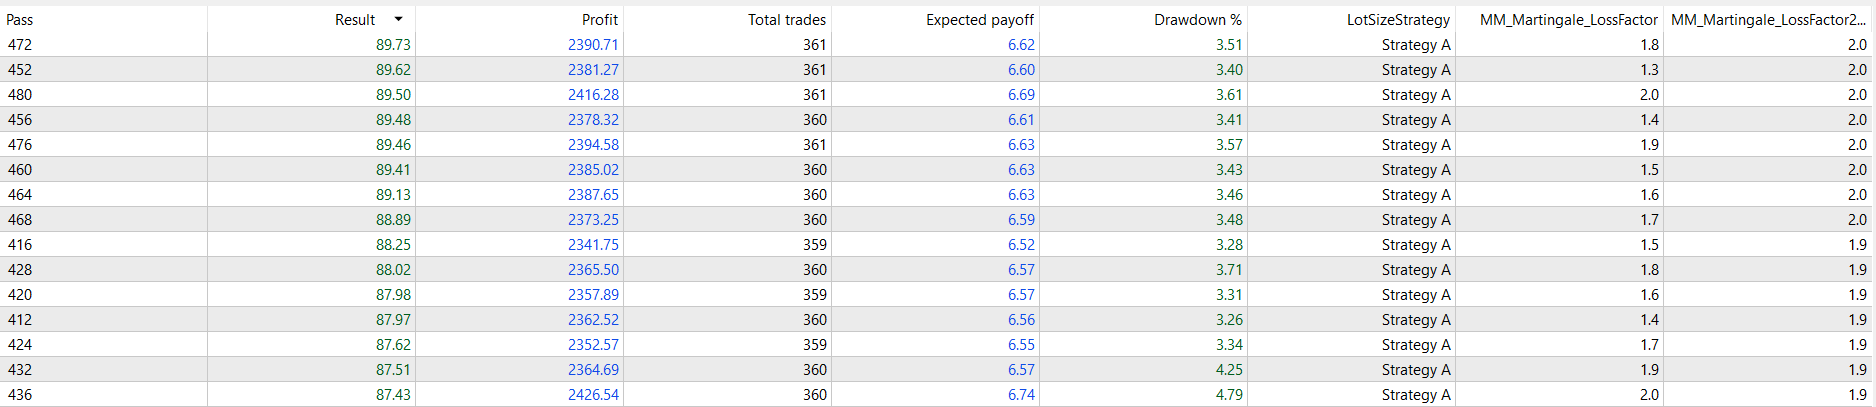
Conclusion: The results suggest that opting for a faster recovery, using a multiplier close to 2, which implies doubling the position size, is more effective. Moreover, Strategy A tends to be the most favored in this approach, reflecting geometric management of trades and maximizing recovery potential in a shorter time.
Use of POC Points
Now that we have defined more solid criteria, let’s review the feasibility of using POC (Point of Control) points. It is crucial to determine if their use provides advantages to NEXUS's overall strategy. At the same time, we will optimize the period, tolerance, and timeframe associated with POC points. These variables will allow us to fine-tune the system’s conditions more precisely. Once these data are obtained, we will draw clearer conclusions to guide the next steps in optimization.
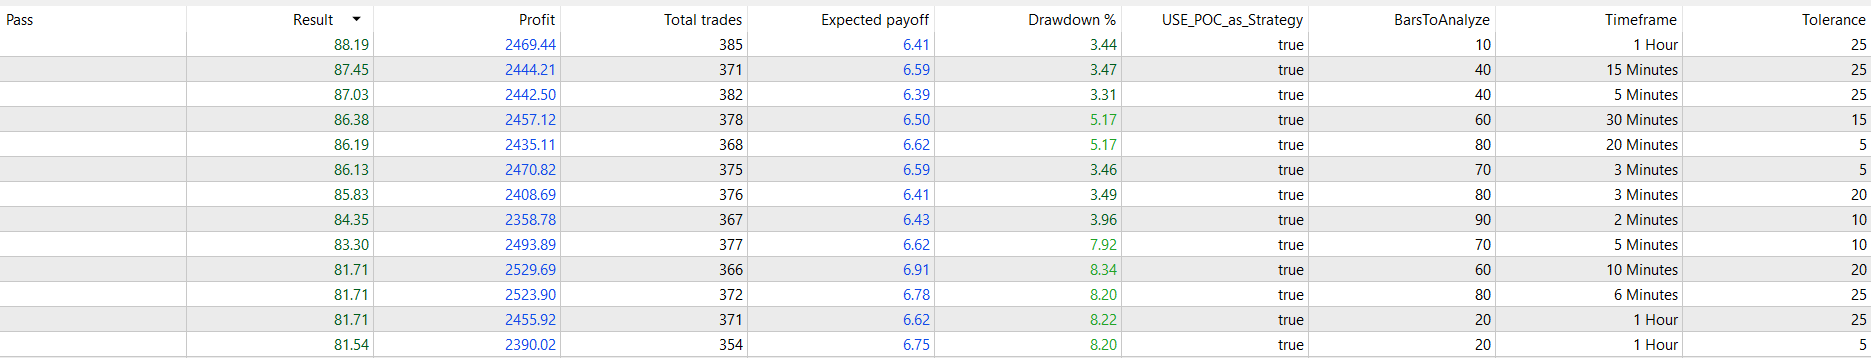
Conclusion: Although the results may seem varied, when analyzing different timeframes and representing them graphically, we can see that the values tend to converge toward a visual consensus. For example, a 1-hour candle equals four 15-minute candles, and a tolerance close to 25% of the main POC value seems to mark buyer-seller consensus points quite accurately. In my case, I will opt for the 1-hour timeframe, as it may involve lower computational costs when calculating POCs.
Strategy Selection
At this point, since we rely on a single condition for the main entry, we will filter which one performs best. To do this, we will test each entry condition individually. On the one hand, we will assess whether we are relying too heavily on a particular condition, and on the other, we will identify if any condition is underperforming in the EUR/USD pair. This will allow us to adjust and improve the expert advisor’s performance, eliminating potential inefficiencies.

Conclusion: In this case, it is not easy to find a clear consensus between the conditions that perform better and those that are less effective. Therefore, we will focus on selecting the condition that yields the best results, thus optimizing the expert advisor's performance based on its strongest behavior.
Let’s proceed with the backtest to visually assess how our linear optimization process is performing. This will allow us to directly observe the expert advisor’s performance and verify whether the implemented improvements are delivering the expected results. The visualization of trades will help identify any additional adjustments needed to further optimize its performance.
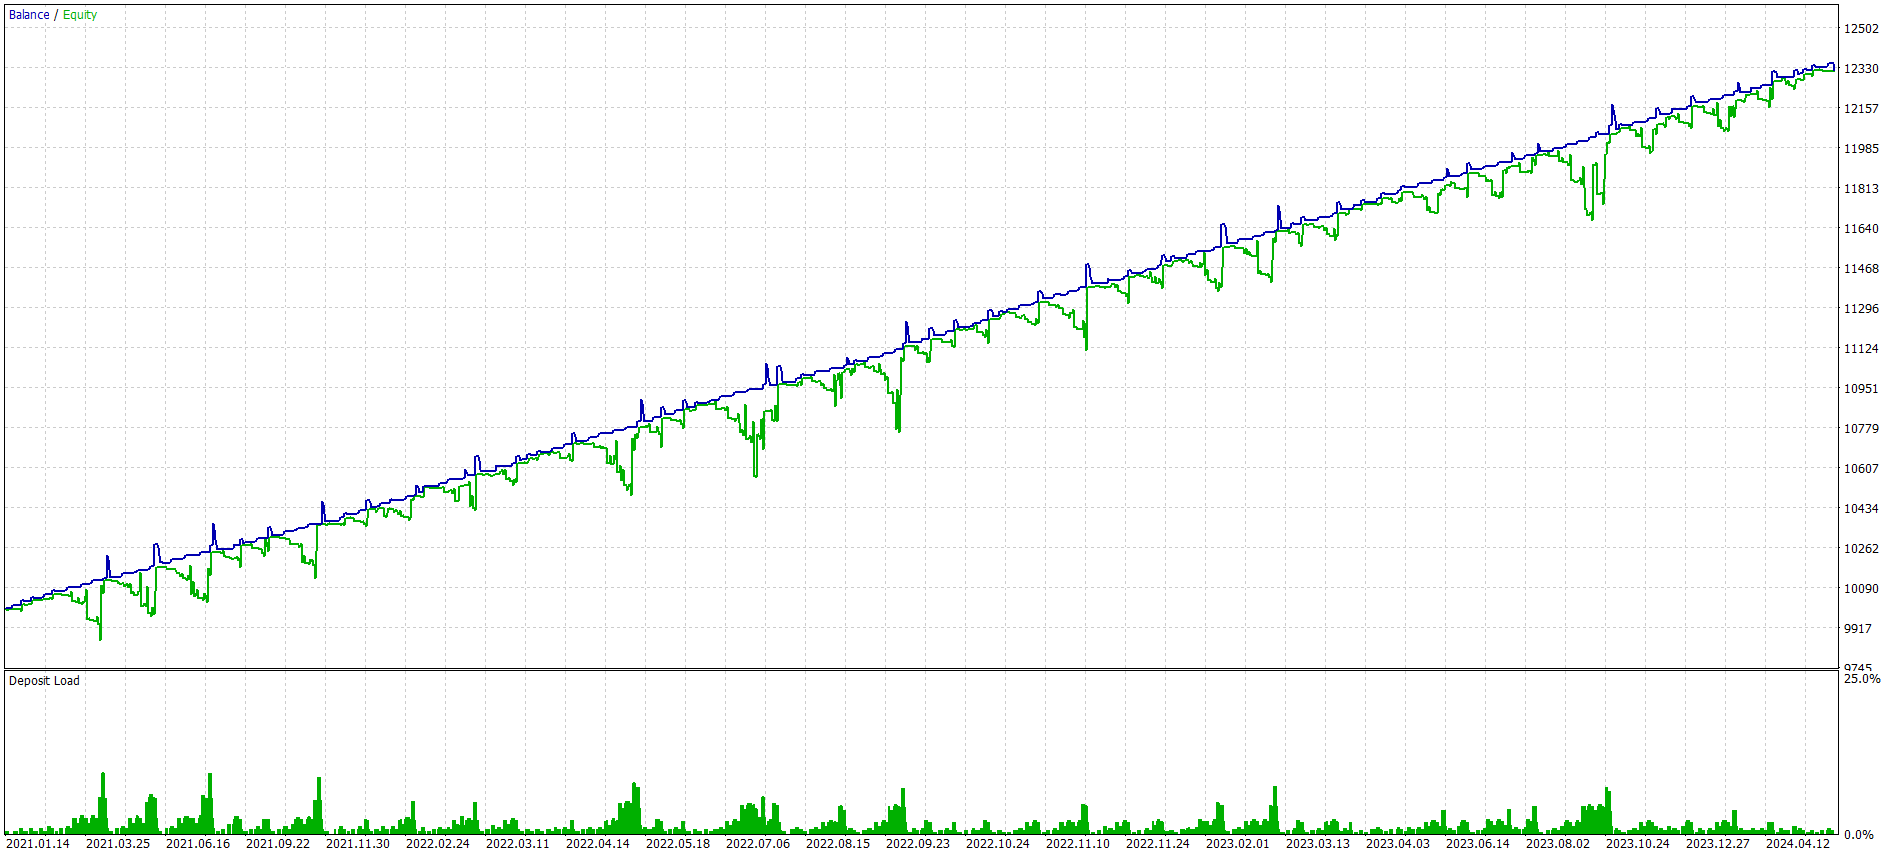
Conclusion: Initial impressions suggest that Nexus is adapting effectively to various market conditions, showing solid performance. This indicates that the linear optimization process is yielding results, allowing the expert advisor to adjust correctly to different scenarios and respond effectively to market fluctuations.
Grid Filter
To conclude this first part of the blog, we will test the grid filter. We have two options: not using a filter or using a filter based on overbought or oversold conditions via the RSI indicator, as well as using POC points as a filter. Both filters operate similarly, as they seek market consolidation when the trend opposes the direction of entries. This way, the trades may be more aligned with a price retracement, increasing the precision of entry points.

Conclusion: Although all three modes perform relatively well, in this case, it seems that not using a filter improves results. The absence of filters allows trades to be executed more frequently, leading to better overall performance in the tests conducted.
Final Conclusion:
The optimization process for NEXUS EA has proven that careful adjustment of key parameters such as entry strategies, timeframes, and lot multipliers can significantly enhance performance. While there isn't a one-size-fits-all approach, our tests have shown that simplifying the strategy and using fewer, more efficient conditions can yield better results. Additionally, the decision to avoid certain filters, such as overbought/oversold conditions, has contributed to a more frequent and profitable trading system. As always, ongoing adjustments and testing remain crucial for adapting to ever-changing market conditions, ensuring NEXUS continues to perform optimally over time.


")