

This scanner is for showing Cross of various TDI elements: PriceLine, Trade Signal Line and Market Base Line
And for getting alerts, so you can be prepared for finding good trade setups before they happen.
It also shows TDI signals, trend, volatility and different timeframe alignment.
Features:
- Show TDI Signal and Trend
- Show Volatility & Overbought/Oversold
- Show cross between:
- PriceLine & TSL
- PriceLine & MBL
- MBL & TSL
- PriceLine and Upper/Lower VBands
- Alerts for alignment between multiple timeframes
https://www.mql5.com/en/market/product/123072/
This current indicator is mainly focused on TDI Lines and is very Alert based.
All TDI lines and where they are at with respect to each other. And alerts for when they cross.
But if you are interested in more TDI features like: Buy/Sell Signal/Trend, Previous Daily/Weekly High/Low, Sharkfins etc then check out this other TDI Scanner:
https://www.mql5.com/en/market/product/41826
It's blog post:
https://www.mql5.com/en/blogs/post/758252
And purchase only after fully understanding all features and differences :)
Please note, I cannot merge the 2 scanners, because the other TDI already has more than 70 settings.
And people using it with an EA won't be able to use it if I add any more. So I had to limit it's development.
And create this separate scanner. This scanner is for people interested in TDI Line Crossings.
Symbols Explained:
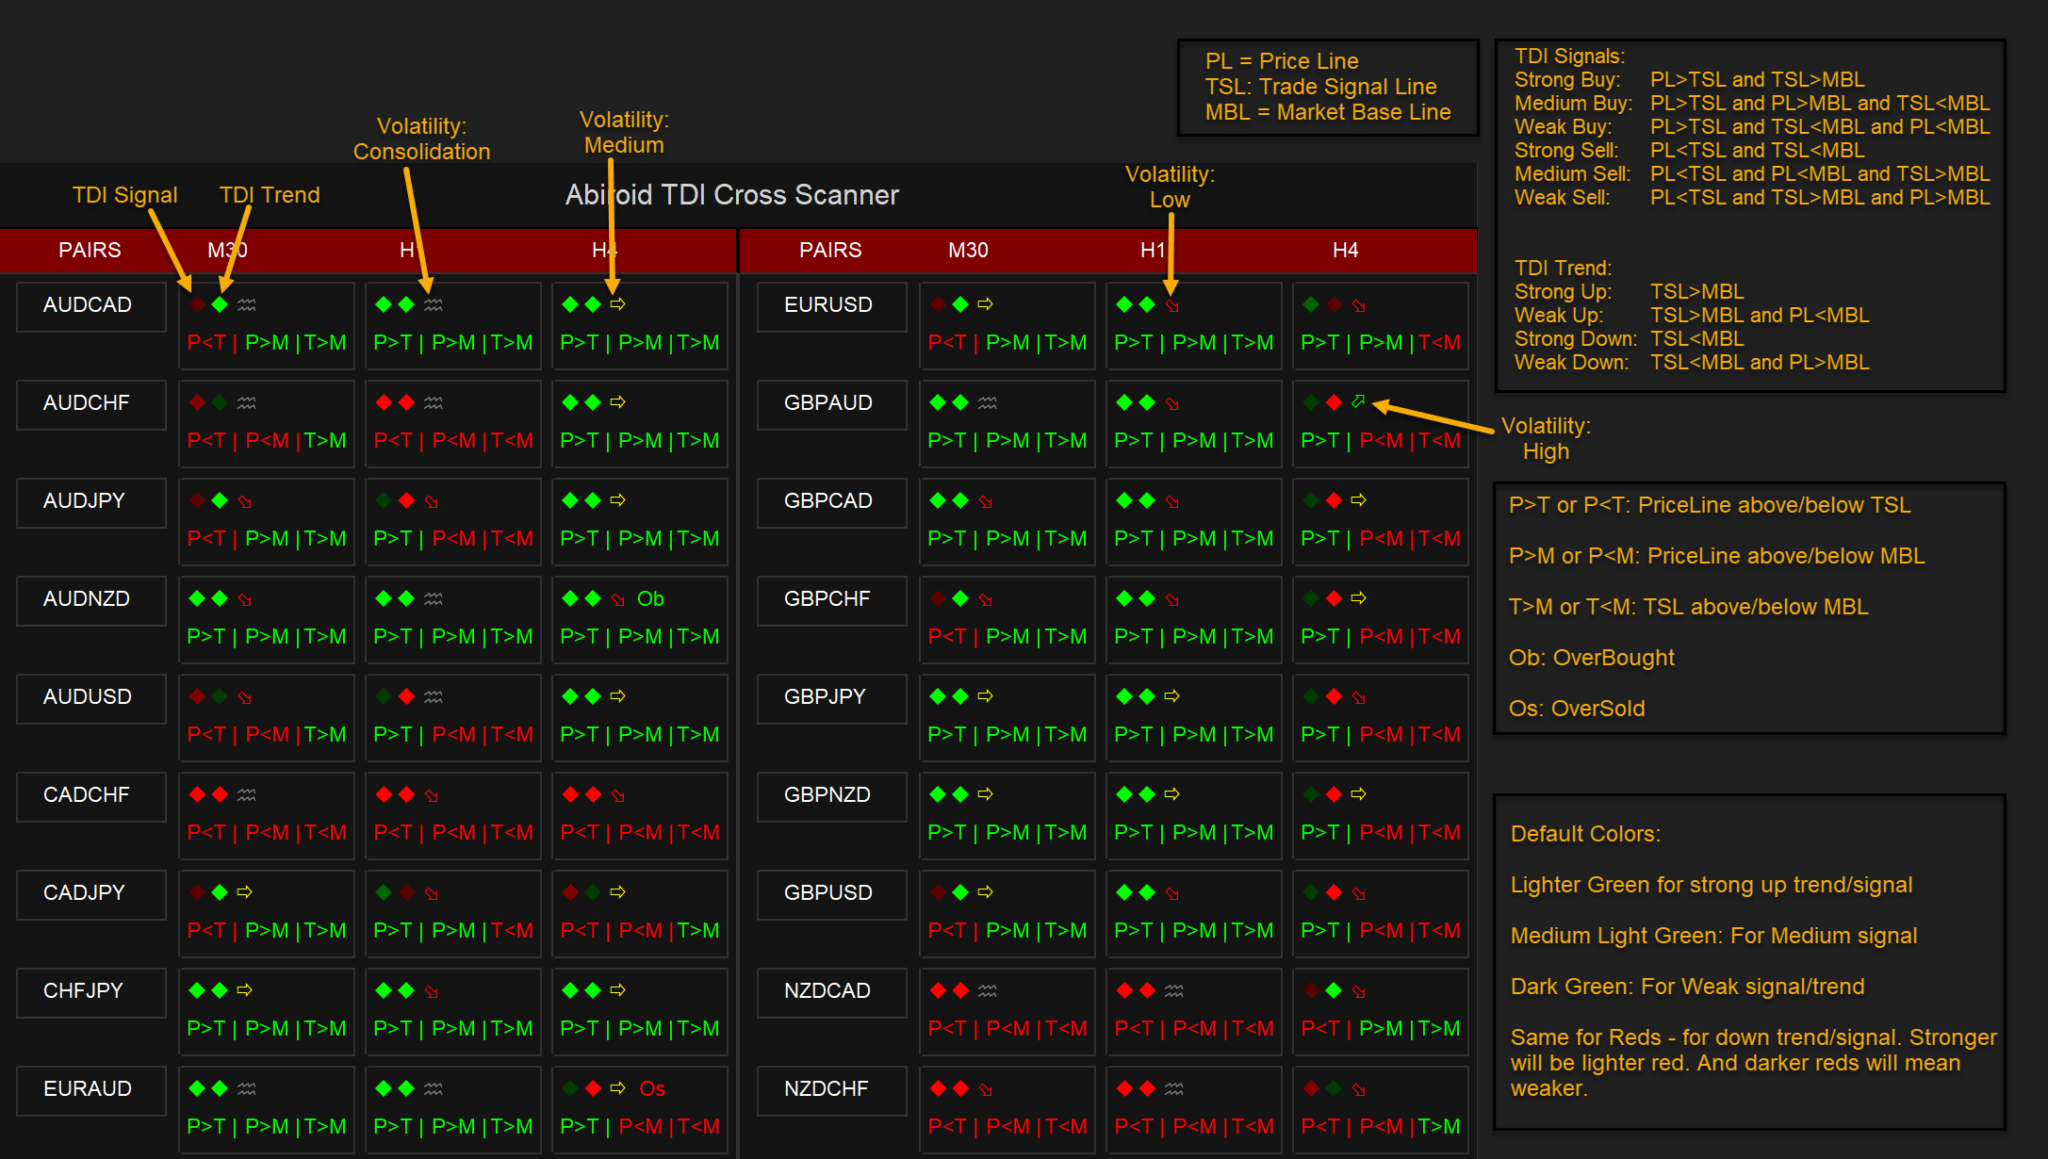
Using PL, TSL and MBL, it calculates the TDI Signal (Buy or Sell) and TDI Trend (Up or Down).
And the strength of the trend and signal: Strong, Medium or Weak.
Check out this post for detailed calculations:
Trader’s Dynamic Index (TDI) Explained
Free Demo:
https://abiroid.com/product/tdi-cross-scanner/
Settings:
Common scanner settings:
https://www.mql5.com/en/blogs/post/747456
Click on title to minimize and maximize the scanner.
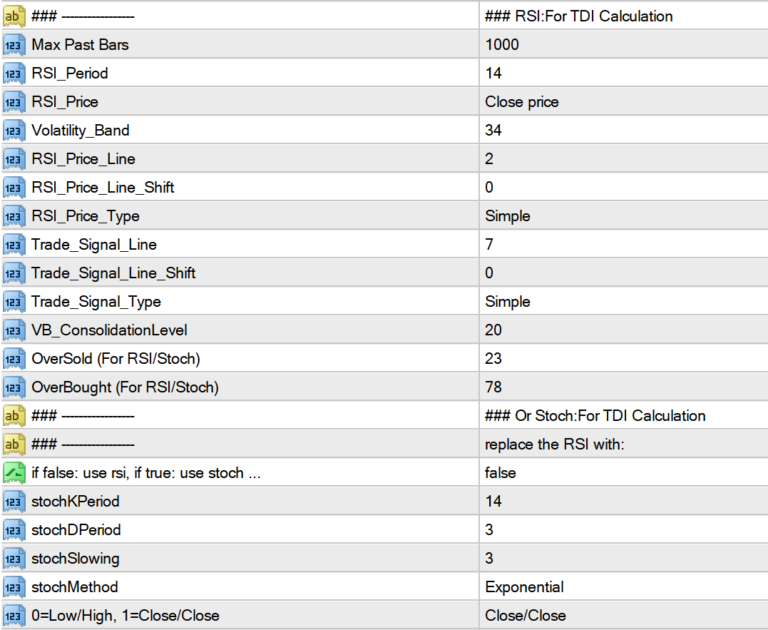
Price Line, TSL and MBL are calculated using these settings:
Symbols Show/Hide on Scanner:
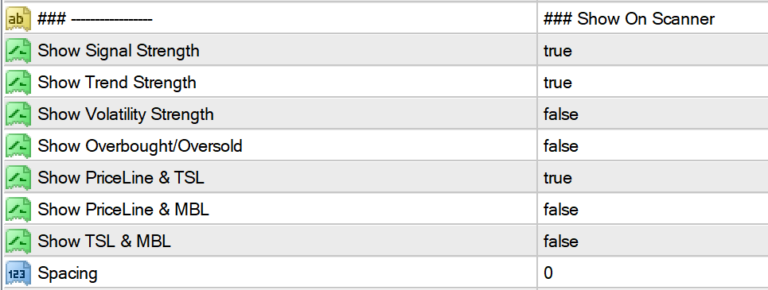
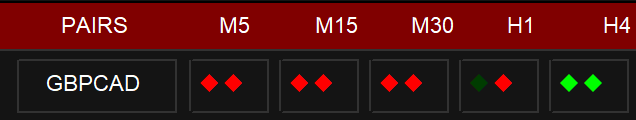
You can select which symbols you need on chart. If you need a compact view, then just keep Signal, Trend, Volatility and OB/OS on.
If you are more interested in TDI Lines crossing and their current state, then keep the remaining true.
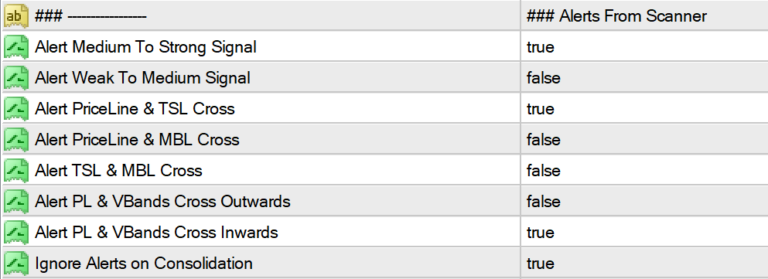
Alerts:
Turn alerts on/off for: Signals, Trend, PL->MBL, PL->TSL, TSL->MBL cross, and PL->Vbands cross.
You can see these lines in the indicator “TDI Alerts_v4.ex4”
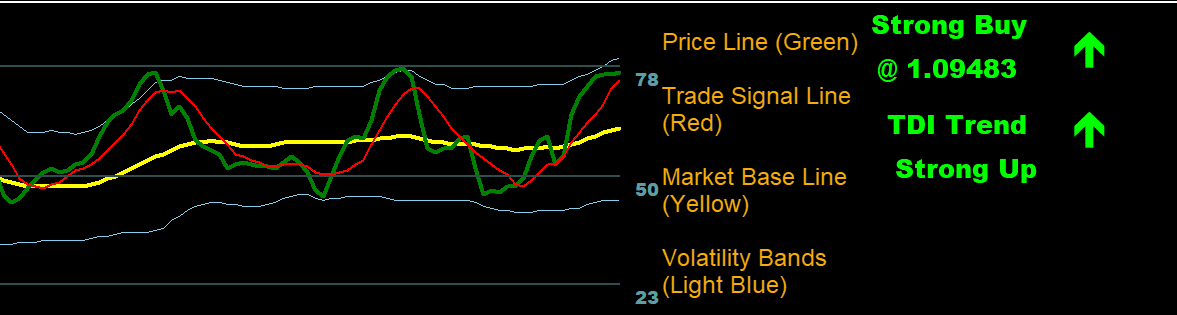
PL = PriceLine (Green), TSL = Trade Signal Line (Red), MBL = Market Base Line (Yellow), VB = Volatility Bands (Blue)
All alerts are ignored if “Ignore Alerts on Consolidation” is true and VBands are close together indicating consolidation.
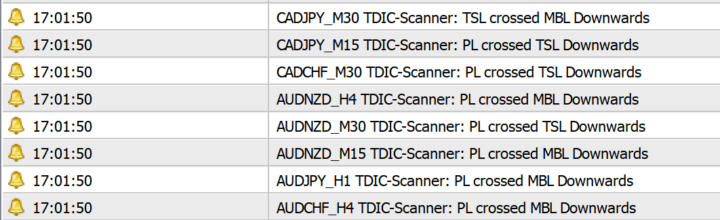
Line Alerts for PL, TSL, MBL look like:
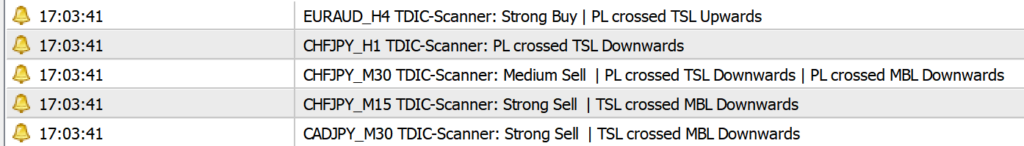
Merged alerts to prevent too many alerts on same bar for same pair/timeframe:
VBands alerts will be merged with volatility strength and not with the remaining lines. To prevent very long alerts.
Alerts for VBands will look like:

Select any 1 line: RSI-PL or MBL or TSL for checking Overbought/Oversold levels crossed:

When selected line crosses an OB or OS level, you’ll get alerts:
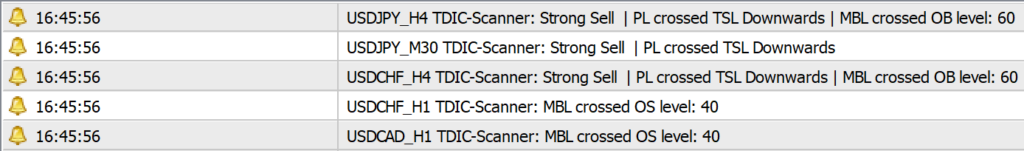
OB/OS Alerts will be merged for a particular pair.
E.g: When price is a strong SELL, and when MBL has crossed into an Overbought level, it means that sell signal is much stronger.
Then, wait for a high volume bar reversal.
You can have multiple scanners on same chart using different unique prefixes. If you need multiple OB/OS line checks.
MultiTimeframe Alignment:
You can specify 2 timeframe lists. And it will check if TDI Signals are aligned or TDI Trends are aligned or not.

e.g: Suppose List1 has M5,M15,H1. And Alert on Trend Align Strong is true. Then it will alert if all 3 timeframes have a strong Up or strong Down signal like this:
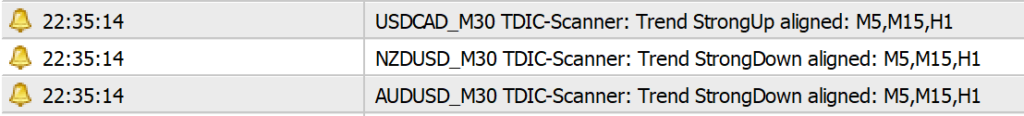
List1 and List2 checks are done separately. Meaning it won’t check List1 trend alignment against List2.
Since these lists are not based on scanners visible timeframes, there are no symbols for alignment on scanner. Only alerts.
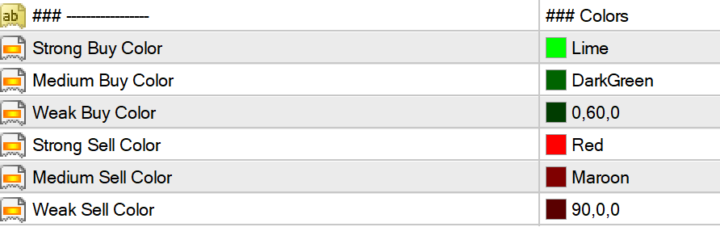
Colors:
You can set custom colors if you like. The default ones are pretty intuitive. Lighter and brighter colors are more visible and indicate strong signals/trends.
Medium colors indicate medium signals. And darker colors indicate Weak signals/trends.
Reading TDI:
TDI is a good validating indicator. Best used with trend based indicators. And it’s important to always study the chart manually before trading.
It’s also useful for finding when a trend might be ending, so you can take profit quickly.
Learn to read the signals on scanner:

Strong Sell trend and signal in middle timeframes: M15,M30,H1 indicate that a strong down trend is ongoing.
But M5 signal is now showing Low Buy. Meaning trend might be ending soon.
H4 has strong Buy, meaning trend earlier was strong buy, but then switched to sell and now might possibly switch back.
Suggests pair has been ranging. Verify by looking at the chart. Good for quick scalping. But not for longer term trading.
In another example: Strong downtrend has been growing. Verify on chart manually. Or using Trend based indicators like EMA Stacking, Heiken etc.
To be sure that price is indeed in a downtrend.
Note: This scanner is not for standalone trading. It’s for people who need to get alerts when TDI lines cross. And when trends align.
To be prepared to catch a trend quickly.
If you see multiple alerts like this, which shows that a currency is climbing like USD here:
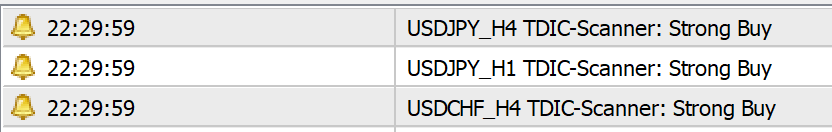
And the scanner shows:

In this case, it is a good idea to trade buy with USD currencies because dollar is climbing. But read chart as everything is overbought. So make sure price hasn’t started ranging yet.
USD indeed did end up doing very well. And when USDCHF started showing weak down signal started. Then price had started ranging.
So, it was a good time to get out and take profits:

So study the scanner to get intuitive understanding of which way price will be moving soon.
Be careful:
If market is erratic or whipsawing, then TDI will be unpredictable. Especially on lower timeframes.
So be careful when market is choppy or has sudden price jumps where price breaks.
Also be careful during ranging markets. As TDI will switch quickly.
For longer trading, only use the direction of overall higher timeframe trends.
And remember, TDI is best used with other validating indicators, which show that price has started trending.
And it’s not always good as a standalone indicator.


