Articles with examples of indicators developed in MQL5
The articles contain detailed explanation of the attached codes. Download and open them in MetaEditor and program together with the author while reading the article.
Add a new article

You are missing trading opportunities:
- Free trading apps
- Over 8,000 signals for copying
- Economic news for exploring financial markets
Registration
Log in
You agree to website policy and terms of use
If you do not have an account, please register


Mountain or Iceberg charts
How do you like the idea of adding a new chart type to the MetaTrader 5 platform? Some people say it lacks a few things that other platforms offer. But the truth is, MetaTrader 5 is a very practical platform as it allows you to do things that can't be done (or at least can't be done easily) in many other platforms.

Developing a trading Expert Advisor from scratch (Part 15): Accessing data on the web (I)
How to access online data via MetaTrader 5? There are a lot of websites and places on the web, featuring a huge amount information. What you need to know is where to look and how best to use this information.
Non-linear indicators
In this article, I will make an attempt to consider some ways of building non-linear indicators and their use in trading. There are quite a few indicators in the MetaTrader trading platform that use non-linear approaches.

Developing a trading Expert Advisor from scratch (Part 12): Times and Trade (I)
Today we will create Times & Trade with fast interpretation to read the order flow. It is the first part in which we will build the system. In the next article, we will complete the system with the missing information. To implement this new functionality, we will need to add several new things to the code of our Expert Advisor.

Master MQL5 from beginner to pro (Part I): Getting started with programming
This article is an introduction to a series of articles about programming. It is assumed here that the reader has never dealt with programming before. So, this series starts from the very basics. Programming knowledge level: Absolute Beginner.
Multiple indicators on one chart (Part 02): First experiments
In the previous article "Multiple indicators on one chart" I presented the concept and the basics of how to use multiple indicators on one chart. In this article, I will provide the source code and will explain it in detail.

Timeseries in DoEasy library (part 54): Descendant classes of abstract base indicator
The article considers creation of classes of descendant objects of base abstract indicator. Such objects will provide access to features of creating indicator EAs, collecting and getting data value statistics of various indicators and prices. Also, create indicator object collection from which getting access to properties and data of each indicator created in the program will be possible.
Creating a ticker tape panel: Basic version
Here I will show how to create screens with price tickers which are usually used to display quotes on the exchange. I will do it by only using MQL5, without using complex external programming.

Ready-made templates for including indicators to Expert Advisors (Part 3): Trend indicators
In this reference article, we will look at standard indicators from the Trend Indicators category. We will create ready-to-use templates for indicator use in EAs - declaring and setting parameters, indicator initialization and deinitialization, as well as receiving data and signals from indicator buffers in EAs.
Timeseries in DoEasy library (part 48): Multi-period multi-symbol indicators on one buffer in a subwindow
The article considers an example of creating multi-symbol multi-period standard indicators using a single indicator buffer for construction and working in the indicator subwindow. I am going to prepare the library classes for working with standard indicators working in the program main window and having more than one buffer for displaying their data.

Multiple indicators on one chart (Part 03): Developing definitions for users
Today we will update the functionality of the indicator system for the first time. In the previous article within the "Multiple indicators on one chart" we considered the basic code which allows using more than one indicator in a chart subwindow. But what was presented was just the starting base of a much larger system.

Developing a trading Expert Advisor from scratch (Part 9): A conceptual leap (II)
In this article, we will place Chart Trade in a floating window. In the previous part, we created a basic system which enables the use of templates within a floating window.
Timeseries in DoEasy library (part 47): Multi-period multi-symbol standard indicators
In this article, I will start developing the methods of working with standard indicators, which will ultimately allow creating multi-symbol multi-period standard indicators based on library classes. Besides, I will add the "Skipped bars" event to the timeseries classes and eliminate excessive load from the main program code by moving the library preparation functions to CEngine class.

Developing a trading Expert Advisor from scratch (Part 10): Accessing custom indicators
How to access custom indicators directly in an Expert Advisor? A trading EA can be truly useful only if it can use custom indicators; otherwise, it is just a set of codes and instructions.

Developing a trading Expert Advisor from scratch (Part 13): Time and Trade (II)
Today we will construct the second part of the Times & Trade system for market analysis. In the previous article "Times & Trade (I)" we discussed an alternative chart organization system, which would allow having an indicator for the quickest possible interpretation of deals executed in the market.
Timeseries in DoEasy library (part 53): Abstract base indicator class
The article considers creation of an abstract indicator which further will be used as the base class to create objects of library’s standard and custom indicators.

Ready-made templates for including indicators to Expert Advisors (Part 2): Volume and Bill Williams indicators
In this article, we will look at standard indicators of the Volume and Bill Williams' indicators category. We will create ready-to-use templates for indicator use in EAs - declaring and setting parameters, indicator initialization and deinitialization, as well as receiving data and signals from indicator buffers in EAs.

Creating a ticker tape panel: Improved version
How do you like the idea of reviving the basic version of our ticker tape panel? The first thing we will do is change the panel to be able to add an image, such as an asset logo or some other image, so that the user could quickly and easily identify the displayed symbol.

Custom Indicators (Part 1): A Step-by-Step Introductory Guide to Developing Simple Custom Indicators in MQL5
Learn how to create custom indicators using MQL5. This introductory article will guide you through the fundamentals of building simple custom indicators and demonstrate a hands-on approach to coding different custom indicators for any MQL5 programmer new to this interesting topic.
Canvas based indicators: Filling channels with transparency
In this article I'll introduce a method for creating custom indicators whose drawings are made using the class CCanvas from standard library and see charts properties for coordinates conversion. I'll approach specially indicators which need to fill the area between two lines using transparency.

Timeseries in DoEasy library (part 52): Cross-platform nature of multi-period multi-symbol single-buffer standard indicators
In the article, consider creation of multi-symbol multi-period standard indicator Accumulation/Distribution. Slightly improve library classes with respect to indicators so that, the programs developed for outdated platform MetaTrader 4 based on this library could work normally when switching over to MetaTrader 5.

Creating multi-symbol, multi-period indicators
In this article, we will look at the principles of creating multi-symbol, multi-period indicators. We will also see how to access the data of such indicators from Expert Advisors and other indicators. We will consider the main features of using multi-indicators in Expert Advisors and indicators and will see how to plot them through custom indicator buffers.

Implementing the Janus factor in MQL5
Gary Anderson developed a method of market analysis based on a theory he dubbed the Janus Factor. The theory describes a set of indicators that can be used to reveal trends and assess market risk. In this article we will implement these tools in mql5.

ALGLIB numerical analysis library in MQL5
The article takes a quick look at the ALGLIB 3.19 numerical analysis library, its applications and new algorithms that can improve the efficiency of financial data analysis.

Developing a trading Expert Advisor from scratch (Part 14): Adding Volume At Price (II)
Today we will add some more resources to our EA. This interesting article can provide some new ideas and methods of presenting information. At the same time, it can assist in fixing minor flaws in your projects.
Timeseries in DoEasy library (part 51): Composite multi-period multi-symbol standard indicators
In the article, complete development of objects of multi-period multi-symbol standard indicators. Using Ichimoku Kinko Hyo standard indicator example, analyze creation of compound custom indicators which have auxiliary drawn buffers for displaying data on the chart.

Master MQL5 from beginner to pro (Part II): Basic data types and use of variable
This is a continuation of the series for beginners. In this article, we'll look at how to create constants and variables, write dates, colors, and other useful data. We will learn how to create enumerations like days of the week or line styles (solid, dotted, etc.). Variables and expressions are the basis of programming. They are definitely present in 99% of programs, so understanding them is critical. Therefore, if you are new to programming, this article can be very useful for you. Required programming knowledge level: very basic, within the limits of my previous article (see the link at the beginning).

Discrete Hartley transform
In this article, we will consider one of the methods of spectral analysis and signal processing - the discrete Hartley transform. It allows filtering signals, analyzing their spectrum and much more. The capabilities of DHT are no less than those of the discrete Fourier transform. However, unlike DFT, DHT uses only real numbers, which makes it more convenient for implementation in practice, and the results of its application are more visual.

Experiments with neural networks (Part 7): Passing indicators
Examples of passing indicators to a perceptron. The article describes general concepts and showcases the simplest ready-made Expert Advisor followed by the results of its optimization and forward test.

How to build and optimize a volatility-based trading system (Chaikin Volatility - CHV)
In this article, we will provide another volatility-based indicator named Chaikin Volatility. We will understand how to build a custom indicator after identifying how it can be used and constructed. We will share some simple strategies that can be used and then test them to understand which one can be better.
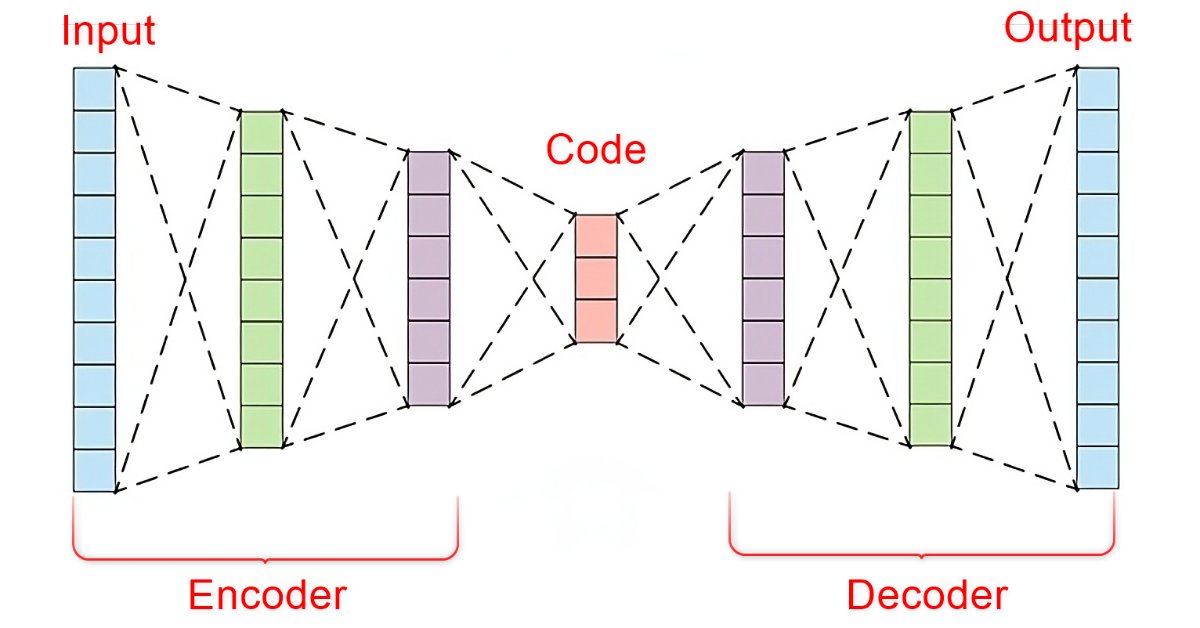
Data Science and Machine Learning (Part 22): Leveraging Autoencoders Neural Networks for Smarter Trades by Moving from Noise to Signal
In the fast-paced world of financial markets, separating meaningful signals from the noise is crucial for successful trading. By employing sophisticated neural network architectures, autoencoders excel at uncovering hidden patterns within market data, transforming noisy input into actionable insights. In this article, we explore how autoencoders are revolutionizing trading practices, offering traders a powerful tool to enhance decision-making and gain a competitive edge in today's dynamic markets.

Timeseries in DoEasy library (part 50): Multi-period multi-symbol standard indicators with a shift
In the article, let’s improve library methods for correct display of multi-symbol multi-period standard indicators, which lines are displayed on the current symbol chart with a shift set in the settings. As well, let’s put things in order in methods of work with standard indicators and remove the redundant code to the library area in the final indicator program.
Graphical Interfaces X: Updates for the Rendered table and code optimization (build 10)
We continue to complement the Rendered table (CCanvasTable) with new features. The table will now have: highlighting of the rows when hovered; ability to add an array of icons for each cell and a method for switching them; ability to set or modify the cell text during the runtime, and more.

Implementing the Generalized Hurst Exponent and the Variance Ratio test in MQL5
In this article, we investigate how the Generalized Hurst Exponent and the Variance Ratio test can be utilized to analyze the behaviour of price series in MQL5.

Introduction to MQL5 (Part 4): Mastering Structures, Classes, and Time Functions
Unlock the secrets of MQL5 programming in our latest article! Delve into the essentials of structures, classes, and time functions, empowering your coding journey. Whether you're a beginner or an experienced developer, our guide simplifies complex concepts, providing valuable insights for mastering MQL5. Elevate your programming skills and stay ahead in the world of algorithmic trading!

Introduction to MQL5 (Part 3): Mastering the Core Elements of MQL5
Explore the fundamentals of MQL5 programming in this beginner-friendly article, where we demystify arrays, custom functions, preprocessors, and event handling, all explained with clarity making every line of code accessible. Join us in unlocking the power of MQL5 with a unique approach that ensures understanding at every step. This article sets the foundation for mastering MQL5, emphasizing the explanation of each line of code, and providing a distinct and enriching learning experience.

Benefiting from Forex market seasonality
We are all familiar with the concept of seasonality, for example, we are all accustomed to rising prices for fresh vegetables in winter or rising fuel prices during severe frosts, but few people know that similar patterns exist in the Forex market.

Category Theory in MQL5 (Part 5): Equalizers
Category Theory is a diverse and expanding branch of Mathematics which is only recently getting some coverage in the MQL5 community. These series of articles look to explore and examine some of its concepts & axioms with the overall goal of establishing an open library that provides insight while also hopefully furthering the use of this remarkable field in Traders' strategy development.

Elastic net regression using coordinate descent in MQL5
In this article we explore the practical implementation of elastic net regression to minimize overfitting and at the same time automatically separate useful predictors from those that have little prognostic power.
DRAW_ARROW drawing type in multi-symbol multi-period indicators
In this article, we will look at drawing arrow multi-symbol multi-period indicators. We will also improve the class methods for correct display of arrows showing data from arrow indicators calculated on a symbol/period that does not correspond to the symbol/period of the current chart.