
Fix PriceAction Stoploss or Fixed RSI (Smart StopLoss)
Introduction
The search for a holy grail in trading has led me to this research. Stop-loss is the most important tool in trading when money management is concerned. Money management is among the different ways a trader can make money in the market and be consistent in the long run. As stated earlier, money management is strongly associated with stop-loss and risk-reward ratio. The 1:1.5R (Risk:Reward) ratio tends to have higher win-rate when compared to other Risk:Reward’s win-rate but the 1:>1.9R(Risk:Reward) ratio most time tends to be more profitable and keep a trader in consistent profit over a long period of time (Holy grail). This “Holy grail'' trading strategy has it down side. In an ideal situation, trading with 1:>1.9R(Risk:Reward) will be profitable if, out of 10 trades (1pips each), 6 trades were lost (6 pips) and 4 trades were gained (8 pips). This means we are in profit by 2 pips. In the real-life application, it might not be all true. One major factor that contributes to this is a term known as “Stop-loss Hunt”. Stop-loss Hunt is when a trade hits your stop-loss for liquidity then moves in the direction you predicted. Stop-loss Hunt is a major issue in trading and money management. It also has a psychological effect on traders (mostly new traders).
Fig 1.1. Stop-loss Hunt
Stop-loss hunt is mostly associated with fixed or trailing stop-loss on the price action or candlestick chart. If there are no stop-loss on the price action chart, there will be no stop-loss hunt. But zero stop-loss is equal to the probability of blowing your trading account (which is equal to one (1)).
RSI Stop-loss
The RSI oscillator is a replica of the price action line chart plotted on a limit window of 100 to 0
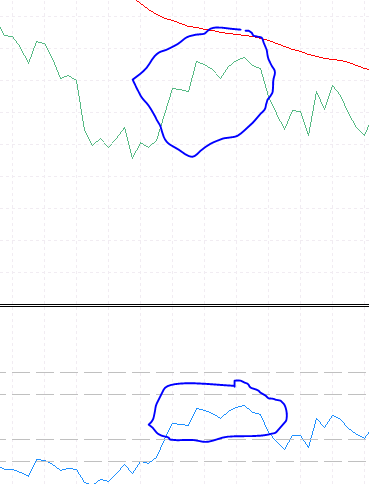
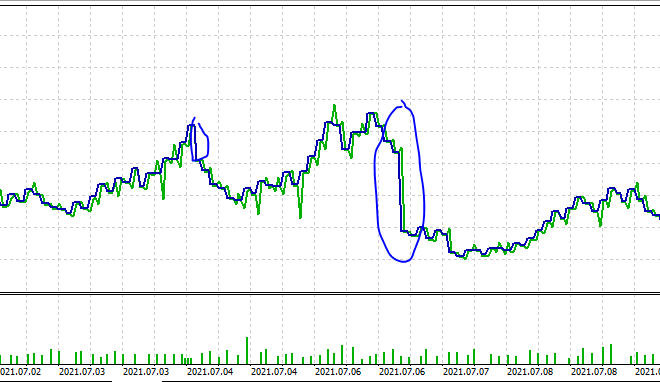
Fig 1.2. RSI and Line Chart
If the RSI indicator and the Line Chart are very similar, then making use of the RSI indicator as a smart stop-loss might reduce the risk of stop-loss hunts.
Aim:
My aim here is to verify if the use of RSI stop-loss would be able to reduce stop-loss hunt and above all be profitable in the long run.
Objective:
Two same strategies will be compared: one with stop-loss set on the price action chart, and the other with stop-loss set on the RSI indicator.
Strategy and Code
Classic Stop-Loss on price action chart
For the First EA with fixed stop-loss on the price action. Below are the requirements for the strategy
| Parameters | Description |
|---|---|
| Used Indicator | MACD (12,26,9) |
| Used Indicator | Moving Average (200) |
| Used Indicator | Moving Average (50) |
| Used Indicator | ATR (5) |
| Time Frame | 1 min |
| Entry for Buy | If the Moving Average (50) is above the Moving Average (200) and the MACD line is greater than Signal line when both the MACD line and the Signal line are below zero |
| Entry for Sell | If the Moving Average (50) is below the Moving Average (200) and the MACD line is less than Signal line when both the MACD line and the Signal line are above zero |
| Exit | Take profit and Stop-loss (1:2R). The stop-loss for buy condition is the lowest of twenty (20) candles after entry minus the ATR (5) value And the stop-loss for sell condition is the highest of twenty (20) candles after entry plus the ATR (5) value
|
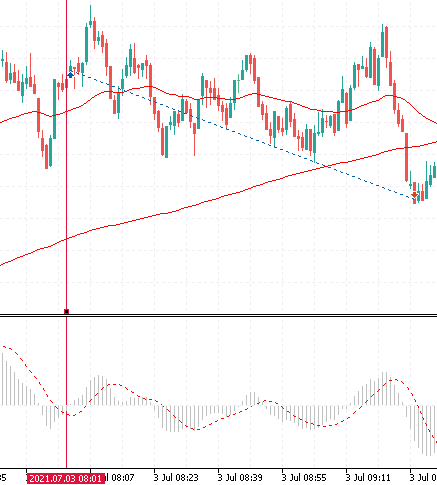
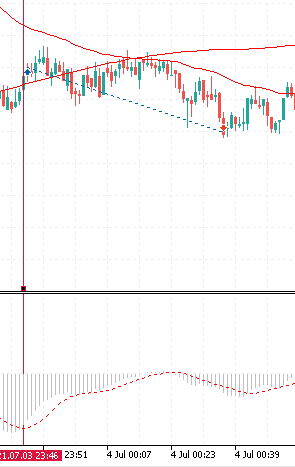
Graphical representation is shown below.
Fig 2.1 Buy Entry
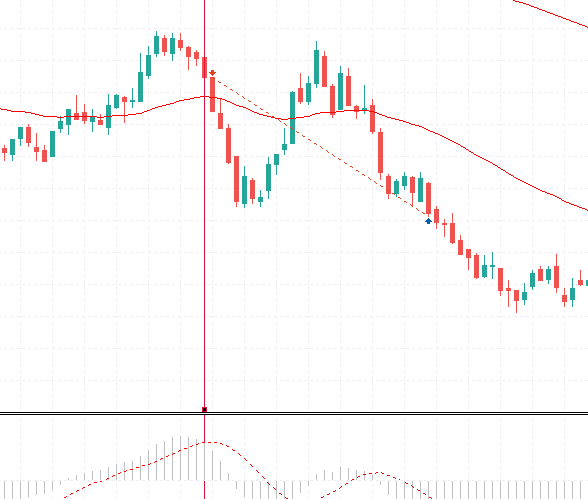
Fig 2.2 Sell Entry
Code
#property copyright "Copyright 2021, MetaQuotes Ltd."
#property link      "https://www.mql5.com"
#property version   "1.00"
//+------------------------------------------------------------------+
//| Expert initialization function                                   |
//+------------------------------------------------------------------+
#include<Trade\Trade.mqh>
CTrade trade;
int MATrend;
int MADirection;
int MACD;
int ATR;
input int afi;// ----------RiskAmount------------
input double risk = 0.02; //% Amount to risk
input int atrValue = 20; // ATR VAlue
input int ai;// ----------Moving Average inputs------------
input int movAvgTrend = 200;// Moving Average Trend
input int movAvgDirection = 50;//moving Average for trend Direction;
input int i;// -----------MACD inputs-----------------------
input int fast = 12;// Macd Fast
input int slow = 26; //Macd Slow
input int signal = 9; //Signal Line
Other variable declared
double pipValue  = 0.0;//

double Balance; // For the Current Balance
The variables were assigned to each handler in the init() function
int OnInit()
  {
//---
      //Moving Averages Indicators''
      MATrend = iMA(_Symbol,_Period,movAvgTrend,0,MODE_SMA,PRICE_CLOSE); //Moving Average 200
      MADirection = iMA(_Symbol,_Period,movAvgDirection,0,MODE_EMA,PRICE_CLOSE); //Moving Average 50
      //MACD
      MACD = iMACD(_Symbol,_Period,fast,slow,signal,PRICE_CLOSE);//MACD
      //ATR
      ATR = iATR(_Symbol,_Period,atrValue);
      //---
      point=_Point;
      double Digits=_Digits;

      if((_Digits==3) || (_Digits==5))
      {
         point*=10;
      }
      return(INIT_SUCCEEDED);
  }
The code on how the strategy runs is shown below
void Strategy() {
   MqlRates priceAction[];
   ArraySetAsSeries(priceAction,true);
   int priceData = CopyRates(_Symbol,_Period,0,200,priceAction);

   double maTrend[]; ArraySetAsSeries(maTrend,true);
   CopyBuffer(MATrend,0,0,200,maTrend); //200 MA

   double madirection[]; ArraySetAsSeries(madirection,true);
   CopyBuffer(MADirection,0,0,200,madirection);  //50 MA

   double macd[]; ArraySetAsSeries(macd,true);
   CopyBuffer(MACD,0,0,200,macd);  //MACD

   double macds[]; ArraySetAsSeries(macds,true);
   CopyBuffer(MACD,1,0,200,macds);  //MACD_Signal Line

   double Bid  = NormalizeDouble(SymbolInfoDouble(_Symbol,SYMBOL_BID),_Digits);
   double Ask = NormalizeDouble(SymbolInfoDouble(_Symbol,SYMBOL_ASK),_Digits);


   if (madirection[1]>maTrend[1]) {
      //Buy ; Uptrend


      bool macd_bZero = macds[1]<0&&macd[1]<0; //MacD Signal Line is less than Zero
      bool macd_cross = macd[1]>macds[1];// Macd Crosses the signal line

      if (macd_bZero && macd_cross) {
         buyTrade = true;
      }


   } else if (madirection[1]<maTrend[1]) {
      //Sell; DownTrend


      bool macd_bZero = macds[1]>0&&macd[1]>0;; //MacD Signal Line is less than Zero
      bool macd_cross = macd[1]<macds[1];// Macd Crosses the signal line

      if (macd_bZero && macd_cross) {
         sellTrade = true;
      }

    }

   if (buyTrade && sellTrade) {
      buyTrade = false;
      sellTrade = false;
   return;
   }


   if (buyTrade) {
      buyTrade = false;
      sellTrade = false;

      Buy(Ask);
   } else if (sellTrade) {
      buyTrade = false;
      sellTrade = false;

      Sell(Bid);
   }

}
Entry (Buy and Sell)
void Buy(double Ask) {
   double atr[]; ArraySetAsSeries(atr,true); //This array is use to store all ATR value to the last closed bar
   CopyBuffer(ATR,0,0,200,atr); // This method copy the buffer value of the ATR indicator into the array (200 buffered data)

   theLotsize =  NormalizeDouble((Balance*risk)/((MathAbs(Ask-((stoplossforBuy(20)-atr[1])))*100)*pipValue),2); // This Calculate the lotsize using the % to risk
   trade.Buy(theLotsize,_Symbol,Ask,(stoplossforBuy(20)-atr[1]),Ask+(2*MathAbs(Ask-((stoplossforBuy(20)-atr[1])))),NULL); //Buy Entry with zero stoploss && take profit is twice the distance between the entry and the lowest candle


}
void Sell(double Bid) {
   double atr[]; ArraySetAsSeries(atr,true); //This array is use to store all ATR value to the last closed bar
   CopyBuffer(ATR,0,0,200,atr); // This method copy the buffer value of the ATR indicator into the array (200 buffered data)
   theLotsize =  NormalizeDouble((Balance*risk)/((MathAbs(Bid-((stoplossforSell(20)+atr[1])))*100)*pipValue),2); // This Calculate the lotsize using the % to risk
   trade.Sell(theLotsize,_Symbol,Bid,(stoplossforSell(20)+atr[1]),Bid-(2*MathAbs(((stoplossforSell(20)+atr[1]))-Bid)),NULL); //Sell Entry with zero stoploss && take profit is twice the distance between the entry and the highest candle

}
From the above codes we called two methods which are the stoplossforSell(int num) and the stoplossforBuy(int num). These two methods are meant specifically for identifying the highest and lowest candle of the assigned number respectively after the trade entry is triggered. E.g stoplossforSell(20) returns the highest candle among 20 previous candles before the entry.
double stoplossforBuy(int numcandle) {
         int LowestCandle;

         //Create array for candle lows
         double low[];

         //Sort Candle from current downward
         ArraySetAsSeries(low,true);

         //Copy all lows for 100 candle
         CopyLow(_Symbol,_Period,0,numcandle,low);

         //Calculate the lowest candle
         LowestCandle = ArrayMinimum(low,0,numcandle);

         //Create array of price
         MqlRates PriceInfo[];

         ArraySetAsSeries(PriceInfo,true);

         //Copy price data to array

         int Data = CopyRates(Symbol(),Period(),0,Bars(Symbol(),Period()),PriceInfo);

         return PriceInfo[LowestCandle].low;


}
double stoplossforSell(int numcandle) {
         int HighestCandle;
         double High[];

       //Sort array downward from current candle
         ArraySetAsSeries(High,true);

       //Fill array with data for 100 candle
         CopyHigh(_Symbol,_Period,0,numcandle,High);

         //calculate highest candle
         HighestCandle = ArrayMaximum(High,0,numcandle);

         //Create array for price
         MqlRates PriceInformation[];
         ArraySetAsSeries(PriceInformation,true);


         //Copy price data to array
         int Data = CopyRates(Symbol(),Period(),0,Bars(Symbol(),Period()),PriceInformation);

         return PriceInformation[HighestCandle].high;


 }
This EA enters trade one at a time by checking if there is an open trade or not. If there are no open trades, then the strategy method is called.
void OnTick()
  {
//---
   pipValue  = ((((SymbolInfoDouble(Symbol(), SYMBOL_TRADE_TICK_VALUE))*point)/(SymbolInfoDouble(Symbol(),SYMBOL_TRADE_TICK_SIZE))));

   Balance = AccountInfoDouble(ACCOUNT_BALANCE);

   if (PositionsTotal()==0) {
      Strategy();
   }
  }
RSI Stop-Loss on the RSI indicator
For the Second EA with fixed stop-loss on the RSI Indicator. Below are the requirements for the strategy.
| Parameters | Description |
| Used Indicator | MACD (12,26,9) |
| Used Indicator | Moving Average (200) |
| Used Indicator | Moving Average (50) |
| Used Indicator | ATR (5) |
| Time Frame | 1 min |
| Entry for Buy | If the Moving Average (50) is above the Moving Average (200) and the MACD line is greater than Signal line when both the MACD line and the Signal line are below zero |
| Entry for Sell | If the Moving Average (50) is below the Moving Average (200) and the MACD line is less than Signal line when both the MACD line and the Signal line are above zero |
| Exit | Take profit. The stop-loss for buy condition is the lowest of twenty (10) RSI Value after Entry And the stop-loss for sell condition is the highest of twenty (10) RSI Value after Entry
If the RSI crosses the highest or lowest RSI, the trade is closed.
|
Line is drawn on the RSI Stop loss for easy visualization
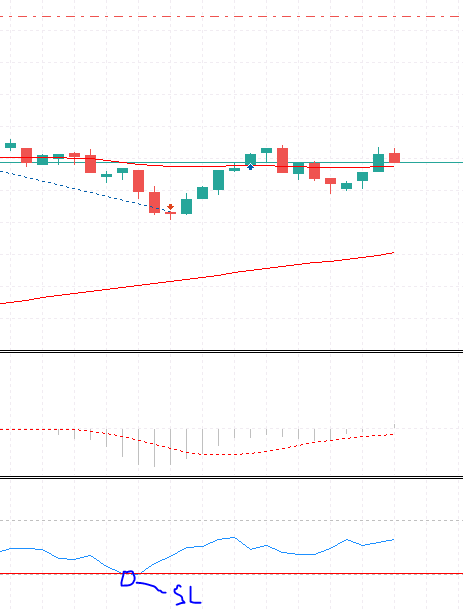
Fig 2.3. Buy trade with stop-loss at RSI
The trade closes when the current RSI value is less than the Stop-loss line on the RSI window.
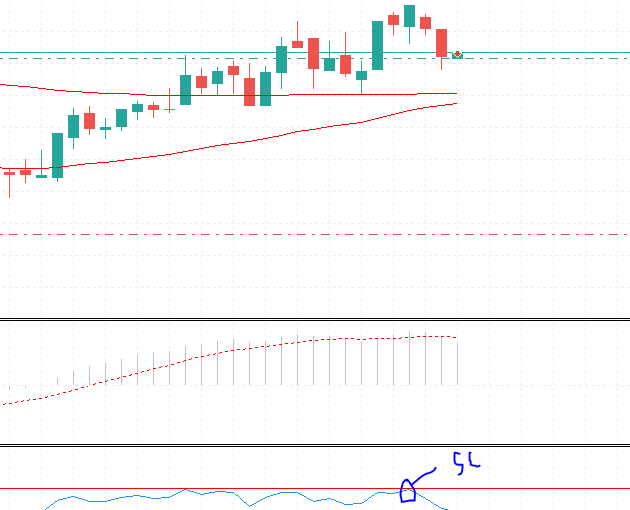
Fig 2.4. Sell Trade with Stop-loss at the RSI
The trade closes when the current RSI value is greater than the Stop-loss line on the RSI window.
Code
The first part of the code is mainly for variable declaration and input data. Similar to the first indicator with few additions shown below
int RSI;
input int rsi = 5; // RSI VAlue
double lowestrsiValue = 100;
double highestrsiValue = 0.0;
Similarly, the onint() method is also similar with few additions as shown below
int OnInit()
  {
              //RSI
      RSI = iRSI(_Symbol,_Period,rsi,PRICE_CLOSE);
}
The code for the strategy is same as above. But the entry for both buy and sell has no stop loss in it because we will be using the RSI level as the stop-loss. Below are the code for the entries
void Buy(double Ask) {
   double atr[]; ArraySetAsSeries(atr,true); //This array is use to store all ATR value to the last closed bar
   CopyBuffer(ATR,0,0,200,atr); // This method copy the buffer value of the ATR indicator into the array (200 buffered data)

   theLotsize =  NormalizeDouble((Balance*risk)/((MathAbs(Ask-((stoplossforBuy(20)-atr[1])))*100)*pipValue),2); // This Calculate the lotsize using the % to risk

   ObjectCreate(0,"sl",OBJ_HLINE,3,0,lowestRSI(10)); // Since our stoploss is zero we assign a smart stoploss on the rsi by drawing a line on the rsi window
   trade.Buy(theLotsize,_Symbol,Ask,0,Ask+(2*MathAbs(Ask-((stoplossforBuy(20)-atr[1])))),NULL);//Buy Entry with zero stoploss && take profit is twice the distance between the entry and the lowest candle
    Print("SL",lowestRSI(10));
}
void Sell(double Bid) {
   double atr[]; ArraySetAsSeries(atr,true); //This array is use to store all ATR value to the last closed bar
   CopyBuffer(ATR,0,0,200,atr); // This method copy the buffer value of the ATR indicator into the array (200 buffered data)

   theLotsize =  NormalizeDouble((Balance*risk)/((MathAbs(Bid-((stoplossforSell(20)+atr[1])))*100)*pipValue),2);  // This Calculate the lotsize using the % to risk

   ObjectCreate(0,"sl",OBJ_HLINE,3,0,highestRSI(10)); // Since our stoploss is zero we assign a smart stoploss on the rsi by drawing a line on the rsi window
   trade.Sell(theLotsize,_Symbol,Bid,0,Bid-(2*MathAbs(((stoplossforSell(20)+atr[1]))-Bid)),NULL);//Sell Entry with zero stoploss && take profit is twice the distance between the entry and the highest candle
   Print("SL",highestRSI(10));
}
The final part of the code that's different from the above EA is the methods that get the lowest and highest values of the RSI. This is called from the entries method above and uses the data to draw a line at the point of the lowest or highest RSI.
Note: The drawn line is deleted in the strategy method when there is no open position.
 double lowestRSI(int count) {
      double thersi[]; ArraySetAsSeries(thersi,true);
      CopyBuffer(RSI,0,0,200,thersi);

      for (int i = 0; i<count;i++) {

         if (thersi[i]<lowestrsiValue) {
            lowestrsiValue = thersi[i];
         }
      }
   return lowestrsiValue;
}
//This method get the Highest RSI afer ENtry to set the smart Stoploss
double highestRSI(int count) {


      double thersi[]; ArraySetAsSeries(thersi,true);
      CopyBuffer(RSI,0,0,200,thersi);

      for (int i = 0; i<count;i++) {

         if (thersi[i]>highestrsiValue) {
            highestrsiValue = thersi[i];
         }
      }
   return highestrsiValue;
}
####
Now that the EAs are set and complied, we can proceed to testing both EAs for the required result.
Test And Result
Stop-Loss hunt test
In the section, the test and the result obtained from the simulation will be present. The first test to be carried out is to determine if the RSI STOP-LOSS EA is able to REDUCE the issue of stop-loss hunt while trading. It will be compared to the CLASSIC STOP-LOSS EA.
The tests are done on M1 timeframe.
RSI STOP-LOSS EA ENTRY DATA
| Expert: | MACD_Smart_Stoploss | |||||||||||
| Symbol: | Volatility 10 Index | |||||||||||
| Period: | M1 (2021.07.01 - 2021.07.15) | |||||||||||
| Inputs: | afi=0 | |||||||||||
| risk=0.05 | ||||||||||||
| atrValue=20 | ||||||||||||
| rsi=14 | ||||||||||||
| ai=0 | ||||||||||||
| movAvgTrend=200 | ||||||||||||
| movAvgDirection=50 | ||||||||||||
| i=0 | ||||||||||||
| fast=12 | ||||||||||||
| slow=26 | ||||||||||||
| signal=9 | ||||||||||||
| Broker: | Deriv Limited | |||||||||||
| Currency: | USD | |||||||||||
| Initial Deposit: | 500.00 | |||||||||||
| Leverage: | 1:500 | |||||||||||
CLASSIC STOP-LOSS EA ENTRY DATA
| Expert: | MACD_Cross_Stoploss | |||||||||||
| Symbol: | Volatility 10 Index | |||||||||||
| Period: | M1 (2021.07.01 - 2021.07.15) | |||||||||||
| Inputs: | afi=0 | |||||||||||
| risk=0.05 | ||||||||||||
| atrValue=5 | ||||||||||||
| ai=0 | ||||||||||||
| movAvgTrend=200 | ||||||||||||
| movAvgDirection=50 | ||||||||||||
| i=0 | ||||||||||||
| fast=12 | ||||||||||||
| slow=26 | ||||||||||||
| signal=9 risk reward=1:2 | ||||||||||||
| Broker: | Deriv Limited | |||||||||||
| Currency: | USD | |||||||||||
| Initial Deposit: | 500.00 | |||||||||||
| Leverage: | 1:50 | |||||||||||
RESULTS
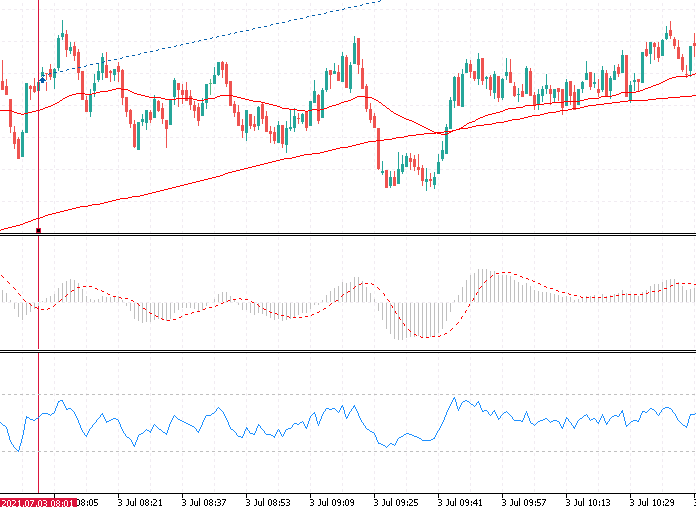
Graphical representation of trades carried out by both EAs will be displayed below. A total of 3 trade samples were taken from each.
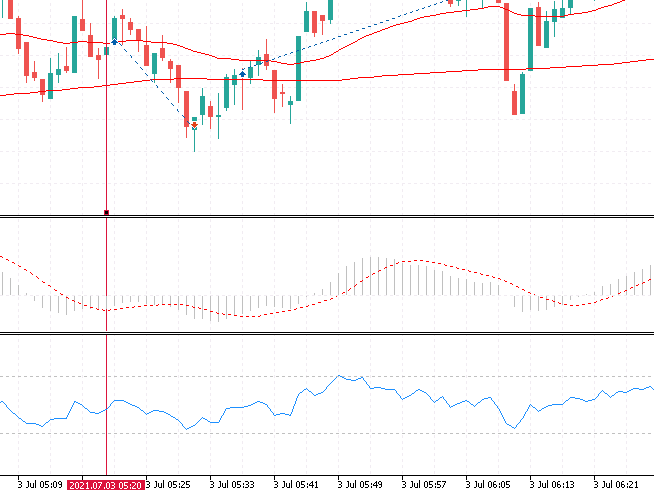
Fig 3.1. Sample 1 from RSI STOP-LOSS EA
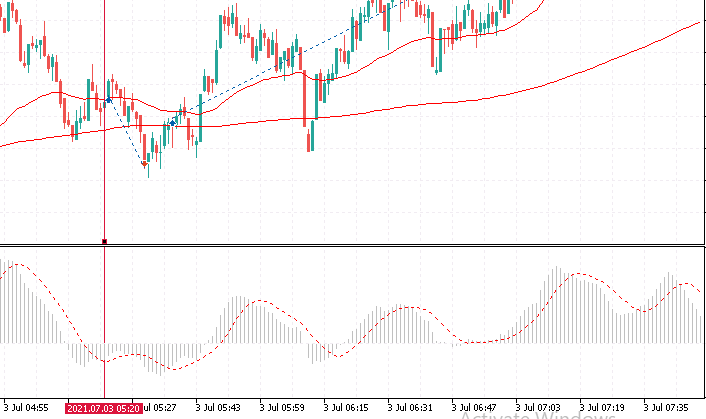
Fig 3.1a. Sample 1 from CLASSIC STOP-LOSS EA
Fig 3.2. Sample 2 from RSI STOP-LOSS EA
Fig 3.2a. Sample 2 from CLASSIC STOP-LOSS EA
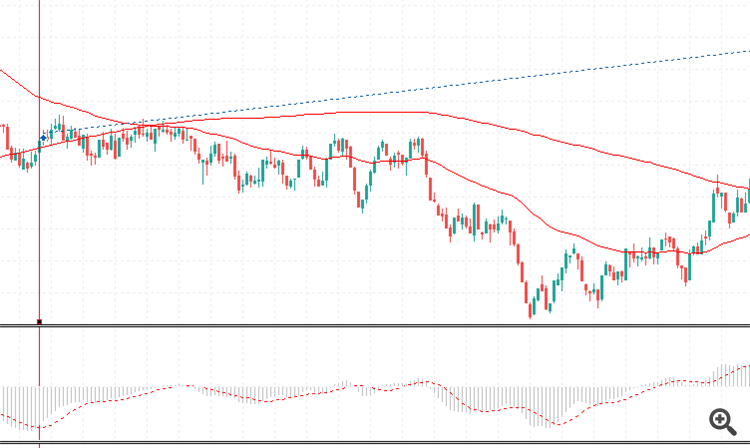
Fig 3.3. Sample 3 from RSI STOP-LOSS EA
Fig 3.3a. Sample 3 from CLASSIC STOP-LOSS EA
From the above comparison, it can be observed that the RSI STOP-LOSS EA did a great job at avoiding being hunted by the market compared to the classic Stop-Loss set on the price Action Chart.
Profitability test
Now is it the time to ask the big question "Is this profitable?". Since the RSI STOP-LOSS EA did a great job at avoiding stop loss hunt, then it must be profitable and also have a higher win-rate because few stop-losses would be triggered compared to the classical stop-loss method. Logically this could be true. But to prove this theory a test must be conducted.
Similar data from the above test would be used for both tests. A back-test on both EA of above 100 trades would be carried out on M1 timeframe. Below are the results.
RSI STOP-LOSS EA RESULTS
Results | ||||||||||||
| History Quality: | 100% | |||||||||||
| Bars: | 20160 | Ticks: | 603385 | Symbols: | 1 | |||||||
| Total Net Profit: | 327.71 | Balance Drawdown Absolute: | 288.96 | Equity Drawdown Absolute: | 367.85 | |||||||
| Gross Profit: | 3 525.74 | Balance Drawdown Maximal: | 483.90 (69.63%) | Equity Drawdown Maximal: | 523.24 (71.95%) | |||||||
| Gross Loss: | -3 198.03 | Balance Drawdown Relative: | 69.63% (483.90) | Equity Drawdown Relative: | 73.65% (369.45) | |||||||
| Profit Factor: | 1.10 | Expected Payoff: | 1.76 | Margin Level: | 317.21% | |||||||
| Recovery Factor: | 0.63 | Sharpe Ratio: | 0.08 | Z-Score: | 1.68 (90.70%) | |||||||
| AHPR: | 1.0070 (0.70%) | LR Correlation: | 0.51 | OnTester result: | 0 | |||||||
| GHPR: | 1.0027 (0.27%) | LR Standard Error: | 134.83 | |||||||||
| Total Trades: | 186 | Short Trades (won %): | 94 (42.55%) | Long Trades (won %): | 92 (38.04%) | |||||||
| Total Deals: | 372 | Profit Trades (% of total): | 75 (40.32%) | Loss Trades (% of total): | 111 (59.68%) | |||||||
| Largest profit trade: | 85.26 | Largest loss trade: | -264.99 | |||||||||
| Average profit trade: | 47.01 | Average loss trade: | -28.81 | |||||||||
| Maximum consecutive wins ($): | 5 (350.60) | Maximum consecutive losses ($): | 6 (-255.81) | |||||||||
| Maximal consecutive profit (count): | 350.60 (5) | Maximal consecutive loss (count): | -413.34 (5) | |||||||||
| Average consecutive wins: | 2 | Average consecutive losses: | 2 | |||||||||
Fig 3.4 Equity curve for RSI Stop-loss EA
CLASSIC STOP-LOSS EA RESULTS
Results | ||||||||||||
| History Quality: | 100% | |||||||||||
| Bars: | 20160 | Ticks: | 603385 | Symbols: | 1 | |||||||
| Total Net Profit: | 3 672.06 | Balance Drawdown Absolute: | 215.45 | Equity Drawdown Absolute: | 217.30 | |||||||
| Gross Profit: | 10 635.21 | Balance Drawdown Maximal: | 829.54 (19.27%) | Equity Drawdown Maximal: | 1 159.20 (25.59%) | |||||||
| Gross Loss: | -6 963.15 | Balance Drawdown Relative: | 48.76% (270.82) | Equity Drawdown Relative: | 51.81% (303.90) | |||||||
| Profit Factor: | 1.53 | Expected Payoff: | 15.97 | Margin Level: | 274.21% | |||||||
| Recovery Factor: | 3.17 | Sharpe Ratio: | 0.16 | Z-Score: | -0.14 (11.13%) | |||||||
| AHPR: | 1.0120 (1.20%) | LR Correlation: | 0.80 | OnTester result: | 0 | |||||||
| GHPR: | 1.0093 (0.93%) | LR Standard Error: | 545.00 | |||||||||
| Total Trades: | 230 | Short Trades (won %): | 107 (44.86%) | Long Trades (won %): | 123 (38.21%) | |||||||
| Total Deals: | 460 | Profit Trades (% of total): | 95 (41.30%) | Loss Trades (% of total): | 135 (58.70%) | |||||||
| Largest profit trade: | 392.11 | Largest loss trade: | -219.95 | |||||||||
| Average profit trade: | 111.95 | Average loss trade: | -51.58 | |||||||||
| Maximum consecutive wins ($): | 6 (1 134.53) | Maximum consecutive losses ($): | 9 (-211.43) | |||||||||
| Maximal consecutive profit (count): | 1 134.53 (6) | Maximal consecutive loss (count): | -809.21 (4) | |||||||||
| Average consecutive wins: | 2 | Average consecutive losses: | 2 | |||||||||
Fig 3.5. Equity curve for Classic Stop loss EA
Observation
Although both EAs were profitable at the end of the trading period, it was observed that the first EA (RSI Stop-Loss EA) had fewer losses in which some are huge losses.Fig 3.6. Equity curve Loses
These losses might affect the overall profitability of the EA and also proper money management. On the other hand, the classic Stop loss EA had more losses and also made the most money at the end of the trading period.
Conclusion and recommendation
Money Management is indeed the holy grail of trading. From the above experiment, the EA in which money management was fully implemented made the most profit with more loss. This is because of trade consistency. However, defining stop loss at the RSI does not fully give the same consistency for the first EA (RSI STOP-LOSS) as the risk amount varies.
Recommendation
Hedging is one way of reducing the losses in the first (RSI STOP-LOSS) EA. This might give a more consistent risk amount and improve the profit in the long run.Thank you for reading!!!
 Using AutoIt With MQL5
 Use MQL5.community channels and group chats
- Free trading apps
- Over 8,000 signals for copying
- Economic news for exploring financial markets
You agree to website policy and terms of use


Contact the author please, I wouldn't know.
The position is calculated from the price action, where you intends adding the stoploss. Since rsi is similar to line price action chart, we used the rsi instead of the price action chart. Also you are right that's the major issue with the strategy
hello dude.did you see my comments?whats the problem?
hello dude.did you see my comments?whats the problem?
To be able to use the bot on other pairs like the EURUSD pair you would need to multiply by 10,000 because 1 pip of the pair is 0.0001
theLotsize = NormalizeDouble((Balance*risk)/((MathAbs(Ask-((stoplossforBuy(20)-atr[1])))*10000)*pipValue),2);
below works for all pairs with pip value of 0.0001
for pip value of 0.01 thats JPY pairs you multiply by 100.
note the code is for mt5 only
Thank you