
Applying OLAP in trading (part 4): Quantitative and visual analysis of tester reports
In this article, we continue considering OLAP (On-Line Analytical Processing) and its applicability in trading.
In earlier articles, we discussed general techniques for constructing classes that accumulated and analyzed multidimensional arrays, as well as we dealt with the visualization of analysis results in the graphical interface. From the point of view of application, the first two articles dealt with trading reports obtained in various ways: from a strategy tester, from the online trading history, from HTML and CSV files (including MQL5 trading signals). After a slight code refactoring in the third article, OLAP was used for the analysis of quotes and for developing trading strategies. Please read the previous articles, in order to be able to understand the new material (check out the brackets to see what you should pay special attention to):
- Part 1: Basis of online analysis of multidimensional data (selectors, aggregators, hypercube calculation, adapters for reading trade records from the account history, from HTML files and from CSV filed)
- Part 2: Visualizing the interactive multidimensional data analysis results (rubber windows and controls, OLAP GUI design and operating principles)
- Part 3: Analyzing quotes for the development of trading strategies (the OLAP engine class, new selectors and aggregator, implementing an adapter and records for another application area (quotes) while maintaining a unified approach, which will be used in this article)
In this article, we are going to expand the OLAP scope by analyzing MetaTrader 5 optimization results.
To be able to execute this project, we first need to improve the graphical user interface that was earlier considered in Part 2. All code improvements performed in part 3 concerned directly the OLAP engine. However, no relevant visualization upgrade was performed. That is what we will work on, using the OLAPGUI trade report analyzer from the second article as a test task within the current article. We will also unify this graphical part so that it can be easily applied for any other new application area, in particular for the planned analyzer of optimization results.
On application graphics
The center of the GUI for OLAP is the specially developed CGraphicInPlot visual component. Its first implementation presented in article 2 had some disadvantages. These included display of labels on axes. We managed to display the names of selector cells (such as the names of the days of the week or the names of currencies) on the horizontal X axis, when necessary. However, in all other cases the numbers are displayed "as is" which is not always user friendly. Another customization is needed for the Y axis which usually shows aggregated values. Depending on the settings, it can display selector values, that's where the improvement is in need. An example of bad display of methods is the request of average position holding time for a symbol.
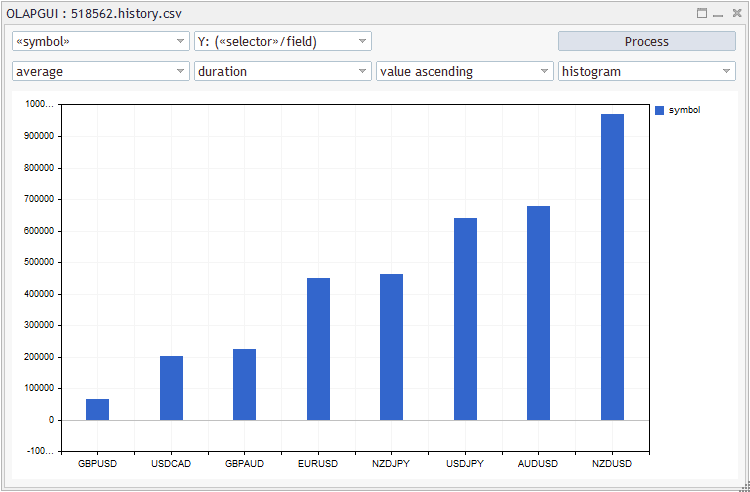
Average position lifetime by symbols (seconds)
Because Y shows not a selector (in which values are rounded till cube cell size) but an aggregate duration value in seconds, such large numbers are hard to perceive. To solve this problem, let us try to divide seconds by the duration of the current timeframe bar. In this case, the values will represent the number of bars. To do this, we need to pass a certain flag to the CGraphicInPlot class and further to the axes handling class CAxis. Flags changing the operating mode can be numerous. Therefore, reserve for them a special new class entitled AxisCustomizer in file Plot.mqh.
  class AxisCustomizer
  {
    public:
      const CGraphicInPlot *parent;
      const bool y; // true for Y, false for X
      const bool periodDivider;
      const bool hide;
      AxisCustomizer(const CGraphicInPlot *p, const bool axisY,
        const bool pd = false, const bool h = false):
        parent(p), y(axisY), periodDivider(pd), hide(h) {}
  };
Potentially, various label display features can be added to the class. But, at moment, it only stores the sign of the axis type (X or Y) and a few logical options, such as periodDivider and 'hide'. The first option means that values should be divided by PeriodSeconds(). The second option will be considered later.
The objects of this class get into CGraphicInPlot via special methods:
  class CGraphicInPlot: public CGraphic
  {
    ...
      void InitAxes(CAxis &axe, const AxisCustomizer *custom = NULL);
      void InitXAxis(const AxisCustomizer *custom = NULL);
      void InitYAxis(const AxisCustomizer *custom = NULL);
  };

  void CGraphicInPlot::InitAxes(CAxis &axe, const AxisCustomizer *custom = NULL)
  {
    if(custom)
    {
      axe.Type(AXIS_TYPE_CUSTOM);
      axe.ValuesFunctionFormat(CustomDoubleToStringFunction);
      axe.ValuesFunctionFormatCBData((AxisCustomizer *)custom);
    }
    else
    {
      axe.Type(AXIS_TYPE_DOUBLE);
    }
  }

  void CGraphicInPlot::InitXAxis(const AxisCustomizer *custom = NULL)
  {
    InitAxes(m_x, custom);
  }

  void CGraphicInPlot::InitYAxis(const AxisCustomizer *custom = NULL)
  {
    InitAxes(m_y, custom);
  }
When such an object is not created and not passed to graphic classes, the standard library displays values in the usual way, as a number AXIS_TYPE_DOUBLE.
Here we use the standard library approach to customize labels on axes: the axis type is set equal to AXIS_TYPE_CUSTOM and a pointer to AxisCustomizer is passed via ValuesFunctionFormatCBData. Further it is passed by the CGraphic base class to the CustomDoubleToStringFunction label drawing function (it is set by the ValuesFunctionFormat call in the above code). Of course, we need the CustomDoubleToStringFunction function, which was implemented earlier in a simplified form, without the AxisCustomizer class objects (the CGraphicInPlot chart was acting as a setup object).
  string CustomDoubleToStringFunction(double value, void *ptr)
  {
    AxisCustomizer *custom = dynamic_cast<AxisCustomizer *>(ptr);
    if(custom == NULL) return NULL;

    // check options
    if(!custom.y && custom.hide) return NULL; // case of X axis and "no marks" mode

    // in simple cases return a string
    if(custom.y) return (string)(float)value;

    const CGraphicInPlot *self = custom.parent; // obtain actual object with cache
    if(self != NULL)
    {
      ... // retrieve selector mark for value
    }
  }
The AxisCustomizer customization objects are stored in the CPlot class, which is a GUI control (inherited from CWndClient) and a container for CGraphicInPlot:
  class CPlot: public CWndClient
  {
    private:
      CGraphicInPlot *m_graphic;
      ENUM_CURVE_TYPE type;

      AxisCustomizer *m_customX;
      AxisCustomizer *m_customY;
      ...

    public:
      void InitXAxis(const AxisCustomizer *custom = NULL)
      {
        if(CheckPointer(m_graphic) != POINTER_INVALID)
        {
          if(CheckPointer(m_customX) != POINTER_INVALID) delete m_customX;
          m_customX = (AxisCustomizer *)custom;
          m_graphic.InitXAxis(custom);
        }
      }
      ...
  };
Thus, axis settings in m_customX and m_customY object can be used not only at the stage of value formating in CustomDoubleToStringFunction, but they can be used much earlier, when data arrays are only passed to CPlot using one of the CurveAdd methods. For example:
  CCurve *CPlot::CurveAdd(const PairArray *data, const string name = NULL)
  {
    if(CheckPointer(m_customY) != POINTER_INVALID) && m_customY.periodDivider)
    {
      for(int i = 0; i < ArraySize(data.array); i++)
      {
        data.array[i].value /= PeriodSeconds();
      }
    }

    return m_graphic.CurveAdd(data, type, name);
  }
The code shows the use of the periodDivider option, which divides all values by PeriodSeconds(). This operation is performed before the standard library receives data and calculates the grid size for them. This step is important because after the grid has already been counted, it is too late to customize in the CustomDoubleToStringFunction function.
The caller code in the dialog must create and initialize AxisCustomizer object at the cube building time. For example:
  AGGREGATORS at = ...  // get aggregator type from GUI
  ENUM_FIELDS af = ...  // get aggregator field from GUI
  SORT_BY sb = ...      // get sorting mode from GUI

  int dimension = 0;    // calculate cube dimensions from GUI
  for(int i = 0; i < AXES_NUMBER; i++)
  {
    if(Selectors[i] != SELECTOR_NONE) dimension++;
  }

  bool hideMarksOnX = (dimension > 1 && SORT_VALUE(sb));

  AxisCustomizer *customX = NULL;
  AxisCustomizer *customY = NULL;

  customX = new AxisCustomizer(m_plot.getGraphic(), false, Selectors[0] == SELECTOR_DURATION, hideMarksOnX);
  if(af == FIELD_DURATION)
  {
    customY = new AxisCustomizer(m_plot.getGraphic(), true, true);
  }

  m_plot.InitXAxis(customX);
  m_plot.InitYAxis(customY);
Here m_plot is the dialog variable storing the CPlot control. The full code of the OLAPDialog::process method below shows how this is actually performed. Here is the above example with the periodDivider mode automatically enabled:
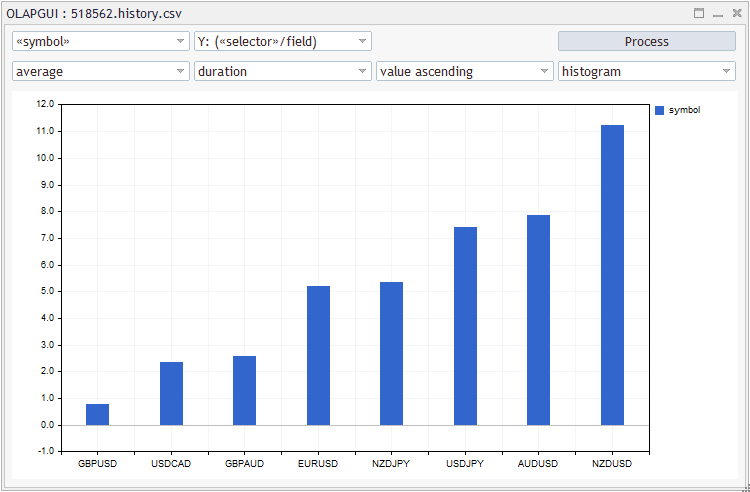
Average position lifetime by symbols (current timeframe bars, D1)
Another variable in AxisCustomizer, 'hide', provides the ability to completely hide labels along the X axis. This mode is needed when selecting sorting by a value in the multidimensional array. In this case, labels in each row have their own order and so there is nothing to display along the X axis. The multidimensional cube supports sorting, which can be used in other modes, in particular by labels.
The 'hide' option operates inside CustomDoubleToStringFunction. The standard behavior of this function implies the presence of selectors; the labels of selectors are cached for the X axis in the specialized CurveSubtitles classes, and they are returned to the chart by the grid division index. However, the set 'hide' flag terminates this process at the very beginning for any abscissa, and the function returns NULL (non-displayable value).
The second issue which needs to be fixed in the graphics is connected with the rendering of a histogram. When several rows (data vectors) are displayed in the chart, the histogram bars overlap each other and the largest of them can completely hide all others.
The CGraphic basic class has the virtual HistogramPlot method. It must be overridden so as to visually separate the columns. It would be good to have a custom field in the CCurve object, storing arbitrary data (the data would be interpreted by the client code as required). Unfortunately, such a field does not exist. Therefore, we will use one of the standard properties that has not been used in the current project. I chose LinesSmoothStep. Using the CCurve::LinesSmoothStep setter method, our caller code will write the sequence number to it. This code can be easily obtained by using the CCurve::LinesSmoothStep getter method in the new HistogramPlot implementation. Here is an example of how a row number is written in LinesSmoothStep:
  CCurve *CGraphicInPlot::CurveAdd(const double &x[], const double &y[], ENUM_CURVE_TYPE type, const string name = NULL)
  {
    CCurve *c = CGraphic::CurveAdd(x, y, type, name);
    c.LinesSmoothStep((int)CGraphic::CurvesTotal());    // +
    ...
    return CacheIt(c);
  }
Knowing the total number of rows and the number of the current one, you can shift each of its points slightly to the left or to the write when rendering. Here is an adapted version of HistogramPlot. The updated lines ate marked with a comment with "*"; newly added lines are marked with "+".
  void CGraphicInPlot::HistogramPlot(CCurve *curve) override
  {
      const int size = curve.Size();
      const double offset = curve.LinesSmoothStep() - 1;                   // +
      double x[], y[];

      int histogram_width = curve.HistogramWidth();
      if(histogram_width <= 0) return;

      curve.GetX(x);
      curve.GetY(y);

      if(ArraySize(x) == 0 || ArraySize(y) == 0) return;

      const int w = m_width / size / 2 / CGraphic::CurvesTotal();          // +
      const int t = CGraphic::CurvesTotal() / 2;                           // +
      const int half = ((CGraphic::CurvesTotal() + 1) % 2) * (w / 2);      // +

      int originalY = m_height - m_down;
      int yc0 = ScaleY(0.0);

      uint clr = curve.Color();

      for(int i = 0; i < size; i++)
      {
        if(!MathIsValidNumber(x[i]) || !MathIsValidNumber(y[i])) continue;
        int xc = ScaleX(x[i]);
        int yc = ScaleY(y[i]);
        int xc1 = xc - histogram_width / 2 + (int)(offset - t) * w + half; // *
        int xc2 = xc + histogram_width / 2 + (int)(offset - t) * w + half; // *
        int yc1 = yc;
        int yc2 = (originalY > yc0 && yc0 > 0) ? yc0 : originalY;

        if(yc1 > yc2) yc2++;
        else yc2--;

        m_canvas.FillRectangle(xc1,yc1,xc2,yc2,clr);
      }
  }
Soon we will check how this looks like.
Another annoying moment is connected with the standard implementation of the display of lines. If data have a non-numeric value, CGraphic breaks the line. This is bad for our task, as some of the cube cells may not contain data, and aggregators write NaN to such cells. Some cubes, such as for example the cumulative balance total in several sections, would have a bad display, as the value in each deal is only changed in one section. To view the negative impact of broken lines, check out the figure "Balance curves for each symbol separately" in article 2.
To fix this issue, the LinesPlot method was additionally redefined (see source codes, file Plot.mqh). The operation result is shown below, in section related to the processing of tester's standard files.
Finally, the last graphics problem relates to the definition of zero axes in the Standard Library. Zeros are searched in the CGraphic::CreateGrid method in the following trivial way (shows a case for Y; the X axis is processed in the same way):
  if(StringToDouble(m_yvalues[i]) == 0.0)
  ...
Note that m_yvalues are string labels. Obviously, any label that does not contain a number will produce 0. This happens even if the AXIS_TYPE_CUSTOM display mode us set for a chart. As a result, in charts by values, days of the week, types of deals and other selectors, all values are treated as zero when they are checked in a loop throughout the grid. However, the final value depends on the last sample, which is shown in a bolder line (although it is not zero). Furthermore, as each sample becomes a candidate for 0 (even if temporarily), it skips the rendering of a simple grid line, due to which the whole grid disappears.
Since the CreateGrid method is also virtual, we will redefine it with a more intelligent check for 0. This check is implemented as an auxiliary isZero function.
  bool CGraphicInPlot::isZero(const string &value)
  {
    if(value == NULL) return false;
    double y = StringToDouble(value);
    if(y != 0.0) return false;
    string temp = value;
    StringReplace(temp, "0", "");
    ushort c = StringGetCharacter(temp, 0);
    return c == 0 || c == '.';
  }

  void CGraphicInPlot::CreateGrid(void) override
  {
    int xc0 = -1.0;
    int yc0 = -1.0;
    for(int i = 1; i < m_ysize - 1; i++)
    {
      m_canvas.LineHorizontal(m_left + 1, m_width - m_right, m_yc[i], m_grid.clr_line);     // *
      if(isZero(m_yvalues[i])) yc0 = m_yc[i];                                               // *

      for(int j = 1; j < m_xsize - 1; j++)
      {
        if(i == 1)
        {
          m_canvas.LineVertical(m_xc[j], m_height - m_down - 1, m_up + 1, m_grid.clr_line); // *
          if(isZero(m_xvalues[j])) xc0 = m_xc[j];                                           // *
        }

        if(m_grid.has_circle)
        {
          m_canvas.FillCircle(m_xc[j], m_yc[i], m_grid.r_circle, m_grid.clr_circle);
          m_canvas.CircleWu(m_xc[j], m_yc[i], m_grid.r_circle, m_grid.clr_circle);
        }
      }
    }

    if(yc0 > 0) m_canvas.LineHorizontal(m_left + 1, m_width - m_right, yc0, m_grid.clr_axis_line);
    if(xc0 > 0) m_canvas.LineVertical(xc0, m_height - m_down - 1, m_up + 1, m_grid.clr_axis_line);
  }
OLAP GUI
We have implemented the required fixes in graphics. Now, let's revise the window interface and make it universal. In the non-trading EA OLAPGUI from the second article, operations with the dialog were implemented in the OLAPGUI.mqh header file. It stored a lot of applied features of the previous task, the analysis of trading reports. Since we are going to use the same dialog for arbitrary data, we need to split the file into 2 part: one will implement the general interface behavior, the other one will have settings of a specific project.
Rename the ex OLAPDialog class into OLAPDialogBase. The hard coded statistical arrays 'selectors', 'settings', 'defaults', which actually describe the dialog controls, will be empty dynamic templates, which then will be filled by derived classes. Variables:
    OLAPWrapper *olapcore;    // <-- template <typename S,typename T> class OLAPEngine, since part 3
    OLAPDisplay *olapdisplay;
will also become inherited, because they need to be standardizes by types of selectors and record fields, which are defined in the application part of each OLAP engine. Remember, the old OLAPWrapper class was converted into the OLAPEngine<S,T> template class during refactoring in article 3.
Two new abstract methods are reserved for the main logic:
  virtual void setup() = 0;
  virtual int process() = 0;
The first one, setup, configures the interface: the second one, process, launches the analysis. The setup is called from OLAPDialogBase::Create
  bool OLAPDialogBase::Create(const long chart, const string name, const int subwin, const int x1, const int y1, const int x2, const int y2)
  {
    setup(); // +
    ...
  }
The user initiates the analysis launch by clicking the button, therefore the OLAPDialogBase::OnClickButton method has undergone the most alteration: most of the code has been removed from it and the corresponding functionality (reading control properties and launching the OLAP engine based on them) has been delegated to that 'process' method.
  void OLAPDialogBase::OnClickButton(void)
  {
    if(processing) return; // prevent re-entrancy

    if(browsing)           // 3D-cube browsing support
    {
      currentZ = (currentZ + 1) % maxZ;
      validateZ();
    }

    processing = true;
    const int n = process();
    if(n == 0 && processing)
    {
      finalize();
    }
  }
Please note that the OLAPDialogBase class implements the entire operation interface logic, starting with the creation of controls and up to the processing of events that affect the state of the controls. However it knows nothing about the contents of controls.
The OLAPDisplay class implements the Display virtual interface from OLAPCommon.mqh (was discussed in article 3). As we know, the Display interface is a callback from the OLAP kernel which aims at providing the analysis results (passed in the first parameter, in the MetaCube class object). The pointer to the 'parent' window in the OLAPDisplay class enables the organizing of a chain for further passing of the cube data to the dialog (this forwarding is needed because MQL5 does not provide multiple inheritance).
  class OLAPDisplay: public Display
  {
    private:
      OLAPDialogBase *parent;

    public:
      OLAPDisplay(OLAPDialogBase *ptr,): parent(ptr) {}
      virtual void display(MetaCube *metaData, const SORT_BY sortby = SORT_BY_NONE, const bool identity = false) override;
  };
Here, I will mention a specific feature related to the obtaining of real names of custom fields from derived adapter classes. Previously, we were adding our custom fields (such as MFE and MAE) to standard fields in the second part. Thus, they were known in advance and were build into the code. However, when working with optimization reports, we will need to analyze them in terms of EA's input parameters, while these parameters (their names) can only be obtained from analyzed data.
The adapter passes the names of custom fields to the aggregator (metacube) using the new assignCustomFields method. This is always done "behind the the scene", i.e. automatically in the Analyst::acquireData method. Due to this, when the metaData.getDimensionTitle method is called inside OLAPDisplay::display on order to obtain section designations long the axes, and when the ordinal number of the field n exceeds the capacity of the built-in field enumeration, we know that we are dealing with an extended field and can request a description from the cube. The general structure of the OLAPDisplay::display method has not changed. You can check it out by comparing the below source code with the code from article 2.
In addition, the names of custom fields must be known in advance in the dialog in order to fill in the interface elements. For this purpose, the OLAPDialogBase class includes a new setCustomFields method for setting custom fields.
    int customFieldCount;
    string customFields[];

    virtual void setCustomFields(const DataAdapter &adapter)
    {
      string names[];
      if(adapter.getCustomFields(names) > 0)
      {
        customFieldCount = ArrayCopy(customFields, names);
      }
    }
Of course, we need to bind the dialog and the adapter in the test EA using this method (See below). After that, meaningful field names (instead of numbered 'custom 1' and so on) will become visible in dialog controls. This is a temporary solution. This aspect, among others, needs further code optimization. But they are considered insignificant within this article.
The application part of the interface setup in the modified OLAPGUI was "moved" from OLAPGUI.mqh to the OLAPGUI_Trades.mqh header file. The dialog class name has not changed: OLAPDialog. However, it depends on template parameters, which are then used to specialize the OLAPEngine object:
  template<typename S, typename F>
  class OLAPDialog: public OLAPDialogBase
  {
    private:
      OLAPEngine<S,F> *olapcore;
      OLAPDisplay *olapdisplay;

    public:
      OLAPDialog(OLAPEngine<S,F> &olapimpl);
      ~OLAPDialog(void);
      virtual int process() override;
      virtual void setup() override;
  };

  template<typename S, typename F>
  OLAPDialog::OLAPDialog(OLAPEngine<S,F> &olapimpl)
  {
    curveType = CURVE_POINTS;
    olapcore = &olapimpl;
    olapdisplay = new OLAPDisplay(&this);
  }

  template<typename S, typename F>
  OLAPDialog::~OLAPDialog(void)
  {
    delete olapdisplay;
  }
All work is performed in methods 'setup' and 'process'. The 'setup' method fills the 'settings', 'selectors', 'defaults' arrays with the same values, which are already known to us from the second article (the interface appearance does not change). The 'process' method launches analysis in the specified section and is almost fully the same as the previous handler OnClickButton.
  template<typename S, typename F>
  int OLAPDialog::process() override
  {
    SELECTORS Selectors[4];
    ENUM_FIELDS Fields[4];
    AGGREGATORS at = (AGGREGATORS)m_algo[0].Value();
    ENUM_FIELDS af = (ENUM_FIELDS)(AGGREGATORS)m_algo[1].Value();
    SORT_BY sb = (SORT_BY)m_algo[2].Value();

    ArrayInitialize(Selectors, SELECTOR_NONE);
    ArrayInitialize(Fields, FIELD_NONE);

    int matches[10] = // selectors in combo-boxes (specific record fields are bound internally)
    {
      SELECTOR_NONE, SELECTOR_SERIAL, SELECTOR_SYMBOL, SELECTOR_TYPE, SELECTOR_MAGIC,
      SELECTOR_WEEKDAY, SELECTOR_WEEKDAY, SELECTOR_DAYHOUR, SELECTOR_DAYHOUR, SELECTOR_DURATION
    };

    int subfields[] = // record fields listed in combo-boxes after selectors and accessible directly
    {
      FIELD_LOT, FIELD_PROFIT_AMOUNT, FIELD_PROFIT_PERCENT, FIELD_PROFIT_POINT,
      FIELD_COMMISSION, FIELD_SWAP, FIELD_CUSTOM_1, FIELD_CUSTOM_2
    };

    for(int i = 0; i < AXES_NUMBER; i++) // up to 3 orthogonal axes are supported
    {
      if(!m_axis[i].IsVisible()) continue;
      int v = (int)m_axis[i].Value();
      if(v < 10) // selectors (every one is specialized for a field already)
      {
        Selectors[i] = (SELECTORS)matches[v];
        if(v == 5 || v == 7) Fields[i] = FIELD_OPEN_DATETIME;
        else if(v == 6 || v == 8) Fields[i] = FIELD_CLOSE_DATETIME;
      }
      else // pure fields
      {
        Selectors[i] = at == AGGREGATOR_IDENTITY ? SELECTOR_SCALAR : SELECTOR_QUANTS;
        Fields[i] = (TRADE_RECORD_FIELDS)subfields[v - 10];
      }
    }

    m_plot.CurvesRemoveAll();
    AxisCustomizer *customX = NULL;
    AxisCustomizer *customY = NULL;

    if(at == AGGREGATOR_IDENTITY || at == AGGREGATOR_COUNT) af = FIELD_NONE;

    if(at != AGGREGATOR_PROGRESSIVE)
    {
      customX = new AxisCustomizer(m_plot.getGraphic(), false, Selectors[0] == SELECTOR_DURATION, (dimension > 1 && SORT_VALUE(sb)));
    }

    if((af == FIELD_DURATION)
    || (at == AGGREGATOR_IDENTITY && Selectors[1] == SELECTOR_DURATION))
    {
      customY = new AxisCustomizer(m_plot.getGraphic(), true, true);
    }

    m_plot.InitXAxis(customX);
    m_plot.InitYAxis(customY);
    m_button_ok.Text("Processing...");
    return olapcore.process(Selectors, Fields, at, af, olapdisplay, sb);
  }
The earlier described AxisCustomizer objects for setting up the axes are created at the end of the method. For both axes (X and Y), division by PeriodSeconds() is enabled when working with a duration field (either in the aggregator or in the selector if the aggregator type is AGGREGATOR_IDENTITY — in this case selectors do not distribute the contents of the fields among named cells, but the contents are delivered directly to the cube). The X axis is disabled when the cube dimension is greater than 1 and when sorting is selected.
Now, let's have a look at the OLAPGUI.mq5 program file. Among other differences from the previous version is the changed order of connection of header files. Earlier, adapters for reports were included in the core (because there were no other data sources). Now they should be explicitly written as HTMLcube.mqh and CSVcube.mqh. Further, in the OnInit code, the appropriate adapter type is prepared depending on the input data, and then the adapter is passed to the engine by calling _defaultEngine.setAdapter. This code part was already used in the OLAPRPRT.mq5 program from article 3, where we tested the correct approach with the decomposition into universal and applied parts. Though, OLAPRPRT did not have a graphical interface in the previous part. Let's fix this flaw now.
To demonstrate the strict separation of standard and custom fields, the CustomTradeRecord class calculating MFE and MAE fields was moved from OLAPTrades.mqh into OLAPTradesCustom.mqh (its code is attached). Thus we can simplify the development of other custom fields based on deals, if such are needed. Simply change the algorithm in OLAPTradesCustom.mqh while the OLAP kernel does not change. All standard components, such as trading record fields, connected selectors, the TradeRecord base class, the OLAPEngineTrade engine and the adapter for the history stay in OLAPTrades.mqh. OLAPTradesCustom.mqh has a link to OLAPTrades.mqh, which allows including all the above into the project.
  #include <OLAP/OLAPTradesCustom.mqh> // internally includes OLAPTrades.mqh
  #include <OLAP/HTMLcube.mqh>
  #include <OLAP/CSVcube.mqh>
  #include <OLAP/GUI/OLAPGUI_trades.mqh>

  OLAPDialog<SELECTORS,ENUM_FIELDS> dialog(_defaultEngine);

  int OnInit()
  {
    if(ReportFile == "")
    {
      Print("Analyzing account history");
      _defaultEngine.setAdapter(&_defaultHistoryAdapter);
    }
    else
    {
      if(StringFind(ReportFile, ".htm") > 0 && _defaultHTMLReportAdapter.load(ReportFile))
      {
        _defaultEngine.setAdapter(&_defaultHTMLReportAdapter);
      }
      else
      if(StringFind(ReportFile, ".csv") > 0 && _defaultCSVReportAdapter.load(ReportFile))
      {
        _defaultEngine.setAdapter(&_defaultCSVReportAdapter);
      }
      else
      {
        Print("Unknown file format: ", ReportFile);
        return INIT_PARAMETERS_INCORRECT;
      }
    }

    ...

    if(!dialog.Create(0, "OLAPGUI" + (ReportFile != "" ? " : " + ReportFile : ""), 0,  0, 0, 750, 560)) return INIT_FAILED;

    if(!dialog.Run()) return INIT_FAILED;
    return INIT_SUCCEEDED;
  }
Launch the updated OLAPGUI.mq5 and build several data sections to make sure that the new principle for dynamic enabling of kernel dependence on applied adapters and on record types works properly. We will also check the visual effect of the changes.
You can compare the below results with screenshots from article 2. Below is the Dependence of 'Profit' and 'Duration' fields for each deal. Now, the duration along the X axis is expressed in current timeframe bars (here D1) and not in seconds.
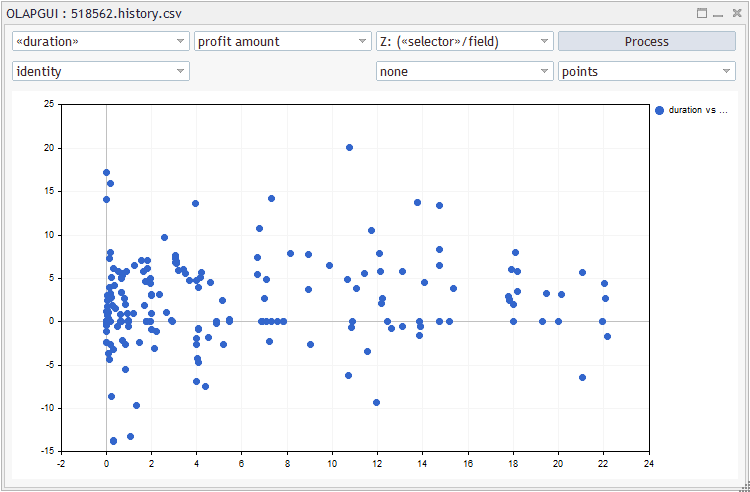
Dependence of profit on the duration (in current timeframe bars, D1)
The breakdown of profits by symbols and days of the week shows the histogram bars that are spread apart and the correct grid.
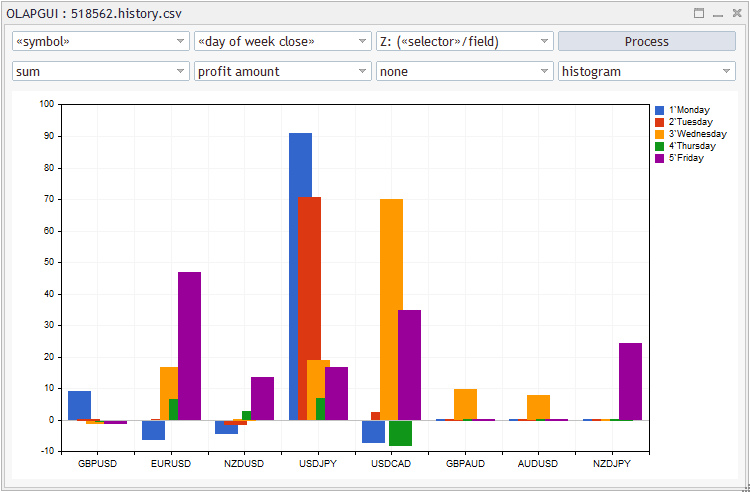
Profits by symbols and days of the week
Profit analysis by lot size in deals is shown in the below screenshot. Unlike article 2, lot values are displayed directly on the X axis instead of the log.
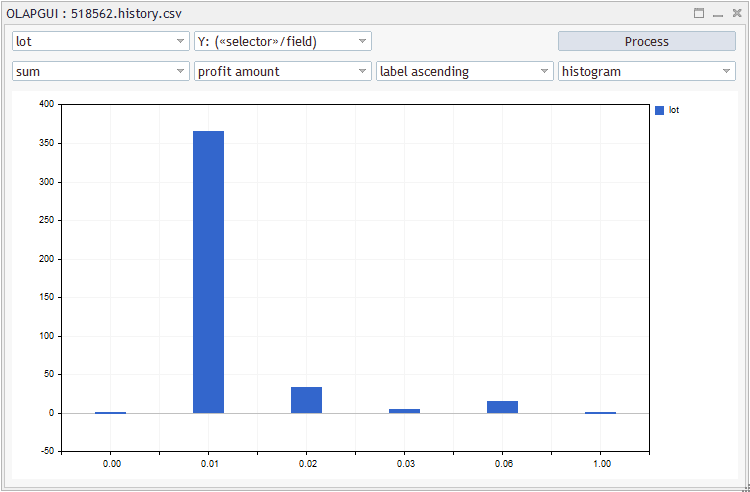
Profits by lot size
The last option is "Number of deals by symbols and types" In the previous version, lines were used because histograms were overlapping. The issue is no longer relevant.
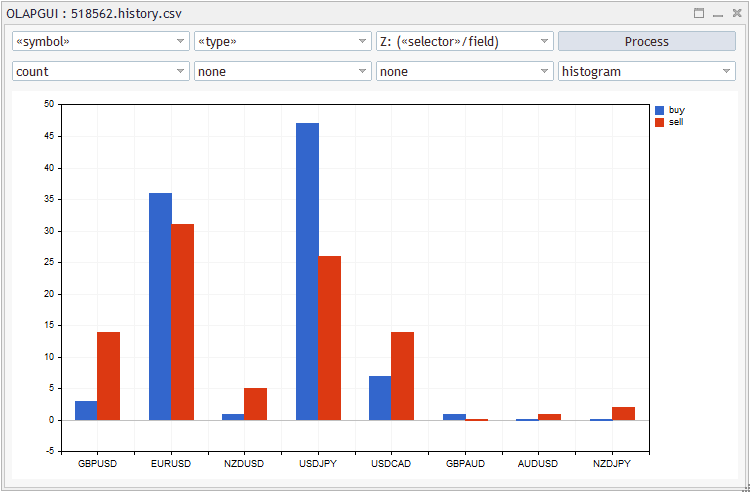
The number of deals by symbols and types (histogram)
We have considered all elements related to the analysis of trading reports. Another thing worth mentioning is a new data source which has become available to MQL programmers, tst files in internal tester format.
Connecting standard tester files (*.tst)
MetaTrader 5 developers recently opened the file formats saved by the tester. In particular, data on a single pass, which we could analyze only after exporting to an HTML report, is now available for reading directly from a tst file.
We will not go deep into details regarding the internal structure of the file. Instead, let's use a ready library for reading tst files - SingleTesterCache by fxsaber. By using it on the "black box" basis, it is easy to get an array of records of deals. The deal is presented in the library by the TradeDeal class. To obtain the list of deals, connect the library, create the main class object SINGLETESTERCACHE and load the required file using the 'load' method.
  #include <fxsaber/SingleTesterCache/SingleTesterCache.mqh>
  ...
  SINGLETESTERCACHE SingleTesterCache;
  if(SingleTesterCache.Load(file))
  {
    Print("Tester cache import: ", ArraySize(SingleTesterCache.Deals), " deals");
  }
The SingleTesterCache.Deals array contains all deals. Data of each deal existing in the tester is also available in appropriate fields.
The algorithm generating trade positions based on deals is exactly the same as when importing the HTML report. A good OOP style requires to implement common code parts in a base class and then to inherit HTMLReportAdapter and the TesterReportAdapter from it.
The common ancestor of reports is the BaseReportAdapter class (file ReportCubeBase.mqh). You can compare this file in a context with the old HTMLcube.mqh class to see for yourself that there are very few differences (except for new class names). The main thing that catches the eye is the minimalist content of the 'load' method. It acts now as a virtual stub:
    virtual bool load(const string file)
    {
      reset();
      TradeRecord::reset();
      return false;
    }
Child methods must override this method.
Code in the 'generate' method has also changed. This method converts deals into positions. Now, a virtual empty "stub" fillDealsArray is called at the beginning of this method.
    virtual bool fillDealsArray() = 0;

    int generate()
    {
      ...
      if(!fillDealsArray()) return 0;
      ...
    }
Part of the existing code for working with HTML reports have been moved to new virtual method in the HTMLReportAdapter class. Pleas note: the whole HTMLReportAdapter class is presented below. The main code part is in the base class, so here it is only necessary to define 2 virtual methods.
  template<typename T>
  class HTMLReportAdapter: public BaseReportAdapter<T>
  {
    protected:
      IndexMap *data;

      virtual bool fillDealsArray() override
      {
        for(int i = 0; i < data.getSize(); ++i)
        {
          IndexMap *row = data[i];
          if(CheckPointer(row) == POINTER_INVALID || row.getSize() != COLUMNS_COUNT) return false; // something is broken
          string s = row[COLUMN_SYMBOL].get<string>();
          StringTrimLeft(s);
          if(StringLen(s) > 0) // there is a symbol -> this is a deal
          {
            array << new Deal(row);
          }
          else if(row[COLUMN_TYPE].get<string>() == "balance")
          {
            string t = row[COLUMN_PROFIT].get<string>();
            StringReplace(t, " ", "");
            balance += StringToDouble(t);
          }
        }
        return true;
      }

    public:
      ~HTMLReportAdapter()
      {
        if(CheckPointer(data) == POINTER_DYNAMIC) delete data;
      }

      virtual bool load(const string file) override
      {
        BaseReportAdapter<T>::load(file);
        if(CheckPointer(data) == POINTER_DYNAMIC) delete data;
        data = NULL;
        if(StringFind(file, ".htm") > 0)
        {
          data = HTMLConverter::convertReport2Map(file, true);
          if(data != NULL)
          {
            size = generate();
            Print(data.getSize(), " deals transferred to ", size, " trades");
          }
        }
        return data != NULL;
      }
  };
The code of both methods is familiar from the previous version, nothing has been changed.
Now let's look at the implementation of the new TesterReportAdapter adapter. First of all, I had to add the TesterDeal class derived from the Deal class defined in ReportCubeBase.mqh (Deal is an old class which was previously located in HTMLcube.mqh). TesterDeal has a constructor with the TradeDeal parameter, which is a deal from the SingleTesterCache library. Also, TesterDeal defines a couple of helper methods for converting type and deal direction enumerations to strings.
  class TesterDeal: public Deal
  {
    public:
      TesterDeal(const TradeDeal &td)
      {
        time = (datetime)td.time_create + TimeShift;
        price = td.price_open;
        string t = dealType(td.action);
        type = t == "buy" ? +1 : (t == "sell" ? -1 : 0);
        t = dealDir(td.entry);
        direction = 0;
        if(StringFind(t, "in") > -1) ++direction;
        if(StringFind(t, "out") > -1) --direction;
        volume = (double)td.volume;
        profit = td.profit;
        deal = (long)td.deal;
        order = (long)td.order;
        comment = td.comment[];
        symbol = td.symbol[];
        commission = td.commission;
        swap = td.storage;
      }

      static string dealType(const ENUM_DEAL_TYPE type)
      {
        return type == DEAL_TYPE_BUY ? "buy" : (type == DEAL_TYPE_SELL ? "sell" : "balance");
      }

      static string dealDir(const ENUM_DEAL_ENTRY entry)
      {
        string result = "";
        if(entry == DEAL_ENTRY_IN) result += "in";
        else if(entry == DEAL_ENTRY_OUT || entry == DEAL_ENTRY_OUT_BY) result += "out";
        else if(entry == DEAL_ENTRY_INOUT) result += "in out";
        return result;
      }
  };
The TesterReportAdapter class contains 'load' and fillDealsArray methods, as well as a pointer to the SINGLETESTERCACHE object, which is the main class of the SingleTesterCache library. This object loads a tst file by request. If successful, the method fills the Deals array, based on which the fillDealsArray array operates.
  template<typename T>
  class TesterReportAdapter: public BaseReportAdapter<T>
  {
    protected:
      SINGLETESTERCACHE *ptrSingleTesterCache;

      virtual bool fillDealsArray() override
      {
        for(int i = 0; i < ArraySize(ptrSingleTesterCache.Deals); i++)
        {
          if(TesterDeal::dealType(ptrSingleTesterCache.Deals[i].action) == "balance")
          {
            balance += ptrSingleTesterCache.Deals[i].profit;
          }
          else
          {
            array << new TesterDeal(ptrSingleTesterCache.Deals[i]);
          }
        }
        return true;
      }

    public:
      ~TesterReportAdapter()
      {
        if(CheckPointer(ptrSingleTesterCache) == POINTER_DYNAMIC) delete ptrSingleTesterCache;
      }

      virtual bool load(const string file) override
      {
        if(StringFind(file, ".tst") > 0)
        {
          // default cleanup
          BaseReportAdapter<T>::load(file);

          // specific cleanup
          if(CheckPointer(ptrSingleTesterCache) == POINTER_DYNAMIC) delete ptrSingleTesterCache;

          ptrSingleTesterCache = new SINGLETESTERCACHE();
          if(!ptrSingleTesterCache.Load(file))
          {
            delete ptrSingleTesterCache;
            ptrSingleTesterCache = NULL;
            return false;
          }
          size = generate();

          Print("Tester cache import: ", size, " trades from ", ArraySize(ptrSingleTesterCache.Deals), " deals");
        }
        return true;
      }
  };

  TesterReportAdapter<RECORD_CLASS> _defaultTSTReportAdapter;
A default adapter instance for the RECORD_CLASS template type is created at the end. Our project includes the OLAPTradesCustom.mqh file which defines the CustomTradeRecord custom record class. In this file, the class is defined by the preprocessor directive as the RECORD_CLASS macro. Thus, as soon as the new adapter is connected to the project and the user specifies a tst file in inputs, the adapter will start generating CustomTradeRecord class objects, for which the MFE and MAE custom fields will be automatically generated.
Let's see how the new adapter performs its tasks. Below is an example of balance curves by symbols from a tst file.
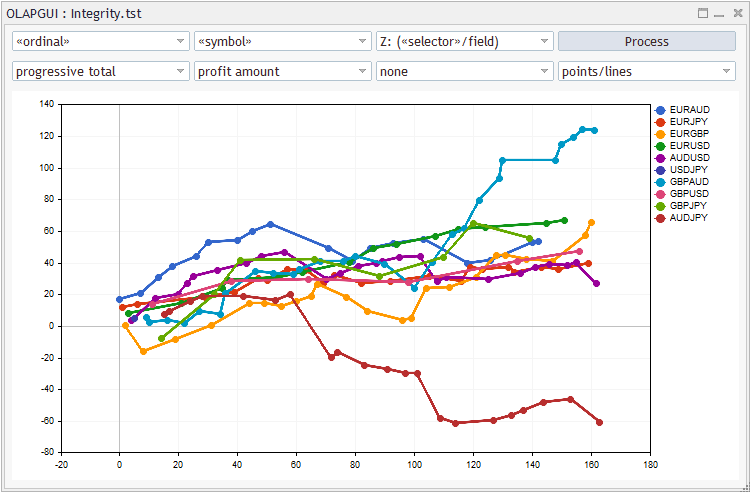
Balance curves by symbols
Pay attention that lines are uninterrupted, which means our CGraphicInPlot::LinesPlot implementation works correctly. When working with a "progressive" aggregator (cumulative), the first selector should always be the serial number (or index) of the records.
Tester optimization reports as an OLAP analysis application area
In addition to single test files, MetaQuotes now allows accessing opt files with the optimization cache. Such files can be read using the TesterCache library (again created by fxsaber). On the basis of this library we can easily create an application layer for the OLAP analysis of optimization results. What we need for this: record class with fields storing data of each optimizations pass, an adapter and selectors (optionally). We have the implementations of the components for other application areas, which allows using them as a guide (plan). Further, we will add a graphical interface (almost everything is ready, we only need to change the settings).
OLAPOpts.mqh file will be created, its purpose is similar to OLAPTrades.mqh. The TesterCache.mqh header file will be added to it.
#include <fxsaber/TesterCache/TesterCache.mqh>
Define an enumeration with all fields of the optimizer. I used fields from the ExpTradeSummary structure (it is located in fxsaber/TesterCache/ExpTradeSummary.mqh, the file is automatically connected to the library).
  enum OPT_CACHE_RECORD_FIELDS
  {
    FIELD_NONE,
    FIELD_INDEX,
    FIELD_PASS,

    FIELD_DEPOSIT,
    FIELD_WITHDRAWAL,
    FIELD_PROFIT,
    FIELD_GROSS_PROFIT,
    FIELD_GROSS_LOSS,
    FIELD_MAX_TRADE_PROFIT,
    FIELD_MAX_TRADE_LOSS,
    FIELD_LONGEST_SERIAL_PROFIT,
    FIELD_MAX_SERIAL_PROFIT,
    FIELD_LONGEST_SERIAL_LOSS,
    FIELD_MAX_SERIAL_LOSS,
    FIELD_MIN_BALANCE,
    FIELD_MAX_DRAWDOWN,
    FIELD_MAX_DRAWDOWN_PCT,
    FIELD_REL_DRAWDOWN,
    FIELD_REL_DRAWDOWN_PCT,
    FIELD_MIN_EQUITY,
    FIELD_MAX_DRAWDOWN_EQ,
    FIELD_MAX_DRAWDOWN_PCT_EQ,
    FIELD_REL_DRAWDOWN_EQ,
    FIELD_REL_DRAWDOWN_PCT_EQ,
    FIELD_EXPECTED_PAYOFF,
    FIELD_PROFIT_FACTOR,
    FIELD_RECOVERY_FACTOR,
    FIELD_SHARPE_RATIO,
    FIELD_MARGIN_LEVEL,
    FIELD_CUSTOM_FITNESS,

    FIELD_DEALS,
    FIELD_TRADES,
    FIELD_PROFIT_TRADES,
    FIELD_LOSS_TRADES,
    FIELD_LONG_TRADES,
    FIELD_SHORT_TRADES,
    FIELD_WIN_LONG_TRADES,
    FIELD_WIN_SHORT_TRADES,
    FIELD_LONGEST_WIN_CHAIN,
    FIELD_MAX_PROFIT_CHAIN,
    FIELD_LONGEST_LOSS_CHAIN,
    FIELD_MAX_LOSS_CHAIN,
    FIELD_AVERAGE_SERIAL_WIN_TRADES,
    FIELD_AVERAGE_SERIAL_LOSS_TRADES
  };

  #define OPT_CACHE_RECORD_FIELDS_LAST (FIELD_AVERAGE_SERIAL_LOSS_TRADES + 1)
The structure has all the usual variables, such as profit, balance and drawdown equity, number of trading operations, Sharpe ratio, etc. The only field that we have added is FIELD_INDEX: record indices. Fields in the structure have different types: long, double, int. All this will be added to the OptCacheRecord record class derived from Record and will be stored in its double-type array.
The library will be accessed via the special OptCacheRecordInternal structure:
  struct OptCacheRecordInternal
  {
    ExpTradeSummary summary;
    MqlParam params[][5]; // [][name, current, low, step, high]
  };
Each tester pass is characterized not only by performance variables, but it is also associated with a certain set of input parameters. In this structure, input parameters are added as an MqlParam array after ExpTradeSummary. With this structure in hand, you can easily write the OptCacheRecord class which is filled with data in the optimizer format.
  class OptCacheRecord: public Record
  {
    protected:
      static int counter; // number of passes

      void fillByTesterPass(const OptCacheRecordInternal &internal)
      {
        const ExpTradeSummary record = internal.summary;
        set(FIELD_INDEX, counter++);
        set(FIELD_PASS, record.Pass);
        set(FIELD_DEPOSIT, record.initial_deposit);
        set(FIELD_WITHDRAWAL, record.withdrawal);
        set(FIELD_PROFIT, record.profit);
        set(FIELD_GROSS_PROFIT, record.grossprofit);
        set(FIELD_GROSS_LOSS, record.grossloss);
        set(FIELD_MAX_TRADE_PROFIT, record.maxprofit);
        set(FIELD_MAX_TRADE_LOSS, record.minprofit);
        set(FIELD_LONGEST_SERIAL_PROFIT, record.conprofitmax);
        set(FIELD_MAX_SERIAL_PROFIT, record.maxconprofit);
        set(FIELD_LONGEST_SERIAL_LOSS, record.conlossmax);
        set(FIELD_MAX_SERIAL_LOSS, record.maxconloss);
        set(FIELD_MIN_BALANCE, record.balance_min);
        set(FIELD_MAX_DRAWDOWN, record.maxdrawdown);
        set(FIELD_MAX_DRAWDOWN_PCT, record.drawdownpercent);
        set(FIELD_REL_DRAWDOWN, record.reldrawdown);
        set(FIELD_REL_DRAWDOWN_PCT, record.reldrawdownpercent);
        set(FIELD_MIN_EQUITY, record.equity_min);
        set(FIELD_MAX_DRAWDOWN_EQ, record.maxdrawdown_e);
        set(FIELD_MAX_DRAWDOWN_PCT_EQ, record.drawdownpercent_e);
        set(FIELD_REL_DRAWDOWN_EQ, record.reldrawdown_e);
        set(FIELD_REL_DRAWDOWN_PCT_EQ, record.reldrawdownpercnt_e);
        set(FIELD_EXPECTED_PAYOFF, record.expected_payoff);
        set(FIELD_PROFIT_FACTOR, record.profit_factor);
        set(FIELD_RECOVERY_FACTOR, record.recovery_factor);
        set(FIELD_SHARPE_RATIO, record.sharpe_ratio);
        set(FIELD_MARGIN_LEVEL, record.margin_level);
        set(FIELD_CUSTOM_FITNESS, record.custom_fitness);

        set(FIELD_DEALS, record.deals);
        set(FIELD_TRADES, record.trades);
        set(FIELD_PROFIT_TRADES, record.profittrades);
        set(FIELD_LOSS_TRADES, record.losstrades);
        set(FIELD_LONG_TRADES, record.longtrades);
        set(FIELD_SHORT_TRADES, record.shorttrades);
        set(FIELD_WIN_LONG_TRADES, record.winlongtrades);
        set(FIELD_WIN_SHORT_TRADES, record.winshorttrades);
        set(FIELD_LONGEST_WIN_CHAIN, record.conprofitmax_trades);
        set(FIELD_MAX_PROFIT_CHAIN, record.maxconprofit_trades);
        set(FIELD_LONGEST_LOSS_CHAIN, record.conlossmax_trades);
        set(FIELD_MAX_LOSS_CHAIN, record.maxconloss_trades);
        set(FIELD_AVERAGE_SERIAL_WIN_TRADES, record.avgconwinners);
        set(FIELD_AVERAGE_SERIAL_LOSS_TRADES, record.avgconloosers);

        const int n = ArrayRange(internal.params, 0);
        for(int i = 0; i < n; i++)
        {
          set(OPT_CACHE_RECORD_FIELDS_LAST + i, internal.params[i][PARAM_VALUE].double_value);
        }
      }

    public:
      OptCacheRecord(const int customFields = 0): Record(OPT_CACHE_RECORD_FIELDS_LAST + customFields)
      {
      }

      OptCacheRecord(const OptCacheRecordInternal &record, const int customFields = 0): Record(OPT_CACHE_RECORD_FIELDS_LAST + customFields)
      {
        fillByTesterPass(record);
      }

      static int getRecordCount()
      {
        return counter;
      }

      static void reset()
      {
        counter = 0;
      }
  };

  static int OptCacheRecord::counter = 0;
The fillByTesterPass method clearly shows the correspondence between the enumeration elements and ExpTradeSummary fields. The constructor accepts a populated OptCacheRecordInternal structure as a parameter.
The intermediary between the TesterCache library and OLAP is a specialized data adapter. The adapter will generate the OptCacheRecord record.
  template<typename T>
  class OptCacheDataAdapter: public DataAdapter
  {
    private:
      int size;
      int cursor;
      int paramCount;
      string paramNames[];
      TESTERCACHE<ExpTradeSummary> Cache;
The 'size' field — the total number of records, cursor — the number of the current record in the cache, paramCount — the number of optimization parameters. The names of the parameters are stored in the paramNames array. The Cache variable of the TESTERCACHE<ExpTradeSummary> type is the working object of the TesterCache library.
Initially, the optimization cache is initialized and read in the reset, load and customize methods.
      void customize()
      {
        size = (int)Cache.Header.passes_passed;
        paramCount = (int)Cache.Header.opt_params_total;
        const int n = ArraySize(Cache.Inputs);

        ArrayResize(paramNames, n);
        int k = 0;

        for(int i = 0; i < n; i++)
        {
          if(Cache.Inputs[i].flag)
          {
            paramNames[k++] = Cache.Inputs[i].name[];
          }
        }
        if(k > 0)
        {
          ArrayResize(paramNames, k);
          Print("Optimized Parameters (", paramCount, " of ", n, "):");
          ArrayPrint(paramNames);
        }
      }

    public:
      OptCacheDataAdapter()
      {
        reset();
      }

      void load(const string optName)
      {
        if(Cache.Load(optName))
        {
          customize();
          reset();
        }
        else
        {
          cursor = -1;
        }
      }

      virtual void reset() override
      {
        cursor = 0;
        if(Cache.Header.version == 0) return;
        T::reset();
      }

      virtual int getFieldCount() const override
      {
        return OPT_CACHE_RECORD_FIELDS_LAST;
      }
The opt file is loaded in the load method, in which the Cache.Load method of the library is called. If successful, Expert Advisor parameters are selected from the header (in the helper method 'customize'). The 'reset' method resets the current record number, which will be incremented the next time getNext iterates all records of the OLAP kernel. Here, the OptCacheRecordInternal structure is populated with data from the optimization cache. On its basis, a new record of the template parameter class (T) is created.
      virtual Record *getNext() override
      {
        if(cursor < size)
        {
          OptCacheRecordInternal internal;
          internal.summary = Cache[cursor];
          Cache.GetInputs(cursor, internal.params);
          cursor++;
          return new T(internal, paramCount);
        }
        return NULL;
      }
      ...
  };
The template parameter is the above-mentioned OptCacheRecord class.
  #ifndef RECORD_CLASS
  #define RECORD_CLASS OptCacheRecord
  #endif

  OptCacheDataAdapter<RECORD_CLASS> _defaultOptCacheAdapter;
It is also defined as a macro, similarly to RECORD_CLASS which is used in other parts of the OLAP kernel. The following is the diagram of classes with all supported previous data adapters and new ones.
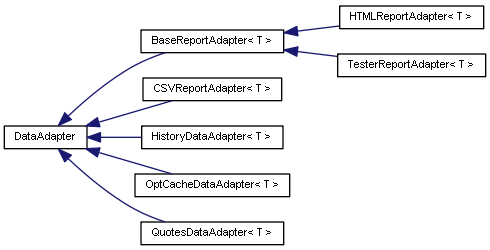
The diagram of data adapter classes
Now, we need to decide which selector types can be useful for analyzing optimization results. The following enumeration is proposed as the first minimal option.
  enum OPT_CACHE_SELECTORS
  {
    SELECTOR_NONE,       // none
    SELECTOR_INDEX,      // ordinal number
    /* all the next require a field as parameter */
    SELECTOR_SCALAR,     // scalar(field)
    SELECTOR_QUANTS,     // quants(field)
    SELECTOR_FILTER      // filter(field)
  };
All record fields belong to one of the two types: trading statistics and EA parameters. A convenient solution is to organize parameters into cells that exactly correspond to the tested values. For example, if parameters include an MA period, for which 10 values were used, the OLAP cube must have 10 cells for this parameter. This is done by a quantization selector (SELECTOR_QUANTS) with a zero "basket" size.
For variable fields, cells should better be set at a certain step. For example, you can view the distribution of passes by profit with a step of 100 units. Again this can be done by the quantization selector. Though the 'basket' size must be set to the required step. Other added selectors perform other service functions. For example, SELECTOR_INDEX is used in calculating the cumulative total. SELECTOR_SCALAR allows receiving one number as a characteristic of the entire selection.
The selector classes are ready and are located in the OLAPCommon.mqh file.
Let's write for these selector types the createSelector method in the template specialization of the OLAPEngine class:
  class OLAPEngineOptCache: public OLAPEngine<OPT_CACHE_SELECTORS,OPT_CACHE_RECORD_FIELDS>
  {
    protected:
      virtual Selector<OPT_CACHE_RECORD_FIELDS> *createSelector(const OPT_CACHE_SELECTORS selector, const OPT_CACHE_RECORD_FIELDS field) override
      {
        const int standard = adapter.getFieldCount();
        switch(selector)
        {
          case SELECTOR_INDEX:
            return new SerialNumberSelector<OPT_CACHE_RECORD_FIELDS,OptCacheRecord>(FIELD_INDEX);
          case SELECTOR_SCALAR:
            return new OptCacheSelector(field);
          case SELECTOR_QUANTS:
            return field != FIELD_NONE ? new QuantizationSelector<OPT_CACHE_RECORD_FIELDS>(field, (int)field < standard ? quantGranularity : 0) : NULL;
        }
        return NULL;
      }

    public:
      OLAPEngineOptCache(): OLAPEngine() {}
      OLAPEngineOptCache(DataAdapter *ptr): OLAPEngine(ptr) {}
  };

  OLAPEngineOptCache _defaultEngine;
When creating a quantization selector, set the basket size to the quantGranularity variable or to zero, depending on whether the field is "standard" (stores the standard tester statistics) or custom (Expert Advisor parameter). The quantGranularity field is described in the OLAPEngine base class. It can be set in the engine constructor or later using the setQuant method.
OptCacheSelector is a simple wrapper for BaseSelector<OPT_CACHE_RECORD_FIELDS>.
Graphical interface for analyzing tester optimization reports
The analysis of optimization results will be visualized using the same interface as was used for trading reports. We can actually copy the OLAPGUI_Trade.mqh file under a new name OLAPGUI_Opts.mqh and make minor adjustments to it. The adjustments concern virtual methods 'setup' and 'process'.
  template<typename S, typename F>
  void OLAPDialog::setup() override
  {
    static const string _settings[ALGO_NUMBER][MAX_ALGO_CHOICES] =
    {
      // enum AGGREGATORS 1:1, default - sum
      {"sum", "average", "max", "min", "count", "profit factor", "progressive total", "identity", "variance"},
      // enum RECORD_FIELDS 1:1, default - profit amount
      {""},
      // enum SORT_BY, default - none
      {"none", "value ascending", "value descending", "label ascending", "label descending"},
      // enum ENUM_CURVE_TYPE partially, default - points
      {"points", "lines", "points/lines", "steps", "histogram"}
    };

    static const int _defaults[ALGO_NUMBER] = {0, FIELD_PROFIT, 0, 0};

    const int std = EnumSize<F,PackedEnum>(0);
    const int fields = std + customFieldCount;

    ArrayResize(settings, fields);
    ArrayResize(selectors, fields);
    selectors[0] = "(<selector>/field)"; // none
    selectors[1] = "<serial number>"; // the only selector, which can be chosen explicitly, it corresponds to the 'index' field

    for(int i = 0; i < ALGO_NUMBER; i++)
    {
      if(i == 1) // pure fields
      {
        for(int j = 0; j < fields; j++)
        {
          settings[j][i] = j < std ? Record::legendFromEnum((F)j) : customFields[j - std];
        }
      }
      else
      {
        for(int j = 0; j < MAX_ALGO_CHOICES; j++)
        {
          settings[j][i] = _settings[i][j];
        }
      }
    }

    for(int j = 2; j < fields; j++) // 0-th is none
    {
      selectors[j] = j < std ? Record::legendFromEnum((F)j) : customFields[j - std];
    }

    ArrayCopy(defaults, _defaults);
  }
There is almost no difference between fields and selectors because any field implies a quantization selector for the same field. In other words, the quantization selector is responsible for everything. In earlier projects related to reports and quotes, we used special selectors for separate fields (such as profitability selector, day of the week selector, candlestick type selector, and others).
The names of all elements of drop-down lists with fields (which also act as selectors for the X, Y, Z axes) are formed from the names of the OPT_CACHE_RECORD_FIELDS enumeration elements, and from the customFields array for the EA parameters. Earlier, we considered the setCustomFields method in the OLAPDialogBase base class, which populates the customFields array with the names from the adapter. These two methods can be linked together in the code of the OLAPGUI_Opts.mq5 analytical EA (See below).
Standard fields are displayed in the order of enumeration elements. Standard fields are followed by custom fields related to the parameters of the EA under optimization. The order of custom fields corresponds to the order of parameters in the opt file.
Reading of control states and launch of the analysis process are performed in the 'process' method.
  template<typename S, typename F>
  int OLAPDialog::process() override
  {
    SELECTORS Selectors[4];
    ENUM_FIELDS Fields[4];
    AGGREGATORS at = (AGGREGATORS)m_algo[0].Value();
    ENUM_FIELDS af = (ENUM_FIELDS)(AGGREGATORS)m_algo[1].Value();
    SORT_BY sb = (SORT_BY)m_algo[2].Value();

    if(at == AGGREGATOR_IDENTITY)
    {
      Print("Sorting is disabled for Identity");
      sb = SORT_BY_NONE;
    }

    ArrayInitialize(Selectors, SELECTOR_NONE);
    ArrayInitialize(Fields, FIELD_NONE);

    int matches[2] =
    {
      SELECTOR_NONE,
      SELECTOR_INDEX
    };

    for(int i = 0; i < AXES_NUMBER; i++)
    {
      if(!m_axis[i].IsVisible()) continue;
      int v = (int)m_axis[i].Value();
      if(v < 2) // selectors (which is specialized for a field already)
      {
        Selectors[i] = (SELECTORS)matches[v];
      }
      else // pure fields
      {
        Selectors[i] = at == AGGREGATOR_IDENTITY ? SELECTOR_SCALAR : SELECTOR_QUANTS;
        Fields[i] = (ENUM_FIELDS)(v);
      }
    }

    m_plot.CurvesRemoveAll();

    if(at == AGGREGATOR_IDENTITY) af = FIELD_NONE;

    m_plot.InitXAxis(at != AGGREGATOR_PROGRESSIVE ? new AxisCustomizer(m_plot.getGraphic(), false) : NULL);
    m_plot.InitYAxis(at == AGGREGATOR_IDENTITY ? new AxisCustomizer(m_plot.getGraphic(), true) : NULL);

    m_button_ok.Text("Processing...");
    return olapcore.process(Selectors, Fields, at, af, olapdisplay, sb);
  }
OLAP analysis and visualization of optimization reports
The MetaTrader Tester provides various ways to test optimization results, which are however limited to the standard set. The available set can be expanded by using the created OLAP engine. For example, the built-in 2D visualization always shows the maximum profit value for a combination of two EA parameters, however there are usually more than two parameters. At each point on the surface we see results for different combinations of other parameters, which are not displayed on the axis. This may lead to an overly optimistic assessment of the profitability of specific values of displayed parameters. A more balanced assessment could be obtained from average profit value and from the range of its values. This evaluation, among other assessments, can be performed using OLAP.
The OLAP analysis of optimization reports will be performed by the new non-trading Expert Advisor OLAPGUI_Opts.mq5. Its structure is fully identical to OLAPGUI.mq5. Furthermore, it is simpler, because there is no need to connect adapters depending on the specified file type. This will always be an opt file for optimization results.
Specify the file name in inputs and a quantization step for statistical parameters.
  input string OptFileName = "Integrity.opt";
  input uint QuantGranularity = 0;
Please note that it is desirable to have a separate quantization step for each field. However, now we set it only once, while the value is not changed from the GUI. This flaw provides a potential area for further improvement. Remember, that the step value can be suitable for one field and not suitable for another (it can be too large or too small). Therefore, call the EA properties dialog to change the quantum if necessary, prior to choosing the field from the drop-down list in the OLAP interface.
After including header files with all classes, create a dialog instance and bind it to the OLAP engine.
  #include <OLAP/OLAPOpts.mqh>
  #include <OLAP/GUI/OLAPGUI_Opts.mqh>

  OLAPDialog<SELECTORS,ENUM_FIELDS> dialog(_defaultEngine);
In OnInit handler, connect the new adapter to the engine and initiate data loading from the file.
  int OnInit()
  {
    _defaultEngine.setAdapter(&_defaultOptCacheAdapter);
    _defaultEngine.setShortTitles(true);
    _defaultEngine.setQuant(QuantGranularity);
    _defaultOptCacheAdapter.load(OptFileName);
    dialog.setCustomFields(_defaultOptCacheAdapter);

    if(!dialog.Create(0, "OLAPGUI" + (OptFileName != "" ? " : " + OptFileName : ""), 0,  0, 0, 750, 560)) return INIT_FAILED;
    if(!dialog.Run()) return INIT_FAILED;

    return INIT_SUCCEEDED;
  }
Let us try to build some analytical sections for the Integrity.opt file with QuantGranularity = 100. The following three parameters were selected during optimization: PricePeriod, Momentum, Sigma.
The below screenshot shows profit broken down by PricePeriod values.
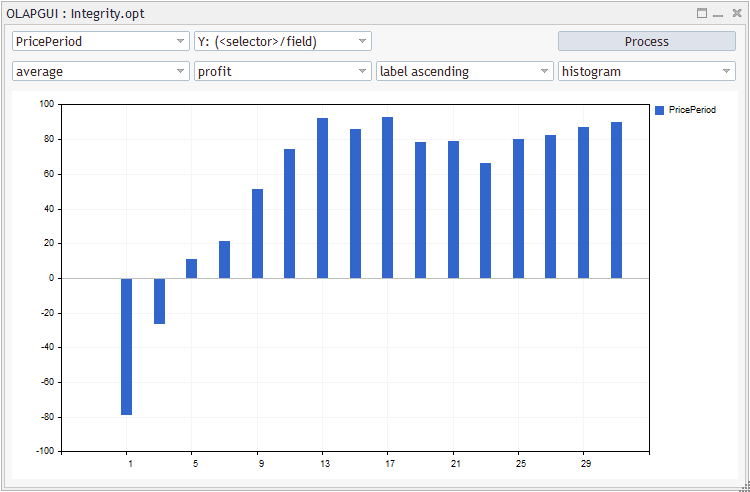
Average profit depending on the EA parameter value
The result provides little information without dispersion.
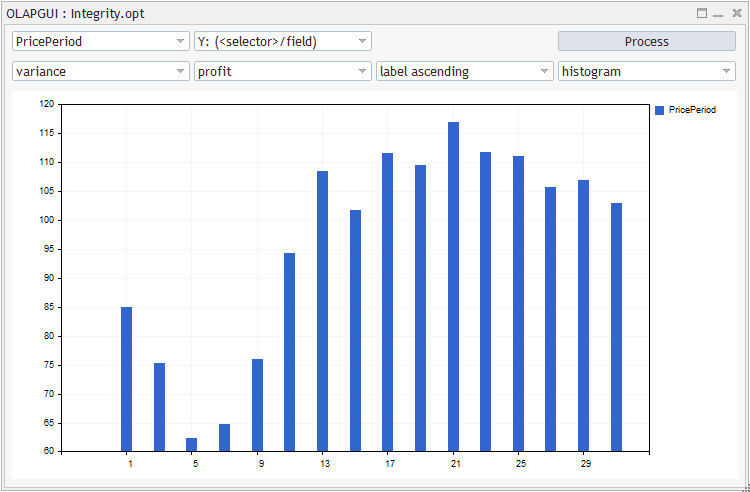
Profit dispersion depending on the EA parameter value
By comparing these two histograms, we can estimate with which parameter values the dispersion does not exceed the average value, which means breakeven. A better solution is to perform comparison automatically, on the same chart. But this is beyond the scope of this article.
Alternatively, let's view profitability for this parameter (profit to loss ratio for all passes).
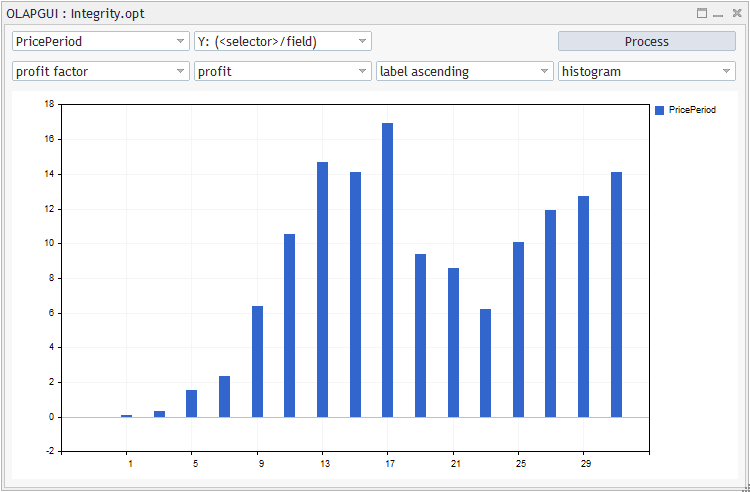
Strategy Profit Factor depending on the EA parameter value
Another, tricky, assessment way is evaluating the average period size broken down by profit levels, in increments of 100 (the step is set in the QuantGranularity input parameter).
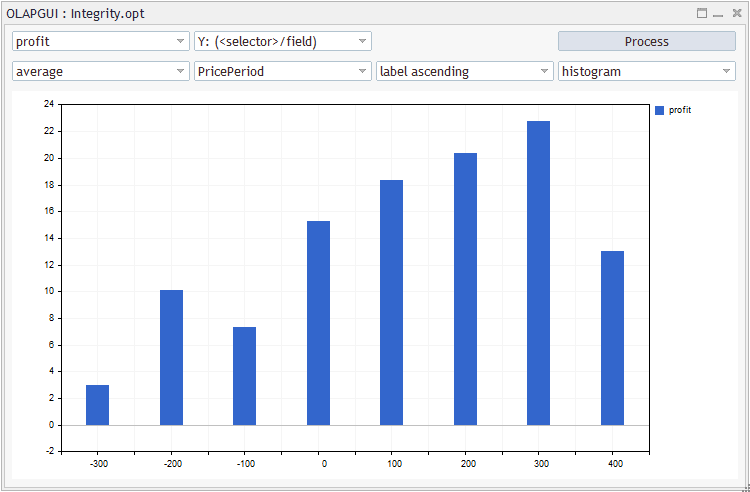
The average value of the parameter for profit generating in various ranges (in increments of 100 units)
The below figure shows the distribution of profits depending on the period (all passes are shown through the use of the 'identity' aggregator).
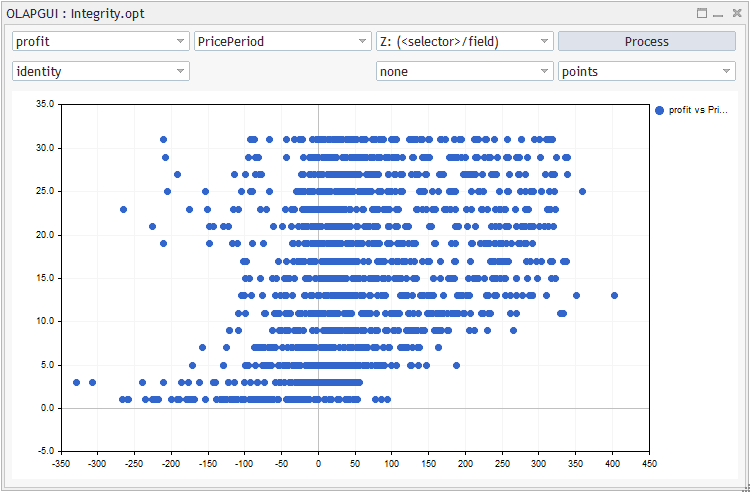
Profit vs parameter value for all positions
The breakdown of profit by Momentum and Sigma looks as follows.
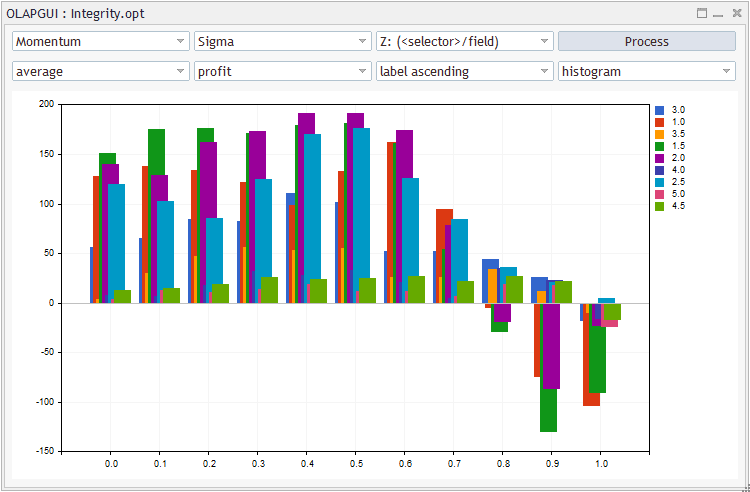
Average profit by two parameters
To view the general distribution of profits by levels in increments of 100, select the 'profit' field from the statistics along the X axis and the 'count' aggregator.
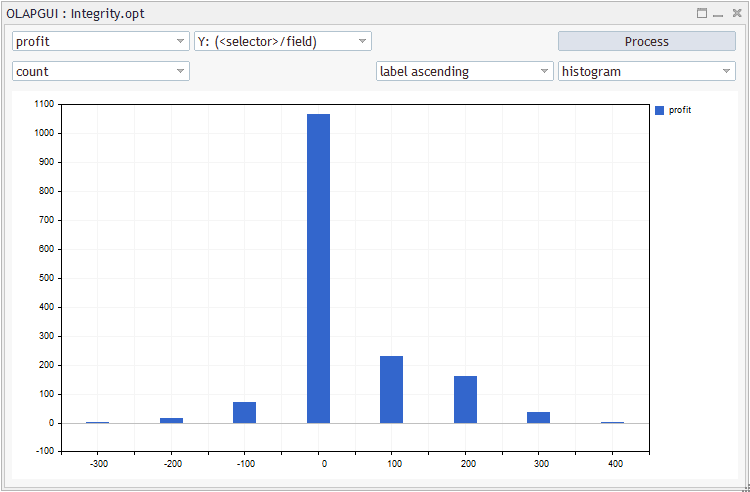
Distribution of all profits by ranges in increments of 100 units
By using the 'identity' aggregator, we can evaluate the influence of the number of trades to profit. Generally, this aggregator enables the visual evaluation of many other dependencies.
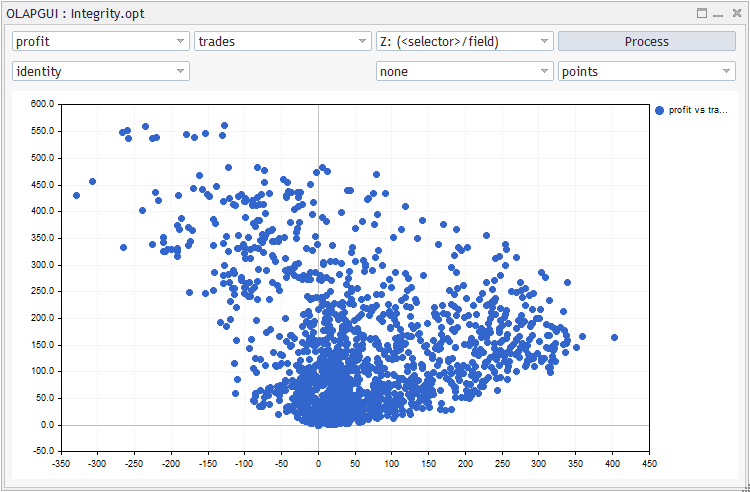
Profit vs number of trades
Conclusion
In this article, we have expanded the scope of MQL OLAP. Now, it can be used to analyze tester reports from single passes and optimizations. The updated structure of classes enables further expansion of OLAP capabilities. The proposed implementation is not ideal and it can be greatly improved (in particular, in terms of 3D visualization, implementation of filtering settings and quantization on different axes in the interactive GUI). Nevertheless, it it serves as a minimal starting set, which helps in easier acquaintance with the OLAP world. OLAP analysis allows traders to process large volumes of raw data and to obtain new knowledge for further decision making.
Attached files:
Experts
- OLAPRPRT.mq5 — Expert Advisor for analyzing the account history, as well as HTML and CSV reports (updated file from article 3, without GUI)
- OLAPQTS.mq5 — Expert Advisor for analyzing quotes (updated file from article 3, without GUI)
- OLAPGUI.mq5 — Expert Advisor for analyzing the account history, reports in HTML and CSV formats, as well as TST standard tester files (updated file from article 2, without GUI)
- OLAPGUI_Opts.mq5 — Expert Advisor for analyzing optimization results form standard OPT tester files (new, GUI)
Include
Kernel
- OLAP/OLAPCommon.mqh — the main header file with OLAP classes
- OLAP/OLAPTrades.mqh — standard classes for the OLAP analysis of trading history
- OLAP/OLAPTradesCustom.mqh — custom classes for the OLAP analysis of trading history
- OLAP/OLAPQuotes.mqh — classes for the OLAP analysis of quotes
- OLAP/OLAPOpts.mqh — classes for the OLAP analysis of Expert Advisor optimization results
- OLAP/ReportCubeBase.mqh — basic classes for the OLAP analysis of trading history
- OLAP/HTMLcube.mqh — classes for the OLAP analysis of trading history in the HTML format
- OLAP/CSVcube.mqh — classes for the OLAP analysis of trading history in the CSV format
- OLAP/TSTcube.mqh — classes for the OLAP analysis of trading history in the TST format
- OLAP/PairArray.mqh — a class of the array of pairs [value;name] supporting all sorting types
- OLAP/GroupReportInputs.mqh — a group of input parameters for the analysis of trading reports
- MT4Bridge/MT4Orders.mqh — MT4orders library for working with orders in the single style for MetaTrader 4 and for MetaTrader 5
- MT4Bridge/MT4Time.mqh — an auxiliary header file which implements data processing functions in the MetaTrader 4 style
- Marketeer/IndexMap.mqh — an auxiliary header file which implements an array with a key- and index-based combined access
- Marketeer/Converter.mqh — an auxiliary header file for converting data types
- Marketeer/GroupSettings.mqh — an auxiliary header file which contains group settings of input parameters
- Marketeer/WebDataExtractor.mqh — HTML parser
- Marketeer/empty_strings.h — list of empty HTML tags
- Marketeer/HTMLcolumns.mqh — definition of column indexes in HTML reports
- Marketeer/RubbArray.mqh — an auxiliary header file with the "rubber" array
- Marketeer/CSVReader.mqh — CSV parser
- Marketeer/CSVcolumns.mqh — definition of column indexes in CSV reports
Graphical interface
- OLAP/GUI/OLAPGUI.mqh — general implementation of the interactive window interface
- OLAP/GUI/OLAPGUI_Trades.mqh — specializations of the graphical interface for the analysis of trading reports
- OLAP/GUI/OLAPGUI_Opts.mqh — specializations of the graphical interface for the analysis of optimization results
- Layouts/Box.mqh — container of controls
- Layouts/ComboBoxResizable.mqh — the drop-down control, with the possibility of dynamic resizing
- Layouts/MaximizableAppDialog.mqh — the dialog window, with the possibility of dynamic resizing
- PairPlot/Plot.mqh — a control with chart graphics, with the support for dynamic resizing
- Layouts/res/expand2.bmp — window maximize button
- Layouts/res/size6.bmp — resize button
- Layouts/res/size10.bmp — resize button
TypeToBytes
- TypeToBytes.mqh
SingleTesterCache
- fxsaber/SingleTesterCache/SingleTesterCache.mqh
- fxsaber/SingleTesterCache/SingleTestCacheHeader.mqh
- fxsaber/SingleTesterCache/String.mqh
- fxsaber/SingleTesterCache/ExpTradeSummaryExt.mqh
- fxsaber/SingleTesterCache/ExpTradeSummarySingle.mqh
- fxsaber/SingleTesterCache/TradeDeal.mqh
- fxsaber/SingleTesterCache/TradeOrder.mqh
- fxsaber/SingleTesterCache/TesterPositionProfit.mqh
- fxsaber/SingleTesterCache/TesterTradeState.mqh
TesterCache
- fxsaber/TesterCache/TesterCache.mqh
- fxsaber/TesterCache/TestCacheHeader.mqh
- fxsaber/TesterCache/String.mqh
- fxsaber/TesterCache/ExpTradeSummary.mqh
- fxsaber/TesterCache/TestCacheInput.mqh
- fxsaber/TesterCache/TestInputRange.mqh
- fxsaber/TesterCache/Mathematics.mqh
- fxsaber/TesterCache/TestCacheRecord.mqh
- fxsaber/TesterCache/TestCacheSymbolRecord.mqh
Standard Library Patch
- Controls/Dialog.mqh
- Controls/ComboBox.mqh
Files
- 518562.history.csv
- Integrity.tst
- Integrity.opt
Translated from Russian by MetaQuotes Ltd.
Original article: https://www.mql5.com/ru/articles/7656
Warning: All rights to these materials are reserved by MetaQuotes Ltd. Copying or reprinting of these materials in whole or in part is prohibited.
This article was written by a user of the site and reflects their personal views. MetaQuotes Ltd is not responsible for the accuracy of the information presented, nor for any consequences resulting from the use of the solutions, strategies or recommendations described.
 Multicurrency monitoring of trading signals (Part 3): Introducing search algorithms
- Free trading apps
- Over 8,000 signals for copying
- Economic news for exploring financial markets
You agree to website policy and terms of use
Stanislav, please tell me what could be the matter. I have updated all the files. But the compiler still fails.
Maybe this is the right way? Then the error disappears:
Something was changed in MQL5, so you need to patch OLAPTrades.mqh by analogy with OLAPCommon.mqh (which has already been done earlier).
_typename_ = TYPENAME(this);I attach the corrected file.
Great article! Where can I learn more about OLAP transactions?
Your question is not clear. Apparently you mean transactions in OLTP? But that's not OLAP.
In principle, the SQLite engine, which was built into MT5 just in 2020, also provides powerful data aggregation and analysis functions, but you need to know SQL. Both OLAP and OLTP can be implemented on it.
Your question is not clear. Apparently you mean transactions in OLTP? But that's not OLAP.
In principle, the SQLite engine, which was built into MT5 just in 2020, also provides powerful data aggregation and analysis functions, but you need to know SQL. Both OLAP and OLTP can be implemented on it.