
The Channel Breakout pattern
Introduction
The global market is an age-old struggle between sellers and buyers. Sellers want to earn more by selling at a higher price, while buyers are not willing to give their earned money and want to pay a cheaper price. According to the theory of economics, the true price is found at the point of equality of supply and demand. That seems to be true. However, the problem is in the market dynamics, because the volumes of supply and demand are constantly changing.
The struggle results in price fluctuations. These fluctuations form channels, which traders analyze to find market trends. In turn, these movements form fluctuations of a higher order. One of the first signs of trend change is the breakout of a formed price channel.
1. Theoretical Aspects of the Strategy
Price channels along with trendlines refer to the main graphical analysis shapes. Price channels show the current trend and the amplitude of price fluctuations within this trend. Depending on the current trend, the channels can be ascending, descending or sideways (flat).
The MetaTrader 5 terminal supports four types of channels.
- Equidistant channel
- Standard deviation channel
- Regression channel
- Andrews Pitchfork
As an example, we will analyze the EURUSD M30 chart and price fluctuations.
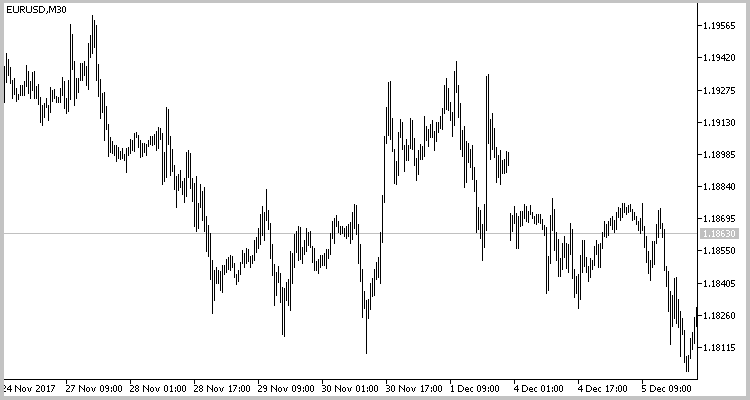
By dividing the above chart into trends, we can mark three price channels. Equidistant channels are shown in the below chart. Descending channels are marked with red lines, an upward channel is shown in blue. Drawing of a descending channel starts with the upper channel border, which determines trend based on the highs of price fluctuations. The lower border is built on price lows parallel to the upper one. The lower border can be drawn at the maximum or average deviation. The construction of rising channels is opposite: the lower border is drawn first, and then the upper one. When drawing a sideway channel, we should pay attention to the previous trend, because flat price fluctuations often act as a correction to the previous movement, which may continue after the flat period.
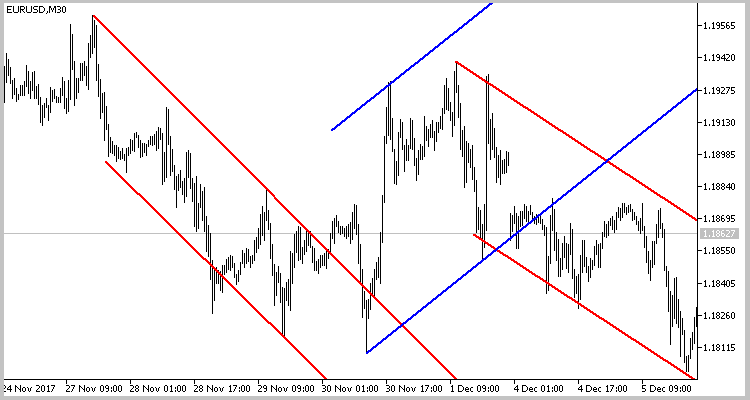
Two types of strategies are usually used for channel trading: trading inside the channel (a trend strategy) and channel breakout trading (a counter-trend strategy). In this article, we deal with the channel breakout strategy, which indicates a trend change.
When trend changes, price exits the channel in the direction opposite to the current trend. A channel is considered broken if a candlestick closes beyond its limits.
Take into account that after the channel breakout, the price returns to its borders and only then moves in a new trend direction. This movement often leads to triggering of traders' stop losses before the price movement. To avoid this, we will enter the market after the price returns to the borders of the broken channel.
2. Automating the Search for Patterns
To create an algorithm for finding patterns, we will use the method proposed by Dmitry Fedoseev in his article [1]. Let's use the definition of a horizontal formation from the indicator described in that article. Its code should be added to the CChannel class.
So, we decided to open a position after the price returns to channel borders rather than immediately after the breakout. In this case a situation may occur, when we wait for a price to return to one channel, while the EA is already looking for a new channel. To enable parallel operation with several channels, the created class will find and process only one pattern. Let's unite all classes into one array. As soon as the pattern is processed and an appropriate order is opened, the class will be deleted. Therefore, by initializing the ZigZag indicator in a class, we need to call the indicator for each class. To avoid this, we will initialize the indicator in the main program, and only the handle of the indicator will be passed to the class.
In addition, in order to avoid duplication of channels, we will pass the previous channel breakout time to the class during initialization. This will ensure that the next class instance will search for a channel after the breakout of the previous one.
This class is shown below.
class CChannel : public CObject
  {
private:
   string            s_Symbol;      // Symbol
   ENUM_TIMEFRAMES   e_Timeframe;   // Timeframe
   int               i_Handle;      // Indicator's handle
   datetime          dt_LastCalc;   // Last calculated bar
   SPeackTrough      PeackTrough[]; // Array of ZigZag's peacks
   int               CurCount;      // Count of peaks
   int               PreDir;        // Previus ZigZag's leg direction
   int               CurDir;        // Current ZigZag's leg direction
   int               RequiredCount; // Minimal peacks in channel
   double            d_Diff;
   bool              b_FoundChannel;
   bool              b_Breaked;
   datetime          dt_Breaked;
   double            d_BreakedPrice;

   void              RefreshLast(datetime time,double v);
   void              AddNew(datetime time,double v,int d);
   bool              CheckForm(double base);
   double            GetRessistPrice(SPeackTrough &start_peack, datetime time);
   double            GetSupportPrice(SPeackTrough &start_peack, datetime time);
   bool              DrawChannel(MqlRates &break_bar);
   bool              DrawChannel(void);
   bool              UnDrawChannel(void);

public:
                     CChannel(int handle,datetime start_time,string symbol,ENUM_TIMEFRAMES timeframe);
                    ~CChannel();
   bool              Calculate(ENUM_ORDER_TYPE &type,double &stop_loss,datetime &deal_time,bool &breaked,datetime &breaked_time);
  };
The following information will be passed in the parameters of the class initialization function: the indicator handle, channel search start time, the name of the symbol and the working timeframe. In the function body, the passed data is saved to appropriate variables and initial values are assigned to other variables.
CChannel::CChannel(int handle,datetime start_time,string symbol,ENUM_TIMEFRAMES timeframe) : RequiredCount(4),
                                                                                             CurCount(0),
                                                                                             CurDir(0),
                                                                                             PreDir(0),
                                                                                             d_Diff(0.1),
                                                                                             b_Breaked(false),
                                                                                             dt_Breaked(0),
                                                                                             b_FoundChannel(false)
  {
   i_Handle=handle;
   dt_LastCalc=fmax(start_time-1,0);
   s_Symbol=symbol;
   e_Timeframe=timeframe;
  }
The UnDrawChannel function is called in the class deinitialization function. It removes previously added graphical objects from the chart.
Main operations are performed in the Calculate function. Its parameters include references to variables for writing information about channel breakout and a trade opened by the pattern. The use of references in parameters allows returning from the function the values of multiple variables.
Symbol quotes starting with the last saved peak are loaded to the array at the beginning of the function. If loading of required quotes fails, the function returns false.
bool CChannel::Calculate(ENUM_ORDER_TYPE &type,double &stop_loss,datetime &deal_time, bool &breaked,datetime &breaked_time)
  {
   MqlRates rates[];
   CurCount=ArraySize(PeackTrough);
   if(CurCount>0)
     {
      dt_LastCalc=PeackTrough[CurCount-1].Bar;
      CurDir=PeackTrough[CurCount-1].Dir;
     }
   int total=CopyRates(s_Symbol,e_Timeframe,fmax(dt_LastCalc-PeriodSeconds(e_Timeframe),0),TimeCurrent(),rates);
   if(total<=0)
      return false;
After that we initialize return variables.
   stop_loss=-1;
   breaked=b_Breaked;
   breaked_time=dt_Breaked;
   deal_time=0;
After that, the loop of data processing on each bar starts. First of all the emergence of a new ZigZag peak is checked. If a new peak appears or the previous one is repainted, data are saved to the array using the RefreshLast and AddNew functions.
   for(int i=0;i<total;i++)
     {
      if(rates[i].time>dt_LastCalc)
        {
         dt_LastCalc=rates[i].time;
         PreDir=CurDir;
        }
      else
         continue;

      // new max

      double lhb[2];
      if(CopyBuffer(i_Handle,4,total-i-1,2,lhb)<=0)
         return false;

      if(lhb[0]!=lhb[1])
        {
         if(CurDir==1)
            RefreshLast(rates[i].time,rates[i].high);
         else
            AddNew(rates[i].time,rates[i].high,1);
        }

      // new min

      double llb[2];
      if(CopyBuffer(i_Handle,5,total-i-1,2,llb)<=0)
         return false;

      if(llb[0]!=llb[1])
        {
         if(CurDir==-1)
            RefreshLast(rates[i].time,rates[i].low);
         else
            AddNew(rates[i].time,rates[i].low,-1);
        }
The next step is to check if the minimum amount of peaks needed for identifying a channel have been formed. If yes, then we check if the current price movement corresponds to the channel formation. This check is performed in the CheckForm function.
If they correspond, true is assigned to the b_FoundChannel variable. Otherwise, the oldest peak is discarded from the list of peaks, initial values are assigned to variables, and operation returns to the beginning of the loop.
      double base=(CurCount>=2 ? MathAbs(PeackTrough[1].Val-PeackTrough[0].Val) : 0);

      if(CurCount>=RequiredCount && !b_FoundChannel)
        {
         if(CurDir!=PreDir)
           {
            if(CheckForm(base))
              {
               b_FoundChannel=true;
              }
            else
              {
               UnDrawChannel();
               dt_LastCalc=PeackTrough[0].Bar+PeriodSeconds(e_Timeframe);
               ArrayFree(PeackTrough);
               CurCount=0;
               CurDir=0;
               PreDir=0;
               b_Breaked=false;
               dt_Breaked=0;
               b_FoundChannel=false;
               deal_time=0;
               total=CopyRates(s_Symbol,e_Timeframe,fmax(dt_LastCalc,0),TimeCurrent(),rates);
               i=-1;
               continue;
              }
           }
        }
After the channel is found, a breakout is searched. If the channel is broken, the value of true is assigned to the variables b_Breaked and breaked. The open time of the breakout candlestick is saved to variables dt_Breaked and breaked_time, and the extreme value of the candlestick is saved to d_BreakedPrice. Then the DrawChannel function is called to draw the channel and the breakout point on the chart. Note that the function searches for a breakout in the direction opposite to the current trend. If the trend intensifies and the price exits the channel in the current trend direction, the class initializes the creation of a new class instance to search for the channel (see the global SearchNewChannel function below).
Once the breakout is found, we proceed to searching for a market entry pattern. An entry signal is generated if the price breaks the channel and then returns to its borders. An additional entry signal is closing of a candlestick above the extremum of the breakout candlestick for a Buy trade or below it for the Sell trade. This pattern is used for entering the market if the price breaks the channel in a strong movement and moves further without any correction.
When a signal is generated, we write the required order type to the 'type' variable and also calculate the Stop Loss value and save it to the appropriate variable. The time of the beginning of the bar, at which the signal emerged, is written to the deal_time variable.
      if(b_FoundChannel)
        {
         if(PeackTrough[0].Dir==1)
           {
            if(PeackTrough[0].Val>PeackTrough[2].Val)
              {
               if(!b_Breaked)
                 {
                  if((rates[i].close-GetRessistPrice(PeackTrough[0],rates[i].time))>=(d_Diff*base))
                    {
                     b_Breaked=breaked=true;
                     dt_Breaked=breaked_time=rates[i].time;
                     d_BreakedPrice=rates[i].high;
                     DrawChannel(rates[i]);
                     continue;
                    }
                  if(CurCount>4 && PeackTrough[CurCount-1].Dir==1 && (GetRessistPrice(PeackTrough[1],rates[i].time)-PeackTrough[CurCount-1].Val)>0)
                    {
                     int channels=ArraySize(ar_Channels);
                     if(ar_Channels[channels-1]==GetPointer(this))
                       {
                        SearchNewChannel(PeackTrough[CurCount-3].Bar-PeriodSeconds(e_Timeframe));
                       }
                    }
                 }
               else
                 {
                  if(rates[i].time<=dt_Breaked)
                     continue;
                  //---
                  double res_price=GetRessistPrice(PeackTrough[0],rates[i].time);
                  if(((rates[i].low-res_price)<=0 && (rates[i].close-res_price)>0 && (rates[i].close-res_price)<=(d_Diff*base)) || rates[i].close>d_BreakedPrice)
                    {
                     type=ORDER_TYPE_BUY;
                     stop_loss=res_price-base*(1+d_Diff);
                     deal_time=rates[i].time;
                     return true;
                    }
                 }
              }
            else
              {
               UnDrawChannel();
               dt_LastCalc=PeackTrough[0].Bar+PeriodSeconds(e_Timeframe);
               ArrayFree(PeackTrough);
               CurCount=0;
               CurDir=0;
               PreDir=0;
               b_Breaked=false;
               dt_Breaked=0;
               b_FoundChannel=false;
               deal_time=0;
               total=CopyRates(s_Symbol,e_Timeframe,fmax(dt_LastCalc,0),TimeCurrent(),rates);
               i=-1;
               continue;
              }
           }
         else
           {
            if(PeackTrough[0].Val<PeackTrough[2].Val)
              {
               if(!b_Breaked)
                 {
                  if((GetSupportPrice(PeackTrough[0],rates[i].time)-rates[i].close)>=(d_Diff*base))
                    {
                     b_Breaked=breaked=true;
                     dt_Breaked=breaked_time=rates[i].time;
                     d_BreakedPrice=rates[i].low;
                     DrawChannel(rates[i]);
                     continue;
                    }
                  if(CurCount>4 && PeackTrough[CurCount-1].Dir==-1 && (PeackTrough[CurCount-1].Val-GetSupportPrice(PeackTrough[1],rates[i].time))>0)
                    {
                     int channels=ArraySize(ar_Channels);
                     if(ar_Channels[channels-1]==GetPointer(this))
                       {
                        SearchNewChannel(PeackTrough[CurCount-3].Bar-PeriodSeconds(e_Timeframe));
                       }
                    }
                 }
               else
                 {
                  if(rates[i].time<=dt_Breaked)
                     continue;
                  double sup_price=GetSupportPrice(PeackTrough[0],rates[i].time);
                  if(((sup_price-rates[i].high)<=0 && (sup_price-rates[i].close)>0 && (sup_price-rates[i].close)<=(d_Diff*base)) || rates[i].close<d_BreakedPrice)
                    {
                     type=ORDER_TYPE_SELL;
                     stop_loss=sup_price+base*(1+d_Diff);
                     deal_time=rates[i].time;
                     return true;
                    }
                 }
              }
            else
              {
               UnDrawChannel();
               dt_LastCalc=PeackTrough[0].Bar+PeriodSeconds(e_Timeframe);
               ArrayFree(PeackTrough);
               CurCount=0;
               CurDir=0;
               PreDir=0;
               b_Breaked=false;
               dt_Breaked=0;
               b_FoundChannel=false;
               deal_time=0;
               total=CopyRates(s_Symbol,e_Timeframe,fmax(dt_LastCalc,0),TimeCurrent(),rates);
               i=-1;
               continue;
              }
           }
        }
     }
   return b_Breaked;
  }
The full code of the CChannel class and its functions is attached below.
3. Creating an Expert Advisor for Strategy Testing
#resource "\\Indicators\\ZigZags\\iUniZigZagSW.ex5"
#include <\\Break_of_channel_DNG\\Channel.mqh>
#include <Trade\\Trade.mqh>
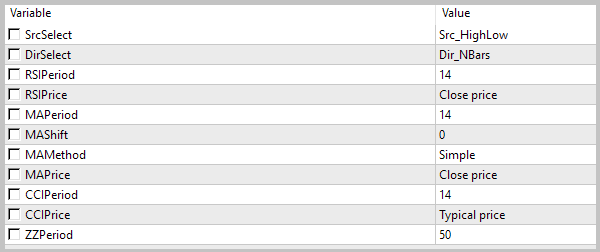
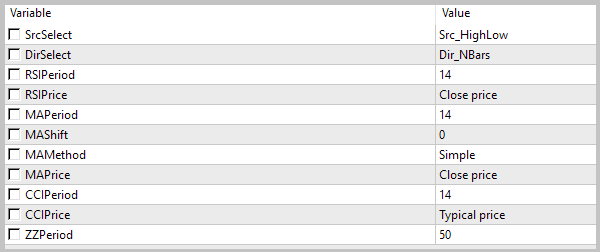
The Expert Advisor parameters will be identical to the parameters of the indicator.
input ESorce               SrcSelect      =  Src_HighLow;
input EDirection           DirSelect      =  Dir_NBars;
input int                  RSIPeriod      =  14;
input ENUM_APPLIED_PRICE   RSIPrice       =  PRICE_CLOSE;
input int                  MAPeriod       =  14;
input int                  MAShift        =  0;
input ENUM_MA_METHOD       MAMethod       =  MODE_SMA;
input ENUM_APPLIED_PRICE   MAPrice        =  PRICE_CLOSE;
input int                  CCIPeriod      =  14;
input ENUM_APPLIED_PRICE   CCIPrice       =  PRICE_TYPICAL;
input int                  ZZPeriod       =  50;
The EA has four global variables. The following is written in these variables:
- the indicator handle,
- an array of pointers to channels (objects of the CChannel class),
- a pointer to the CTrade class (it is used for performing trading operations),
- the opening time of the bar, on which the last breakout occurred.
int         zz_handle;
CChannel   *ar_Channels[];
CTrade     *Trade;
datetime    dt_last_break;
In the EA's OnInit function, we call the indicator and initialize required classes. The function should return INIT_FAILED in case of an error.
int OnInit()
  {
//---
   zz_handle=iCustom(Symbol(),Period(),"::Indicators\\ZigZags\\iUniZigZagSW",SrcSelect,
                                             DirSelect,
                                             RSIPeriod,
                                             RSIPrice,
                                             MAPeriod,
                                             MAShift,
                                             MAMethod,
                                             MAPrice,
                                             CCIPeriod,
                                             CCIPrice,
                                             ZZPeriod);

   if(zz_handle==INVALID_HANDLE){
      Alert("Error load indicator");
      return(INIT_FAILED);
   }
//---
   Trade=new CTrade();
   if(CheckPointer(Trade)==POINTER_INVALID)
      return INIT_FAILED;
//---
   dt_last_break=0;
//---
   return(INIT_SUCCEEDED);
  }
To clear the memory, we delete all used class instances in the OnDeinit function.
void OnDeinit(const int reason)
  {
//---
   int total=ArraySize(ar_Channels);
   for(int i=0;i<total;i++)
     {
      if(CheckPointer(ar_Channels[i])!=POINTER_INVALID)
         delete ar_Channels[i];
     }
   ArrayFree(ar_Channels);
   if(CheckPointer(Trade)!=POINTER_INVALID)
      delete Trade;
  }
The main work is performed in the OnTick function.
We have decided that a channel should be considered broken if a candlestick closes beyond its limits. The channel will be drawn based on completely formed ZigZag peaks. So, the EA does not need to perform actions on every tick. Therefore the first thing to do in this function is to check the opening of a new bar.
void OnTick()
  {
//---
   static datetime last_bar=0;
   if(last_bar>=SeriesInfoInteger(_Symbol,PERIOD_CURRENT,SERIES_LASTBAR_DATE))
      return;
   last_bar=(datetime)SeriesInfoInteger(_Symbol,PERIOD_CURRENT,SERIES_LASTBAR_DATE);
Note that the last_bar variable is only used in this code block, that is why it is not declared globally. As you know, initialization of all local variables is performed every time after the start of the corresponding function. That is why data saved in the variable is lost at the next OnTick start. To avoid data loss, the variable is declared with the static modifier. This variable will retain its values during further function starts.
The next step is to determine how many channels are stored in the array. If there are no channels, start the search from the last saved breakout.
   int total=ArraySize(ar_Channels);
   if(total==0)
      if(SearchNewChannel(dt_last_break))
         total++;
After that we work with each saved channel in a loop. First, the pointer to the class object is checked. If the pointer is not correct, we delete it from the array and move to the next one.
   for(int i=0;i<total;i++)
     {
      if(CheckPointer(ar_Channels[i])==POINTER_INVALID)
        {
         DeleteChannel(i);
         i--;
         total--;
         continue;
        }
Then the Calculate function of the class is called. Its parameters are references to variables, to which the function will return information about the results of performed operations. We need to declare these variables before the function call. In addition, the function returns a bool value. So we can call the function as a logical expression for the 'if' statement, and further operations will only be performed if the function is successful.
      ENUM_ORDER_TYPE type;
      double stop_loss=-1;
      bool breaked=false;
      datetime breaked_time=0;
      datetime deal_time=0;
      if(ar_Channels[i].Calculate(type,stop_loss,deal_time,breaked,breaked_time))
        {
After the successful execution of the function, re-save the time of bar, on which the last channel breakout occurred.
dt_last_break=fmax(dt_last_break,breaked_time);If the last saved channel was broken, initialize search for a new channel that was formed after the last breakout.
         if(breaked && i==(total-1))
            if(SearchNewChannel(breaked_time))
              {
               if(total>=5)
                  i--;
               else
                  total++;
              }
Note that the SearchNewChannel function stores the last five channels. Therefore, the value of the 'total' variable only grows if there are less than 5 channels in the array. Otherwise, reduce the i variable, which indicates the index of the channel being processed.
Then we check the emergence of a signal to open a position and send a corresponding order if needed. The Expert Advisor is only designed for testing purposes. That is why it does not have a money management block, so all trades are opened with a minimum lot. After sending an order, the processed channel should be deleted.
         if(deal_time>=0 && stop_loss>=0)
           {
            int bars=Bars(_Symbol,PERIOD_CURRENT,deal_time,TimeCurrent());
            double lot=SymbolInfoDouble(_Symbol,SYMBOL_VOLUME_MIN);
            switch(type)
              {
               case ORDER_TYPE_BUY:
                 if(PositionSelect(_Symbol) && PositionGetInteger(POSITION_TYPE)==POSITION_TYPE_SELL)
                    Trade.PositionClose(_Symbol);
                 if(bars<=2)
                    Trade.Buy(lot,_Symbol,0,fmax(stop_loss,0));
                 break;
               case ORDER_TYPE_SELL:
                 if(PositionSelect(_Symbol) && PositionGetInteger(POSITION_TYPE)==POSITION_TYPE_BUY)
                    Trade.PositionClose(_Symbol);
                 if(bars<=2)
                    Trade.Sell(lot,_Symbol,0,fmax(stop_loss,0));
                 break;
              }
            DeleteChannel(i);
            i--;
            total--;
           }
        }
     }
  }
Please note two important points in this program code block.
1. Orders are only opened if the signal emerged not earlier than on a previous candle. This limitation is added due to the fact that the Expert Advisor can process historical data (for example, during initialization or after the terminal is disconnected from the server). In this case a signal may appear with a delay, and a new trade can lead to uncontrollable losses.
2. The Expert Advisor opens orders with a Stop Loss, while Take Profit is not specified. So, when a signal emerges, an opposite position is closed if necessary.
Two helper functions SearchNewChannel and DeleteChannel are additionally used in the code.
The SearchNewChannel function initializes a new instance of the CChannel class in the array of channels. At the beginning of the function, we check the indicator handle. If the handle is incorrect, exit the function with the 'false' result.
bool SearchNewChannel(datetime time)
  {
   if(zz_handle==INVALID_HANDLE)
      return false;
When creating the Expert Advisor, I decided to work with the last five channels. That is why the next step is to check the number of channels stored in the array and to delete the oldest one if necessary. The remaining four channels are moved to the array beginning.
   int total=ArraySize(ar_Channels);
   if(total>4)
     {
      for(int i=0;i<total-4;i++)
        {
         if(CheckPointer(ar_Channels[i])!=POINTER_INVALID)
            delete ar_Channels[i];
        }
      for(int i=0;i<4;i++)
         ar_Channels[i]=ar_Channels[total-4+i];
      if(total>5)
        {
         if(ArrayResize(ar_Channels,5)>0)
            total=5;
         else
            return false;
        }
     }
If there are less than five channels, the array is increased.
   else
     {
      if(ArrayResize(ar_Channels,total+1)>0)
         total++;
      else
         return false;
     }
At the end of the function we initialize a new instance of the CChannel class in the last cell of the array.
   ar_Channels[total-1]=new CChannel(zz_handle,time,_Symbol,PERIOD_CURRENT);
   return (CheckPointer(ar_Channels[total-1])!=POINTER_INVALID);
  }
The DeleteChannel function deletes from the array a CChannel class instance with the specified index. At the beginning of the function we check if the index is within the existing array. If it is not, exit the function with the 'false' result.
bool DeleteChannel(int pos)
  {
   int total=ArraySize(ar_Channels);
   if(pos<0 || pos>=total)
      return false;
Then the specified object is deleted and the rest objects are moved one cell below.
   delete ar_Channels[pos];
   for(int i=pos;i<total-1;i++)
      ar_Channels[i]=ar_Channels[i+1];
If the array had only one object before the function start, the array is released. Otherwise it is reduced by one element.
   if(total==1)
     {
      ArrayFree(ar_Channels);
      return true;
     }
   return (ArrayResize(ar_Channels,total-1)>0);
  }
The full code of the Expert Advisor is attached below.
4. Testing the Expert Advisor
4.1. The H1 Timeframe
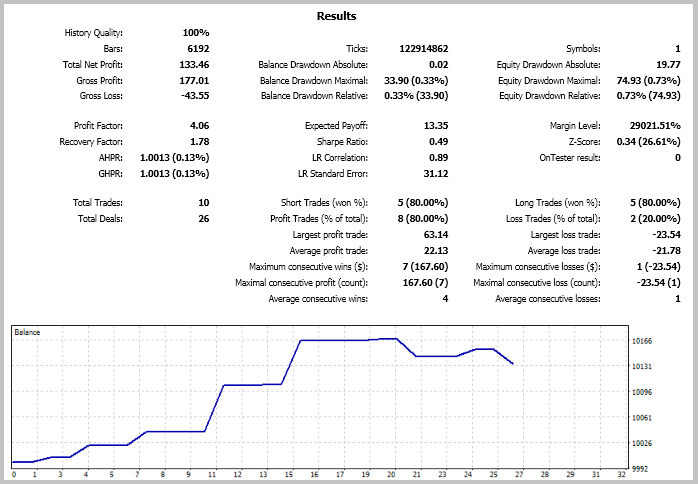
Such strategies are believed to work better on higher timeframes, since these timeframes are more static and less subject to accidental noise. Therefore the first testing was performed on the H1 timeframe. Testing was performed on EURUSD data for 2017 without preliminary optimization of parameters.

The very first test showed that the strategy is able to make a profit. The EA performed only 26 trades which resulted in 10 open positions during the tested period. 80% of open positions were closed with profit. This gave a smooth growth of balance. Profit-factor according to the testing results was 4.06. It is a good result.
But 10 positions per year are not enough. In order to increase the number of trades, I decided to test the EA on a smaller timeframe without changing its parameters.
4.2. he M1 Timeframe
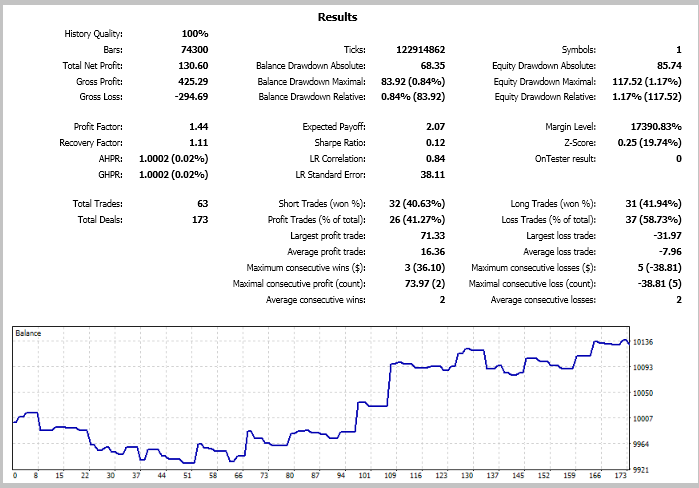
The second testing was performed on the M15 timeframe with the same parameters.

The number of trades increased. The EA opened 63 trades during the tested period. But this increase did not produce a qualitative result. The total profit of all operations was $130.60 compared to $133.46 on Н1. The share of profitable trades decreased almost twice, to 41.27%. The resulting balance chart is more broken, and the profit factor is 1.44, which is almost three times less than in the previous test.
4.3. Testing on Other Symbols
Testing results showed that the strategy performed better on the H1 timeframe. In order to evaluate possible strategy use on other timeframes, I additionally performed three tests. I used the H1 timeframe, the same parameters and testing period. Full testing results are available in the attachment, the main figures are shown in the table below.
| Symbol | Number of trades | Number of deals | Profitable trades, % | Profit Factor | Recovery Factor | Average position holding time, hours |
|---|---|---|---|---|---|---|
| EURUSD | 10 | 26 | 80 | 4.06 | 1.78 | 552 |
| GBPUSD | 2 | 8 | 50 | 1.47 | 0.23 | 2072 |
| EURGBP | 5 | 14 | 0 | 0.0 | -0.71 | 976 |
| USDJPY | 6 | 17 | 83 | 0.72 | -0.19 | 875 |
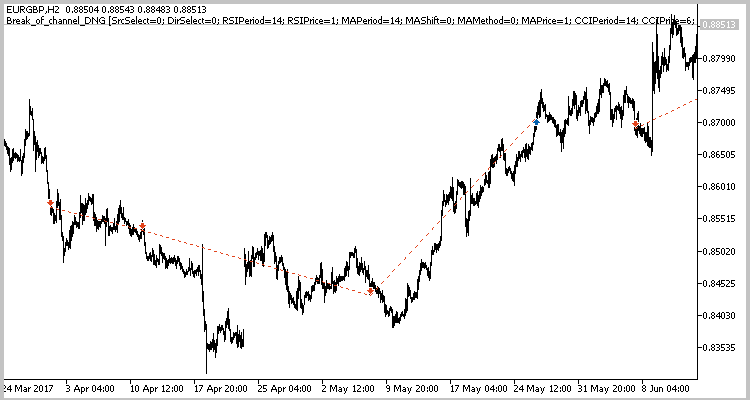
The worst results were obtained on the EURGBP pair. None of the 5 trades was closed with profit. But if we analyze the price chart, we can see lost profit potential for entries in accordance with the strategy. As can be seen in the screenshot below, the channel breakout strategy generates good entry signals. But it needs an appropriate exit strategy for a more stable operation. This is confirmed by position holding time. Tests showed, that the average position holding time is from 550 to 2100 hours, depending on the symbol. Market trends may change several times during such a long period.
Conclusions
An example of an Expert Advisor trading the channel breakout pattern is described in this article. Testing results have shown that this strategy can be used as a generator of market entry signals. Also, testing confirmed that the strategy works better on higher timeframes. However, position exit signals should be added in order to make the strategy successful. The strategy generates accurate but rare market entry signals, and these signals are not enough for timely profit fixing. This often leads to losses of floating profit and even deposit.
The Expert Advisor does not have a money management module or checks for errors, which may occur in calculations and trading operations. Therefore, the EA is not recommended for use on real accounts. However, anyone can add necessary functions to it.
References
Programs used in the article:
| # | Name | Type | Description |
|---|---|---|---|
| 1 | Break_of_channel_DNG.mq5 | Expert Advisor | An Expert Advisor for testing the strategy |
| 2 | Channel.mqh | Class library | Class searching for price channels and position opening signals |
| 3 | Break_of_channel_DNG.mqproj | Project description file | |
| 4 | iUniZigZagSW.ex5 | Indicator | Universal ZigZag |
| 5 | Reports.zip | Zip | Expert Advisor testing reports |
Translated from Russian by MetaQuotes Ltd.
Original article: https://www.mql5.com/ru/articles/4267
 Testing patterns that arise when trading currency pair baskets. Part III
 How to reduce trader's risks
 Automatic construction of support and resistance lines
 Automatic Selection of Promising Signals
- Free trading apps
- Over 8,000 signals for copying
- Economic news for exploring financial markets
You agree to website policy and terms of use