
The All or Nothing Forex Strategy
The purpose of this article is to create the most simple trading strategy that implements the "All or Nothing" gaming principle. That is an example of an Expert Advisor that implements the ForEx market lottery. The main goal of the lottery Expert Advisor is to increase the initial deposit several times with the highest possible probability. Profitability, i.e. increasing the deposit in average, is not required from the lottery Expert Advisor. In contrast to conventional lottery, which is played out by selling thousands of tickets, the lottery Expert Advisor is playing the ForEx lottery, using ForEx as a source of money in case of winning.
Introduction
The objectives of ForEx trading can be divided into three groups: Earn, Save and Multiply. Let's consider each group separately.
EARN. This is a standard goal in the ForEx market. It sounds like this: "I've got a capital and I want to increase it by trading on the market. Give me an Expert Advisor that will reliably make $101 out of $100 in a day." In goals of this type a guaranteed average increase of capital is required. The problem of "earning" is solved by an enormous amount of competitors. They are well equipped both with information and technical means. Therefore, this task is very difficult though not hopeless. Studies show that exchange rates are different from purely random. Searching for your own trading strategy is similar to searching for gold during the gold rush.
SAVE. It sounds like this: "I've got $1,000. I want to spend them on vacation next year. If I put them in the bank, then I will lose about 10 percent due to inflation. Give me an Expert Advisor that will save my money. I don't want to earn or lose money." In fact, this problem is to exchange one currency into another and back again at appropriate moments. In goals of the "SAVE" type a guaranteed average preservation of capital is required. "Preservation" of capital is solved by vast majority of our citizens. This is indicated by a large number of street currency exchange centers and multi-currency bank deposits. The task of "saving" is not mathematically sophisticated. Even if you choose the market entry and exit points accidentally, you can quite successfully win back the average inflation rate.
MULTIPLY. Goals of this type are formulated as follows: "Lottery. I have $100. To buy a car I need one million dollars more. Give me an Expert Advisor that will make $1,000,000 out of $100. I understand that on average I will lose money. The probability of winning a million is fewer than a 100/1,000,000. But it suits me."
Less aggressive formulation is as follows: "I have $1,000. To organize a party I need $10,000. Give me an Expert Advisor that will make $10,000 out of $1,000. I understand that I will lose $1,000 with a probability of slightly more than 0.9, but I will have a party with a probability of slightly less than 0.1."
Another task demanded: "In my electronic purse there are a few cents. With these money I can't neither buy anything nor withdraw cash. Give me an Expert Advisor that will even with a small probability but turn them into a meaningful amount."
In goals of this type a guaranteed average loss of capital is achieved. But this is acceptable for all. The probability of winning the lottery, of course, should be as high as possible. On the ForEx market very few are meeting this challenge consciously. However, judging by the number of lottery tickets in different offices, this problem is demanded in society. Mathematically, the "multiply" goal has long been solved. In this article we will consider the MQL5 implementation of this type of Expert Advisor.
Our classification does not include tasks such as "Game of chance - I want adrenaline", "Pretty smart toy - I want to play at my spare time" and many other delicious task.
Thus, the problem definition: we need to implement a lottery on the ForEx market. That is to increase the capital several times with some probability, or go bankrupt. The average increase of capital is not required. The probability of winning should be maximal if possible. ForEx is needed as a source of money in case of winning. ForEx is also used here as a random number generator that everyone has free access to.
1. Algorithm Idea
Proposed is the following trivial algorithm to solve the problem.
- Enter the market in a random direction.
- Wait for a given time T.
- Exit the market.
- Check your account. If we have won the lottery or have gone bankrupt, then finish the trade, otherwise - go back to Step 1.
This algorithm assumes that the exchange rate is a pure random walk (see the Random Walk and the Trend Indicator article). This market model is obviously wrong, but it is enough to create a lottery. Of course, the more adequate market models will provide a more efficient algorithm.
Before writing an Expert Advisor in MQL5 programming language, we have to detail the algorithm. We need to solve the following questions:
- Leverage
- Bet size
- Take Profit and Stop Loss levels
- Time of waiting T
- Selecting a currency pair
2. Bet and Leverage
Since we're guessing with a probability of 50/50 and we need to pay for spreads, the number of deals should be as few as possible. On each trade we lose one spread. Therefore, the amount of leverage and the bet size should be maximized in order to get the result (to win the lottery or go bankrupt) with minimum number of trades.
Generally, the maximum volume of deal on one currency pair is limited by a broker. This limits the size of the winning and minimal time of the lottery.
Calculate how long the lottery time will be stretched out. Let's assume that the maximum volume of deal is 5 lots. This means that we have $500,000 at our disposal for trading. When the trade is "lucky enough" we can win $500,000 * 0.02 = $10,000.
The 0.02 coefficient has the dimension of "profit dollars/dollar of capital in a day." This coefficient is an experimental constant for the ForEx market. It does not depend on the timeframe we are trading on (excluding spreads and swaps) and the currency pair. It can be measured based on the relative average size of bar, and knowing the drunken sailor theorem (see the the Choosing Currency Pair section and Maximal Yield Indicator graph below). The numerical value of this coefficient is approximate (may differ 2-3 times).
If we trade 100 days, the daily profit of $10,000 should be multiplied not by 100, but by the square root of 100, which is 10, so we are trading using a random walk. And in 100 days of "quite lucky" trade, we will win $100,000. And in 400 days of "quite lucky" trade, we will win $200,000. If leverage was 1:100, this means that the initial deposit was no less than $5,000 ($500,000/100).
All in all, in 100 days we have increased the initial deposit 20 times, and in 400 days - 40 times. Unfortunately, with this maximal volume of deal and initial deposit we won't get the higher speed of increasing our deposit.
If the initial deposit is small and is not enough for the maximal volume of bet, the growth speed can be much higher, up to exponential rate. But we must still find a broker who works with small deposits, and see its trading conditions.
To outwit the restriction of maximal volume, you can try to play on several currency pairs. If currency pairs are independent, we get the average and the growth speed will be less than on one currency pair. If currency pairs are correlated, such as EURUSD and EURCHF, it is possible that this restriction will be outwitted. However, the correlation of rates is not always observed.
Thus, we still can create a lottery to multiply a sufficiently big initial capital by 10. We can not solve task about electronic purse and about car for $100. At the very least, MetaTrader 5 Strategy Tester won't allow us to do it.
3. Selecting Take Profit and Stop Loss
Take Profits and Stop Losses based on random walk only increase the frequency of trades. The closer Take Profit and Stop Loss are to the opening price, the more frequently they trigger, and the greater is frequency of trades. Take Profit and Stop Loss does not directly affect the probability of winning using random walk. Because we want to make trades as few as possible, we do not place these orders.
In reality, Stop Loss still exists - this is Stop Out. Usually it triggers at 50 percent and the trading is forcibly finished. Because there are still some money on the deposit after Stop Out, it means that we have not used all the chances and could continue trading. Therefore, the Expert Advisor has to warn about the Stop Out situation. Deposit must be fully exhausted up to the minimum bet, and ideally - up to zero.
It makes sense to place Take Profit. The idea is that the real exchange rate - is not a random walk. Sometimes it has abnormally large jumps, for example, after the news. Abnormal jumps more likely have the form of spire, not the stair. You can play on this.
Figure 1. Sharp spike on the EURUSD, M1
Our algorithm can simply miss such jumps. If the spike does not happen in the direction of our last deal, and we miss it, that's good. Although the Stop Out may trigger. But if the spike happen in our direction, we grudge loosing it. To spot it, we place the Take Profit.
Take Profit can be placed in several ways: the direct, second and third ways.
Direct Way - keep track of the current price and compare it with the history prices. This is a very difficult way, even on an algorithmic level. In fact, it is necessary to identify and cut off the fat tails of the distribution of price changes.
Second Way - keep track of your current profit and compare it with the profits of previous deals. Once the profit is much larger than the average profit of previous trades - take your profit. This way is easier, but when Expert Advisor starts there is simply no history of ideals. In addition, we want to make trades as few as possible, which means that the history will be short.
Second Way (another variant) - keep track of your current profit and compare it with the expected calculated profit. Once the profit is larger than the expected calculated profit - take your profit. The expected profit can be calculated based on the price history, but it is as difficult as with the direct way.
Third Way - keep track the balance/equity ratio and compare it with the constants. Constants are determined in advance during Expert Advisor optimization. These constants of course will depend on trade conditions - leverage, maximal volume of transaction, etc. And Expert Advisor will be optimized for some specific trade conditions, that are about the same for all the brokers. Let's take the typical ones. And most importantly - this way is as simple as possible:
- If equity is greater than balance 2 (or 3) times - take your profit.
- If equity is greater than balance for $10,000 (or $30,000) - take your profit.
The specific numbers 2, 3, 10000, 30000 ... will be determined after optimization.
4. Time of Waiting T
If we are to enter and exit the market very often (for example, every minute), the rate will change little and profit we will be too little, but we still have to pay the fixed spread. The total spread will override all the profits, even if we will guess pretty well.
On the other hand, if you make deals very seldom (for example, once a year or once a month), then the spread will be negligible compared to the profit per trade. But you will have to trade for a very long time. Also, keeping a position opened for a long time is unprofitable due to swaps.
Therefore, there is some optimal frequency of deals. It depends on volatility of exchange rate and trade conditions, such as floating spread. Therefore, it is impossible to accurately calculate the optimal frequency of deals in advance.
However, it can be estimated. Without going into mathematical explanations and surveying, I will provide the following graph:
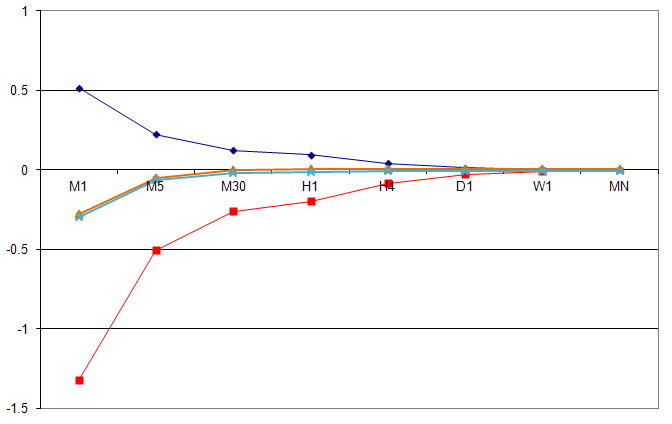
Figure 2. The boundaries and the center of the equity probability distribution function, when trading for one day with different times of T
On the graph in Figure 2 the abscissa axis shows time T - time of one trade of our trivial algorithm. The ordinates axis shows how many dollars of profit we would have from one dollar of capital by trading one day every T minutes, with no leverage and capitalization of profit on the EURUSD pair. Mathematically speaking, these are the boundaries of the probability distribution of our trivial strategy for different times T. The blue curve - for absolute guessing, red - for absolute not guessing, orange and teal - for "quite successful/unsuccessful guessing".
For example, entering and exiting the market every minute (M1), with $1 dollar of capital per day we could win maximum $0.5 and lose maximum $1.3. Most likely we would have lost $0.3. During the day we could make 1440 trades , paying $0.0002 of spread per trade. The total spread for all trades per day will be $0.288. The average size of EURUSD M1 bar is $0.00056. Winning with absolute guessing is $0.00056 * 1440 = $0.8064. Subtract the spread from of winning: $0.8064 - $0.288 = $0.51 profit from one dollar per day. Place point (М1, 0.51) on the graph.
We are interested in "fairly lucky" guess - the orange curve. Let's draw it in a bigger scale:
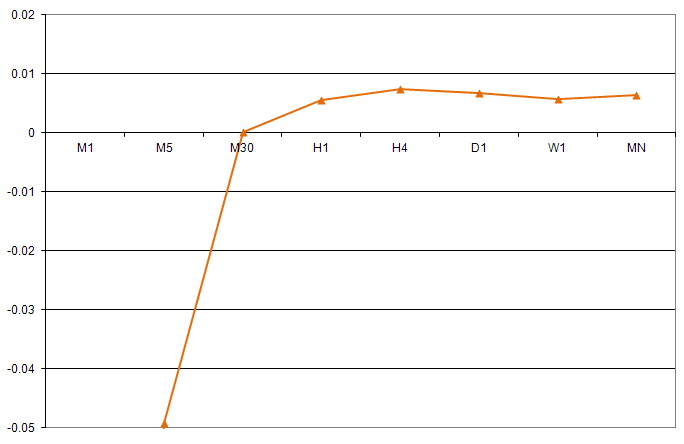
Figure 3. Profit of trivial trading strategy with sufficiently successful guessing at different times of T
Looking at Figure 3, we see that it is not profitable to trade more frequently than every 30 minutes - the spread devours all the profit. The optimal time T of trade for us lies in the range 1 hour - 1 week. Let's stop on it for now. Later on, when our EA will be finished, we will specify the optimal time using optimization. If someone has trading ideas of predicting the rate better than 50/50, then the trivial algorithm can be improved. The optimal time and optimal bet will decrease as well.
By selecting the time T, we have actually chosen the timeframe of chart we will be working on. Strictly speaking, when the time T is given, you can can choose any timeframe - EA will work the same way, but drawing on the wrong timeframe will be uncomfortable.
5. Selecting Currency Pair
Since we consider rates of all the currency pairs as random walk, among all the rates we need to choose one with the largest average relative size of bar. Then with smaller number of trades we will achieve the result (win the lottery or go bankrupt).
To do this we need to go through all the available currency pair rates and for each one of them calculate the average relative size of bar. In order not to do this manually, we will write the Maximal Yield Indicator - YieldClose.mq5.
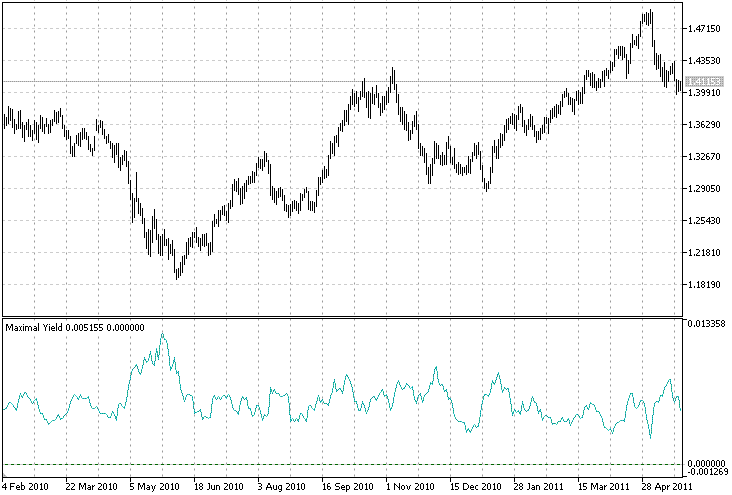
Figure 4. Maximal Yield Indicator - YieldClose.mq5 (EURUSD, D1. averaging by 10 bars. The indicator oscillates in the range of 2-3 times)
After writing this article, I have accidentally discovered that the volatility indicator (Kaufman Volatility from the Smarter Trading: Improving Performance in Changing Markets book by Perry Kaufman) included into standard delivery of MetaTrader 5 client terminal is virtually the same as the Maximal Yield Indicator. When the scope of intellect is not enough, you have to reinvent the wheel. Yes, it's hard to comprehend hundreds of indicators and Expert Advisors from the standard set! Unfortunately, there is no general textbook at this point.
It turns out that the average relative size of bar oscillates in range of 2-3 times for a single currency pair. Within these 2-3 times the average relative size of bar is the same for all the currencies. In fact, the Maximal Yield Indicator shows trading activity.
When entering the market, among all the currency pairs we need to choose one with highest trading activity, i.e. one with maximal values shown by indicator. In addition, it is better to trade during the day, when the activity is higher, and to wait out the night. Purely day trading will increase your chances of winning the lottery, but will stretch the working time of Expert Advisor almost two times. Which is better - greater chances of winning or shorter time - is up to user to decide.
As discussed above, you can trade virtually every minute, but in so doing the chances of winning will become very scanty. On the other hand, we also can't trade for years in order to maximize the probability of winning. The "time of trade/probability of winning" ratio has to be detailed at time of problem definition, but who knew that it could be so hard?
This is a typical example of how difficult is to compose requirements specification for writing an Expert Advisor. So far, in order not to complicate our EA let's focus on continuous single-currency trading on the well-known EURUSD pair.
At the same time note two interesting properties of the indicator.
- On the H1 timeframe indicator shows daily oscillations of trading activity (volatility) (see Figure 5).
- The indicator maxima correspond to the end/beginning of trends or flat (see Figure 6).
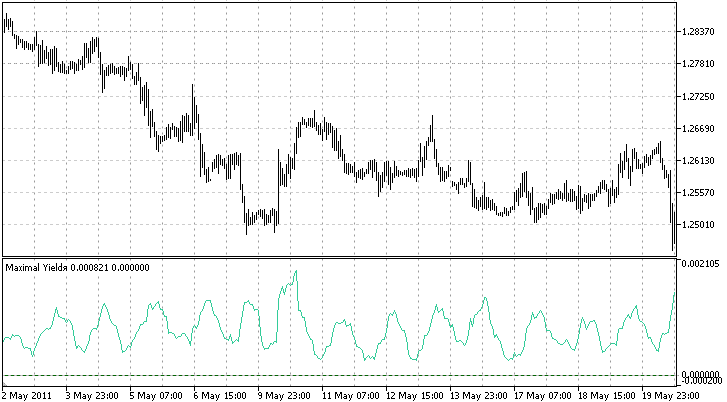
Figure 5. Maximal Yield Indicator shows daily oscillations of trading activity (EURCHF, H1, averaging by 10 bars)
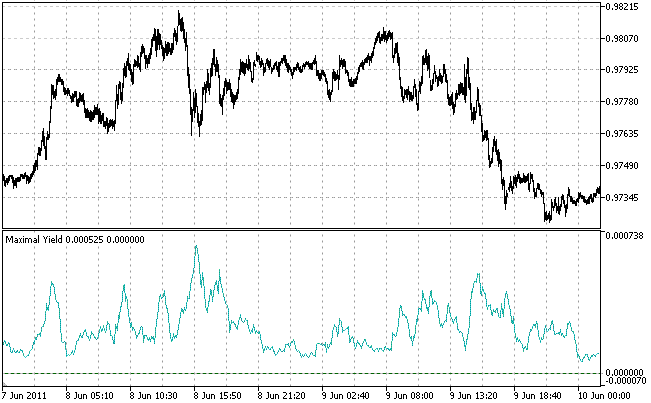
Figure 6. The Maximal Yield Indicator maxima correspond to the beginning/end of trend/flat (USDCAD, M5, averaging by 10 bars)
An idea for future use: if indicator (market activity) begins to increase above its average value, then close profitable positions and leave the unprofitable ones - the market is changing. If indicator falls below its average, then leave profitable positions and close the unprofitable ones - in nearest future market won't change. But this idea requires a separate study.
Implementation of well developed algorithm in the MQL5 language requires technical skills. You can find the EA code with comments in attachment to this article (lottery.mq5).
6. Expert Advisor Optimization
EA has to be optimized for specific trading conditions available in Strategy Tester: initial deposit - $5,000, leverage - 1:100, date - 1 year, lottery winning - $100,000, maximal bet - 5 lots, currency pair - EURUSD, Stop Out level - 50%.
Optimization of Expert Advisors, proposed in the MetaTrader 5 client terminal, does not suit us. Indeed, during optimization we need to maximize the probability of winning the lottery. To do this, we must run EA on 1000 different pieces of history and calculate the winnings/losses ratio. Running EA on a single piece of history makes no sense: it will give us either winning or loss, the state of balance is known in advance - either $0 or $100,000.
Running EA manually on 1000 pieces of history is boring, so we will go another way. To determine direction of entering the market, our EA uses the random number generator that creates a random buy/sell sequence. Let's run EA with 1000 different buy/sell sequences on one piece of history. Of course, this is not the same as 1000 different pieces of history, but very similar.
In order to optimize some parameter, such as the time T, for each value of T we are running 1000 different buy/sell sequences and determine the probability of winning. To do this, select the Slow complete algorithm of optimization by two parameters: the time T and the number of lucky ticket, i.e. number of random sequence.
Export the optimization results to Excel and draw the graph:
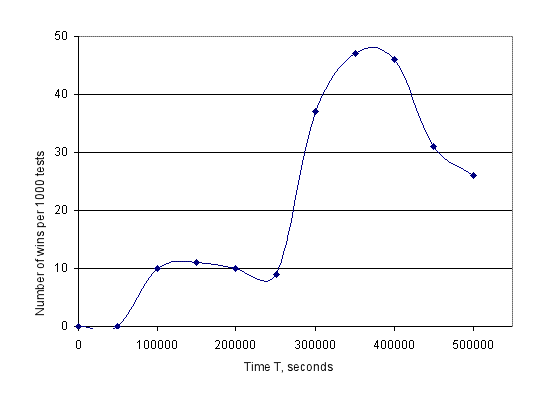
Figure 7. Probability of winning the lottery, depending on the time T. The abscissa axis - trivial strategy timeout, i.e. time of one trade. The ordinate axis - probability of winning with such time T.
Looking at Figure 7, we determine the optimal time T. The maximum probability of winning corresponds to the approximate time T = 350 000 seconds. The graph is similar to the theoretical estimation above on the Figure 3 - with small values of T the probability of winning is virtually zero. The form of the graph depends on the history period and length. The graph always falls down to big values of time about 500 000 seconds.
To determine the optimal values of Take Profit we observe the graph of balance and equity, trying Take Profit to trigger only on enormously large emissions of equity. Optimization of the Take Profit constants by the maximal balance makes no sense: big emissions happen very seldom, maybe once per all the time of EA functioning, and even more rarely. If we run optimization by the maximal balance, it will simply adjust to this given piece of history.
7. Checking Expert Advisor
To determine the EA quality, we will run it with 10 000 different buy/sell sequences. Open the table with optimization results in Excel, then calculate and draw the winning/loosing ratio.
From the results of measurements, our Expert Advisor wins the lottery (gaining more than $100,000) with probability of 0.045 and the theoretical limit of 0.05. Expert Advisor loses the lottery (gains less than $150) with probability of 0.88. The remaining probability of 0.075 corresponds to the balance values between $150 and $100,000. With probability of 0.1 Expert Advisor gains more equity than the initial deposit of $5000.
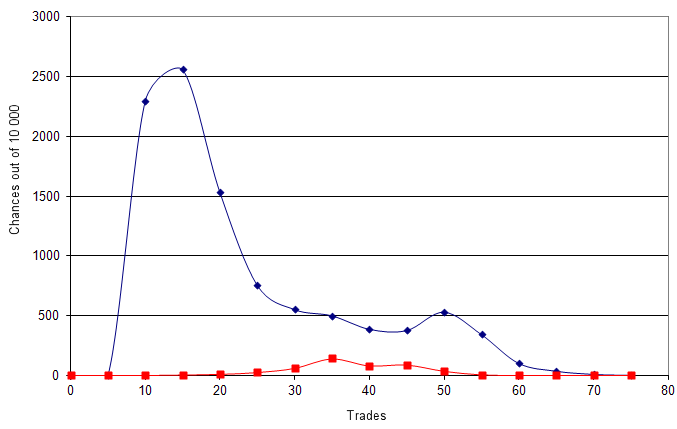
Figure 8. Lottery time. The abscissa axis - number of trades. The ordinate axis - probability of win the lottery for a given number of trades.
Figure 8 shows the curves that demonstrate the probability of winning and losing, depending on the number of trades. The blue curve - the number of trades in the general case, the red curve - the number of trades in case of winning. In general, the lottery ends up losing in 20 trades (2 months, 1 trade = 350 000 seconds). Lottery may take up to six months or more (60-70 trades). Winnings are the most likely during 3-5 month of lottery (30-50 trades, red curve).
Conclusion
We have created the lottery Expert Advisor optimized for specific trading conditions. EA is written in the simplest way of all the possible options. Pros and cons of the lottery Expert Advisor are obvious.
Pros:
- You can play the lottery alone. No need to sell millions of tickets.
- You can select the ratio of ticket price (initial deposit) and winning.
- The probability of winning is known in advance and is close to the theoretical limit.
- Win results can be checked for integrity on ForEx history available for free.
Cons:
- Very long time of the lottery - a few months. Time is limited by trading conditions.
- Possible "ticket price"/"winning" ratio is little - about 1:10.
- Big initial deposit is required.
Despite the best efforts of developers, the implementation of even a trivial algorithm requires a non-trivial ingenuity, knowledge of mathematics and MQL5 language. But, thanks to the efforts of developers, the implementation is still possible.
Translated from Russian by MetaQuotes Ltd.
Original article: https://www.mql5.com/ru/articles/336
 Securing MQL5 code: Password Protection, Key Generators, Time-limits, Remote Licenses and Advanced EA License Key Encryption Techniques
 Using Discriminant Analysis to Develop Trading Systems
 Promote Your Development Projects Using EX5 Libraries
 Speed Up Calculations with the MQL5 Cloud Network
- Free trading apps
- Over 8,000 signals for copying
- Economic news for exploring financial markets
You agree to website policy and terms of use
This very interesting article.
It is actually a different approach to most seen around, where the objective is always to obtain a positive expectation. It would be interesting to analyze how the probability of winning in this lottery is modified as technical analysis kicks in (or, in other words, how we can become an "informed" lottery player, which knows, for instance, that some balls have different weighs and so their probability is not exactly the same)