
The Price Histogram (Market Profile) and its implementation in MQL5

"Market Profile tries to provide this internal logic in the context of the market.
It is a method of analysis that starts off with the understanding that price alone
does not communicate information to the participant, just as words without syntax
or context may have no meaning. Volume is an integral part of the direct expression
of the market - understand it and you understand the language of the the market."
Robin Mesh
Introduction
A long time ago, looking through a magazines subscription I have found an article "Market Profile and understanding the market language" (October, 2002) in the Russian journal "Valutny Spekulant" (At present time it called as "Active Trader"). The original article has been published in "New Thinking in Technical Analysis: Trading Models from the Masters".
The Market Profile was developed by trully brilliant thinker Peter Steidlmayer. He found the natural expression of the market (volume) and organized it in a way that is readable (the bell curve), so that objective information generated by the market is accessible to market participiants. Steidlmayer has suggested to use the alternative representation of information about "horizontal" and "vertical" market movements that leads to completely different set of models. He assumed that there is an underlying pulse of the market or a fundamental pattern called the cycle of equilibrium and disequilibrium.
Market Profile measures the horizontal market movement through the vertical one. Let's call that "equillibrium" through "disequillibrium". This relationship is the fundamental organizing principle of the market. A trader's whole style of trading may change depending on what part of the equilibrium/disequilibrium cycle the market is in. Market Profile can determine both when the market is going to shift from equilibrium to disequilibrium and how big the move is going to be.
The two basic concepts of Market Profile are:
- The market is an auction, and it moves in the direction of the price range where the supply and demand are more or less equal.
- The market has two phases: horizontal activity and vertical activity. The market moves vertically when supply and demand are not equal or they are in disequillibrium, and horizontally when they are in equilibrium or balanced.
The equilibrium market shown using the Market Profile in the chart below tends to form an almost perfect bell-shaped curve, rotated by 90 degrees because of the orientation of the chart:
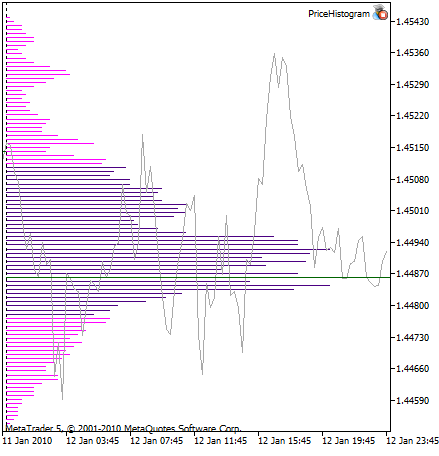
Fig 1. The Market Profile of equilibrium market
The trend, non-equilibrium market also forms a bell-shaped curve, but its center is shifted up or down. Other configurations that form two peaks of bells ,depending on the price movement and the confidence of market players, are possible.
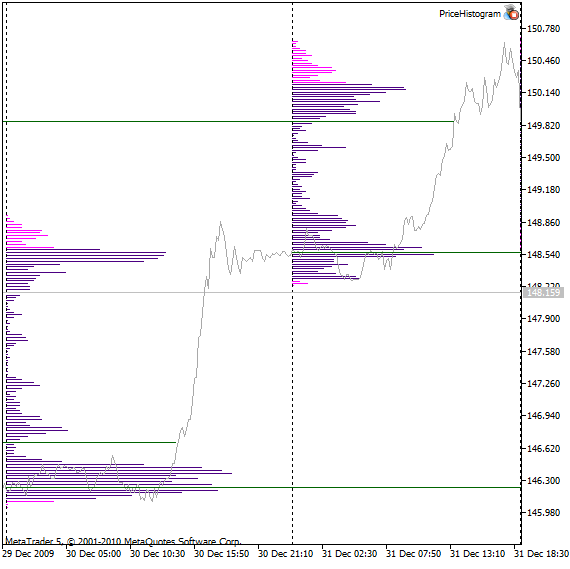
Fig 2. The Market Profile of disequilibrium (trend) market
Use of the daily profile shapes to determine the degree of balance/imbalance level of the market can be useful, because it gives you a starting point in understanding the shifts of between various market participants.
A trading opportunity with the greatest benefit appears when the shift from balance to imbalance is about to occur. Moreover, if you can identify that trading opportunity and accurately estimate the potential magnitude of that shift, then you can estimate the quality of that trade and the amount of time that is necessary for it.
You can find the example of methodology of working with this tool can be found at http://www.enthios.com/, where a group of traders has studied the Price Histrogram since 1998. The Enthios Universal strategy and example of its use you can also be found there.
1. Price Histogram
The Price Histogram is a very reliable tool. It's a bit intuitive but extremely effective. The price histogram simply shows you the "most convenient" trading points of the market. This is aa leading indicator, because it shows the points where market can change its direction in advance. The indicators like moving averages or oscillators cannot specify the exact points of resistance and support, they can only show the fact whether the market is overbought or oversold.
Usually, the Price Histogram (or Market Profile) is applied to 30 min. price charts to study the market activity during one day. I prefer to use the 5 min. charts for stock markets and 15-30 min. charts for FOREX.
2. Point of Control
In the figure above you can see the level where the market was traded the maximum amount of time; it's outlined with the longest line in the histogram. It's called the Point of Control, or POC. Sometimes, as it seen in the figure, the histogram has two tops, one of them is a little bit lower. In such case, we see that the indicator shows just one POC, but in fact there are two of them, and it should be taken into the account.
In addition, the percentage level of the range in the histogram also creates additional levels, so called Secondary POC levels:
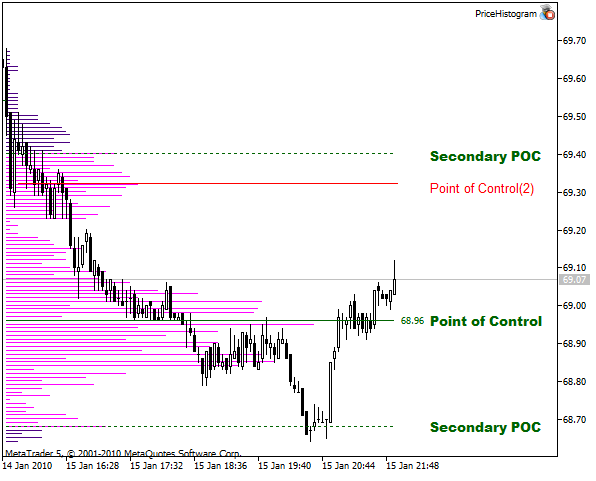
Fig 3. Points of control
What does POC show? The price that is remembered by most of traders. The longer market is traded at this price, the longer market remembers it.
Psychologically POC acts as a center of attraction.
The next chart shows what happened a few days earlier. It's a good demonstration of power of the Price Histogram.

Fig 4. The Point of Control isn't absolute; it shows the range of trade
The Point of Control isn't absolute; it indicates the range of trading. Thus, the trader should be ready to act when the market approaches to POC. It helps to optimize orders, using the historical observations.
Let's consider the Fig. 4. The POC on 29.12.2009 is located at price 68.87. It is clear even without the histogram and POC line that the market was within the 68.82~68.96 range almost all the day. The market closed at the end of the day at 5 points below the POC. On the next day it caused the opening of the market with a gap down.
It's important to understand that we can't predict whether the market will go up or down. We can only suppose that the market will return to the POC line and to the maximal accumulation of the histogram lines. But what will happen when the price touches the POC? The same thing that happens with an elastic object that falls to the ground, it will jump back. If it happens quickly, like a tennis ball stroke back with a racket, the price will return very quickly back to the initial level.
After the market opening on 30.12.2009 we see that it was a gap and then market touched the POC of the previous day, and then quickly returned to the open price and updated the minimum.
Note that POC is not absolutely accurate (experienced traders know that there is no clear resistance levels when the price reaches a maximum, minimum or concentration range). What happens at this point depends on the market players. If the collective desire (for example, news publication) coincides, then market will pass through the POC, but it's rare and it can be used to develop a trading system.
Pay attention that the market behavior was the same on 31.12.2009. When the price touched POC, the buyers yielded to the sellers.
3. Virgin Point of Control
The Virgin POC (Virgin Point of Contro) is a level that price hasn't reached in the next days.
The logics is simple, as described above, the POC is an attraction point for the market. As the price moves away from the POC, the force of attraction increases. And the more the price goes away from the Virgin POC, the greater is the possibility that when it returns to this level the rebounce will occur and probably a price reverse will occur as well.
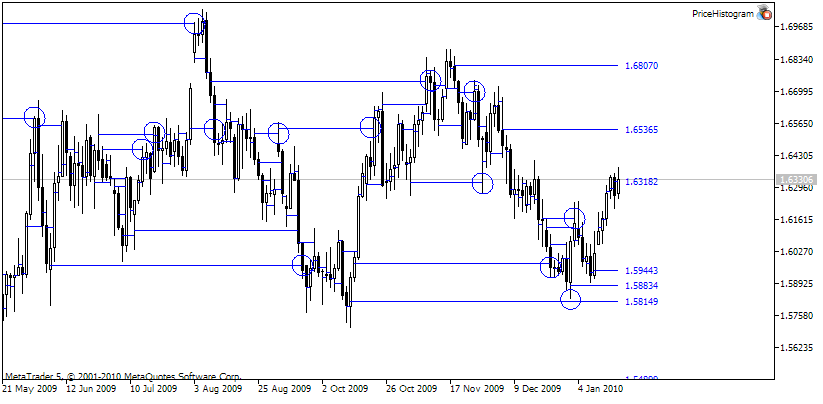
Fig 5. Former and current Virgin POC
At Fig. 5 the former Virgin POCs that were the support and resistance levels are marked with circles. The working Virgin POC are marked with price values.
Once the price has touched the Virgin POC, it ceases to be a "virgin". Psychologically, the market no longer sees it as a substantial level of support or resistance. The traders still can see the price levels, which initially has formed the POC, but as a simple accumulation of prices.
4. Price Histogram Implementation in MQL5
My first version of Price Histogram appeared in 2006 it was written in MQL4 in MetaTrader4 for personal use. During the development of this indicator I faced some troubles, here are some of them:
- very short number of bars in history for M5, not to speak of M1;
- the necessity to develop special functions for working with histrory, such as returning back by one day considering holidays, checking for the market close time on Friday, checking for the open and close time for CFD market, etc;
- recalculation of indicator when changing timeframes and, as a result, terminal delays.
Therefore when beta-testing of МetaТrader5 and MQL5 has started, I have decided to convert it to MQL5.
As people say, "the first pancake is always a bit tricky", I have tried to implement it as an indicator.
Let's start with the good: the presence of the long history of minute
quotes for all symbols, the possibility of historical data obtaining for a certain time period at any time range.
Now I will explain why it has turned out. I haven't considered the features of the MQL5 indicators:
- the indicator's runtime is critical;
- the features of the indicator's work after the timeframe changes.
The execution of function OnCalculate(), which corresponds to Calculate event handler has a critical runtime. Accordingly, the processing of 260 days (annual period) using the minute bars history takes a long time, up to several minutes. Of course we can accept it, if the calculations performed at once after the indicator attaching to the chart. But this isn't the case for the timeframe changes. When indicator switches to the different timeframe, the old copy of the indicator is destroyed and created the new one. That's why after the timeframe changes we have to recalculate the same levels again and it spends a lot of time.
But as saying, if you don't know what to do - "Read the documentation first", in our case, it's the documentation of MQL5. The solution was very simple - to implement this indicator as Expert Advisor which doesn't trade.
The advantages of Expert Advisor are:
- the processing time isn't critical for Init event handler in OnTick ();
- the possibility to obtain the parameters of the handler OnDeinit (const int reason).
The Expert Advisors are differing from the indicators the following: after the timeframe change the expert advisor just generates the DeInit event with REASON_CHARTCHANGE reason parameter, it doesn't unload the Expert Advisor from memory and serves the values of global variables. It allows us to perform all calculations at once after Expert Advisor attaching, changing its parameters and new data appearing, in our case for a new trading day.
Let's introduce some definitions that will be needed later.
The Object-oriented programming (OOP) - is a style of programming which basic concepts are the concepts of objects and classes.
The Object is an entity in the virtual space, with specified state and behavior; it has some values of properties (called as attributes) and operations with them (called as methods).
In OOP the Class is a special abstract data type, characterized by means of its construction. The class is a key concept in OOP. The class is differing from the other abstract data types. The data definition in class also contains class methods of its data processing (interface).
In programming there is a software interface concept that means a list of possible computations that can be performed by some part of the program, including algorithms, description of arguments and order of input parameters to proceed and its return values. The abstract data type interface has been developed for a formalized description of such a list. The algorithms itself and the code that will perform all these calculations aren't specified and called as interface implementation.
The class creation is creation of some structure with fields and methods. The entire class can be considered as a template for the objects creation, which are class instances. The class instances are created using the same template, so they have the same fields and methods.
Let's get started...
The source code is located in 4 files. The main file is PriceHistogram.mq5, the other files are: ClassExpert.mqh, ClassPriceHistogram.mqh and ClassProgressBar.mqh. The files with .mqh extension contain the classes' description and methods. All files must be located in the same directory, My directory is: \MQL5\ Experts\PriceHistogram.
4.1. PriceHistogram.mq5
The first statement in the source code is:
#include "ClassExpert.mqh"
The #include compiler directive includes the text from the specified file. In our case it is description of class CExpert (discussed below).
The next one is a block of input variables which are parameters of Expert Advisor.
// The block input parameters
input int         DayTheHistogram   = 10;          // Days for histogram
input int         DaysForCalculation= 500;         // Days for calculation(-1 all)
input uint        RangePercent      = 70;          // Percent range
input color       InnerRange        =Indigo;       // Inner range
input color       OuterRange        =Magenta;      // Outer range
input color       ControlPoint      =Orange;       // Point of Control
input bool        ShowValue         =true;         // Show Values
After that the variable ExtExpert (of CExpert class type) is declared.
The next is the standard event handlers which are in MQL5-programs. The event handlers call for the corresponding methods of CExpert class.
int OnInit()
  {
//---
// We check for symbol synchronization before the start of calculations
   int err=0;
   while(!(bool)SeriesInfoInteger(Symbol(),0,SERIES_SYNCRONIZED) && err<AMOUNT_OF_ATTEMPTS)
     {
      Sleep(500);
      err++;
     }
// CExpert class initialization
   ExtExpert.RangePercent=RangePercent;
   ExtExpert.InnerRange=InnerRange;
   ExtExpert.OuterRange=OuterRange;
   ExtExpert.ControlPoint=ControlPoint;
   ExtExpert.ShowValue=ShowValue;
   ExtExpert.DaysForCalculation=DaysForCalculation;
   ExtExpert.DayTheHistogram=DayTheHistogram;
   ExtExpert.Init();
   return(0);
  }
When I wrote the first version of the Expert Advisor and run it, I have some trouble with understanding why it terminates with error after the client terminal restart or a symbol changes. And it occurs when the client terminal was disconnected or a symbol hasn't used for a long time.
It's great that developers have added the debugger to MetaEditor5. I remember a lot of Print() and Comment() commands, used for checking of values of variables in MetaEditor4. Many thanks to MetaEditor5 developers.
In my case, everything was easy; the expert starts before connection to server and update of the historical data. To resolve this problem, I had to use the SeriesInfoInteger(Symbol(),0,SERIES_SYNCRONIZED), which reports that data is synchronized or not, and the cycle while (), the case of the connection absence it uses the counter variable err.
Once the data has been synchronized, or the cycle has completed because of the counter in the absence of connection, we pass the input parameters of our expert class CExpert, and call the class initialization method Init ().
As you see, thanks to classes concept in MQL5, our file PriceHistogram.mq5 has transformed into a simple template, and all further processing is in the CExpert class, declared in the file ClassExpert.mqh.
4.2. ClassExpert.mqh
Let's consider its description.
//+------------------------------------------------------------------+
//|   Class CExpert                                                  |
//|   Class description                                              |
//+------------------------------------------------------------------+
class CExpert
  {
public:
   int               DaysForCalculation; // Days to calculate (-1 for all)
   int               DayTheHistogram;    // Days for Histogram
   int               RangePercent;       // Percent range
   color             InnerRange;         // Internal range color
   color             OuterRange;         // Outer range color
   color             ControlPoint;       // Point of Control (POC) Color
   bool              ShowValue;          // Show value
The public section is open and accessible from the outside variables. You'll notice that names of the variables coincide with names of the input parameters section described in PriceHistogram.mq5. It isn't necessary because the input parameters are global. But in this case - is a tribute to the good breeding rules, it's desirable to avoid using of external variables within the class.
private:
   CList             list_object;        // The dynamic list of CObject class instances
   string            name_symbol;        // Symbol name
   int               count_bars;         // Number of daily bars
   bool              event_on;           // Flag of events processing
The private section is closed from the outside and accessible only within the class. I would like to outline the variable list_object of CList type, which is a class of the standard MQL5 library. The CList Class is a dynamic class with a list of instances of CObject class and its heirs. I will use this list for the references storage for the CPriceHistogram class elements, which is an heir of the CObject class; we'll consider the details below. The CList class description is in the List.mqh, and it includes by using the compiler directive #include <Arrays\List.mqh>.
public:
   // Class constructor
                     CExpert();
   // Class destructor
                    ~CExpert(){Deinit(REASON_CHARTCLOSE);}
   // Initialization method
   bool              Init();
   // Deinitialization method
   void              Deinit(const int reason);
   // Method of OnTick processing
   void              OnTick();
   // Method of OnChartEvent() event processing
   void              OnEvent(const int id,const long &lparam,const double &dparam,const string &sparam);
   // Method of OnTimer() event processing
   void              OnTimer();
};
The following is a public methods section. As you have guessed these methods (functions) are available outside the class.
And finally the brace with a semicolon completes the class description.
Let's consider class methods in detail.
The class constructor is a special block of statements, called when the object is created. Constructor is similar to the method, but differs from method that it hasn't explicitly a certain type of returned data.
In MQL5 language, the constructors can't have any input parameters, and each class should have an only one constructor. In our case, the constructor is a primary initialization of variables.
The destructor is a special class method that used for the object deinitialization (eg, free memory). In our case the method is called as Deinit (REASON_CHARTCLOSE);
The Init() is a method for the class initialization. This is the most important method of CExpert class; the
creation of histogram objects has performed there. Please look at the comments for the details. But I would like to consider there points.
The first, to build up a daily Price Histogram we need the open time data for days to proceed. Here I would like to digress and draw your attention to the features of working with time series. For the data request from the other timeframes we needed a time, so the functions Bars () and CopyTime (), as well as other functions to work with timeseries aren't always return the desired data from the first call.
So I had to put this function in the do (...) while () loop, but to make it finite, I have used the counter variable.
 int err=0;
 do
   {
    // Calculate the number of days which available from the history
    count_bars=Bars(NULL,PERIOD_D1);
    if(DaysForCalculation+1<count_bars)
       count=DaysForCalculation+1;
    else
       count=count_bars;
    if(DaysForCalculation<=0) count=count_bars;
    rates_total=CopyTime(NULL,PERIOD_D1,0,count,day_time_open);
    Sleep(1);
    err++;
   }
 while(rates_total<=0 && err<AMOUNT_OF_ATTEMPTS);
 if(err>=AMOUNT_OF_ATTEMPTS)
   {
   Print("There is no accessible history PERIOD_D1");
   name_symbol=NULL;
   return(false);
   }
Secondly, the minute history of MetaTrader 5 is equal to the days available, so it can take a lot of time to proceed, so it's necessary to visualize the calculation process. The class CProgressBar (#include "ClassProgressBar.mqh") has been developed for this purpose. It creates the progress bar in the chart window and updates it during the calculation process.
 // We create the progress bar on the char to shot the loading process
 CProgressBar   *progress=new CProgressBar;
 progress.Create(0,"Loading",0,150,20);
 progress.Text("Calculation:");
 progress.Maximum=rates_total;
The third, in cycle, using the "new" statement, we create the CPriceHistogram object, configure it using its methods and initialize it by calling the Init(). If successful, we add it to the list_object list, overwise we delete the hist_obj by using delete statement. The CPriceHistogram class description will presented further, see comments in the code.
 // In this cycle there is creation of object CPriceHistogram
 // its initialization and addition to the list of objects
 for(int i=0;i<rates_total;i++)
   {
    CPriceHistogram  *hist_obj=new CPriceHistogram();
    //         hist_obj.StepHistigram(step);
    // We set the flag to show text labels
    hist_obj.ShowLevel(ShowValue);
    // We set POCs colour
    hist_obj.ColorPOCs(ControlPoint);
    // We set colour for inner range
    hist_obj.ColorInner(InnerRange);
    // We set colour for outer range
    hist_obj.ColorOuter(OuterRange);
    // We set the percent range
    hist_obj.RangePercent(RangePercent);
    //  hist_obj.ShowSecondaryPOCs((i>=rates_total-DayTheHistogram),PeriodSeconds(PERIOD_D1));
    if(hist_obj.Init(day_time_open[i],day_time_open[i]+PeriodSeconds(PERIOD_D1),(i>=rates_total-DayTheHistogram)))
       list_object.Add(hist_obj);
    else
       delete hist_obj; // Delete object if there was an error
    progress.Value(i);
   };
The OnTick() is a method called when you receive a new tick for a symbol. We comparing the values of the number of days stored in the variable count_bars with the number of daily bars returned by Bars (Symbol (), PERIOD_D1) and if they are not equal we forcedly call the method Init () for the class initialization, clearing the list list_object and changing the variable to NULL name_symbol . If the number of days has not changed, the loop goes through all objects stored in the class CPriceHistogram list_object, and execute a method Redraw (), for those who are Virgin ( «virgin").
The Deinit() is a method for class deinitialization. In the case of REASON_PARAMETERS (input parameters were changed by the user) we clear the list_object list and set name_symbol variable to NULL. In other cases, the expert doesn't do anything, but if you want to add something, read the comments.
The OnEvent() is a method for event processing of the client terminal. Events are generated by the client terminal when user working with chart. The details can be found in the documentation of MQL5 language. In this Expert Advisor the chart event CHARTEVENT_OBJECT_CLICK has been used. By clicking on histogram element the it shows the secondary POC levels and inverses the histogram color.
The OnTimer(void) is a method for timer events processing. It doesn't used in my programs, but if you want to add some timer actions (for example, to show the time) - it's here. Before use it's necessary to add the following line to the class constructor:
EventSetTimer(time in seconds);
And the following line to the destructor:
EventKillTimer();
before calling the method Deinit (REASON_CHARTCLOSE).
iWe have considered the CExpert class;it has been created for the demonstration of the CPriceHistogram class methods.
//+------------------------------------------------------------------+
//|   Class CPriceHistogram                                          |
//|   Class description                                              |
//+------------------------------------------------------------------+
class CPriceHistogram : public CObject
  {
private:
   // Class variables
   double            high_day,low_day;
   bool              Init_passed;      // Flag if the initialization has passed or not
   CChartObjectTrend *POCLine;
   CChartObjectTrend *SecondTopPOCLine,*SecondBottomPOCLine;
   CChartObjectText  *POCLable;
   CList             ListHistogramInner; // list for inner lines storage
   CList             ListHistogramOuter; // list for outer lines storage
   bool              show_level;         // to show values of level
   bool              virgin;             // is it virgin
   bool              show_second_poc;    // show secondary POC levels
   double            second_poc_top;     // value of the top secondary POC level
   double            second_poc_bottom;  // value of the bottom secondary POC level
   double            poc_value;          // POC level value
   color             poc_color;          // color of POC level
   datetime          poc_start_time;
   datetime          poc_end_time;
   bool              show_histogram;     // show histogram
   color             inner_color;        // inner color of the histogram
   color             outer_color;        // outer color of the histogram
   uint              range_percent;      // percent range
   datetime          time_start;         // start time for construction
   datetime          time_end;           // final time of construction
public:
   // Class constructor
                     CPriceHistogram();
   // Class destructor
                    ~CPriceHistogram(){Delete();}
   // Class initialization
   bool              Init(datetime time_open,datetime time_close,bool showhistogram);
   // To level value
   void              ShowLevel(bool show){show_level=show; if(Init_passed) RefreshPOCs();}
   bool              ShowLevel(){return(show_level);}
   // To show histogram
   void              ShowHistogram(bool show);
   bool              ShowHistogram(){return(show_histogram);}
   // To show Secondary POC levels
   void              ShowSecondaryPOCs(bool show){show_second_poc=show;if(Init_passed)RefreshPOCs();}
   bool              ShowSecondaryPOCs(){return(show_second_poc);}
   // To set color of POC levels
   void              ColorPOCs(color col){poc_color=col; if(Init_passed)RefreshPOCs();}
   color             ColorPOCs(){return(poc_color);}
   // To set internal colour of histogram
   void              ColorInner(color col);
   color             ColorInner(){return(inner_color);}
   // To set outer colour of histogram
   void              ColorOuter(color col);
   color             ColorOuter(){return(outer_color);}
   // To set percent range
   void              RangePercent(uint percent){range_percent=percent; if(Init_passed)calculationPOCs();}
   uint              RangePercent(){return(range_percent);}
   // Returns value of virginity of POC level
   bool              VirginPOCs(){return(virgin);}
   // Returns starting time of histogram construction
   datetime          GetStartDateTime(){return(time_start);}
   // Updating of POC levels
   bool              RefreshPOCs();
private:
   // Calculations of the histogram and POC levels
   bool              calculationPOCs();
   // Class delete
   void              Delete();
  };
In the description of the class, I tried to provide comments for class variables and methods. Let's consider some of them in details.
//+------------------------------------------------------------------+
//|   Class initialization                                           |
//+------------------------------------------------------------------+
bool CPriceHistogram::Init(datetime time_open,datetime time_close,bool showhistogram)
This method uses three input parameters - the opening of the building, the closing time of construction and a flag indicating to construct a histogram, or only the levels of POCs.
In my example (class CExpert) input parameters are passed at the opening day and time of opening the next day day_time_open [i] + PeriodSeconds (PERIOD_D1). But when you use this class, nothing prevents to ask, for example, the time of European, American session, or the gap size in the week, month, etc.
//+---------------------------------------------------------------------------------------+
//|   Calculations of the histogram and POCs levels                                       |
//+---------------------------------------------------------------------------------------+
bool CPriceHistogram::calculationPOCs()
In this method, the origin of all levels and the calculations of their construction, it is a closed private method, inaccessible from the outside.
// We get the data from time_start to time_end
   int err=0;
   do
     {
      //--- for each bar we are copying the open time
      rates_time=CopyTime(NULL,PERIOD_M1,time_start,time_end,iTime);
      if(rates_time<0)
         PrintErrorOnCopyFunction("CopyTime",_Symbol,PERIOD_M1,GetLastError());

      //--- for each bar we are copying the High prices
      rates_high=CopyHigh(NULL,PERIOD_M1,time_start,time_end,iHigh);
      if(rates_high<0)
         PrintErrorOnCopyFunction("CopyHigh",_Symbol,PERIOD_M1,GetLastError());

      //--- for each bar we are copying the Low prices
      rates_total=CopyLow(NULL,PERIOD_M1,time_start,time_end,iLow);
      if(rates_total<0)
         PrintErrorOnCopyFunction("CopyLow",_Symbol,PERIOD_M1,GetLastError());

      err++;
     }
   while((rates_time<=0 || (rates_total!=rates_high && rates_total!=rates_time)) && err<AMOUNT_OF_ATTEMPTS&&!IsStopped());
   if(err>=AMOUNT_OF_ATTEMPTS)
     {
      return(false);
     }
   poc_start_time=iTime[0];
   high_day=iHigh[ArrayMaximum(iHigh,0,WHOLE_ARRAY)];
   low_day=iLow[ArrayMinimum(iLow,0,WHOLE_ARRAY)];
   int count=int((high_day-low_day)/_Point)+1;
// Count of duration of a finding of the price at each level
   int ThicknessOfLevel[];    // create an array for count of ticks
   ArrayResize(ThicknessOfLevel,count);
   ArrayInitialize(ThicknessOfLevel,0);
   for(int i=0;i<rates_total;i++)
     {
      double C=iLow[i];
      while(C<iHigh[i])
        {
         int Index=int((C-low_day)/_Point);
         ThicknessOfLevel[Index]++;
         C+=_Point;
        }
     }
   int MaxLevel=ArrayMaximum(ThicknessOfLevel,0,count);
   poc_value=low_day+_Point*MaxLevel;
First, we get the minute bars history data for a certain period of time (iTime [], iHigh[], iLow[]). Then we find the maximum and minimum element of iHigh[] iand Low[]. Then we calculate the number of points (count) from minimum to maximum, and reserve the array ThicknessOfLevel with ThicknessOfLevel elements. In the cycle we go through the each minute candle from Low to High, and adding the data of the time period presence at this price level. Then we find the maximal element of the ThicknessOfLevel array, it will be the level at which price was the longest time. This is our POC level.
// Search for the secondary POCs
   int range_min=ThicknessOfLevel[MaxLevel]-ThicknessOfLevel[MaxLevel]*range_percent/100;
   int DownLine=0;
   int UpLine=0;
   for(int i=0;i<count;i++)
     {
      if(ThicknessOfLevel[i]>=range_min)
        {
         DownLine=i;
         break;
        }
     }
   for(int i=count-1;i>0;i--)
     {
      if(ThicknessOfLevel[i]>=range_min)
        {
         UpLine=i;
         break;
        }
     }
   if(DownLine==0)
      DownLine=MaxLevel;
   if(UpLine==0)
      UpLine=MaxLevel;
   second_poc_top=low_day+_Point*UpLine;
   second_poc_bottom=low_day+_Point*DownLine;
The next step is to find the secondary POC levels. Recall that our diagram is divided. Recall that our histogram is divided into two ranges, the internal and external (displayed in different colors) and size range is defined in percentage of time of the price at this level. The range of the internal boundaries are Secondary POC levels.
After finding the Secondary POC - Borders percent range, proceed to the construction of the histogram.
// Histogram formation
   if(show_histogram)
     {
      datetime Delta=(iTime[rates_total-1]-iTime[0]-PeriodSeconds(PERIOD_H1))/ThicknessOfLevel[MaxLevel];
      int step=1;

      if(count>100)
         step=count/100;  // Calculate the step of the histogram (100 lines as max)

      ListHistogramInner.Clear();
      ListHistogramOuter.Clear();
      for(int i=0;i<count;i+=step)
        {
         string name=TimeToString(time_start)+" "+IntegerToString(i);
         double StartY= low_day+_Point*i;
         datetime EndX= iTime[0]+(ThicknessOfLevel[i])*Delta;

         CChartObjectTrend *obj=new CChartObjectTrend();
         obj.Create(0,name,0,poc_start_time,StartY,EndX,StartY);
         obj.Background(true);
         if(i>=DownLine && i<=UpLine)
           {
            obj.Color(inner_color);
            ListHistogramInner.Add(obj);
           }
         else
           {
            obj.Color(outer_color);
            ListHistogramOuter.Add(obj);
           }
        }
     }
It should be mentioned that in order to reduce the load on the terminal, I bring to the screen a maximum of 100 lines for each histogram. Lines of the histogram are stored in two lists, and ListHistogramInner ListHistogramOuter, which are the objects already known to us class CList. But these pointers are stored in a standard class of objects CChartObjectTrend. Why two lists, I think you can guess from the title, to be able to change the color histogram.
// We receive data beginning from the final time of the histogram till current time
   err=0;
   do
     {
      rates_time=CopyTime(NULL,PERIOD_M1,time_end,last_tick.time,iTime);
      rates_high=CopyHigh(NULL,PERIOD_M1,time_end,last_tick.time,iHigh);
      rates_total=CopyLow(NULL,PERIOD_M1,time_end,last_tick.time,iLow);
      err++;
     }
   while((rates_time<=0 || (rates_total!=rates_high && rates_total!=rates_time)) && err<AMOUNT_OF_ATTEMPTS);
// If there isn't history, the present day, level is virgin, we hoist the colours
   if(rates_time==0)
     {
      virgin=true;
     }
   else
// Otherwise we check history
     {
      for(index=0;index<rates_total;index++)
         if(poc_value<iHigh[index] && poc_value>iLow[index]) break;

      if(index<rates_total)   // If level has crossed
         poc_end_time=iTime[index];
      else
         virgin=true;
     }
   if(POCLine==NULL)
     {
      POCLine=new CChartObjectTrend();
      POCLine.Create(0,TimeToString(time_start)+" POC ",0,poc_start_time,poc_value,0,0);
     }
   POCLine.Color(poc_color);
   RefreshPOCs();
I have tried to design the CPriceHistogram with all necessary methods, if it insufficient, you can add yourself, and I will help with it.
Summary
Once again I would like to remind that the Price Histogram is reliable, but the intuitive tool, so the confirmation signals are necessary for its use.
Thank you for your interest. I am ready to answer to all your questions.
Translated from Russian by MetaQuotes Ltd.
Original article: https://www.mql5.com/ru/articles/17
Warning: All rights to these materials are reserved by MetaQuotes Ltd. Copying or reprinting of these materials in whole or in part is prohibited.
This article was written by a user of the site and reflects their personal views. MetaQuotes Ltd is not responsible for the accuracy of the information presented, nor for any consequences resulting from the use of the solutions, strategies or recommendations described.

 Applying One Indicator to Another
 How to Exchange Data: A DLL for MQL5 in 10 Minutes
 Checking the Myth: The Whole Day Trading Depends on How the Asian Session Is Traded
 Data Exchange between Indicators: It's Easy
- Free trading apps
- Over 8,000 signals for copying
- Economic news for exploring financial markets
You agree to website policy and terms of use
with
void CPriceHistogram::Delete()Works fine now in AMP Futures' MT5 Version 5.00 Build 3661.
@Oleksandr, this "indicator" is technically an Expert. Indicator buffers are not available in Experts. Buffers can be effectively recreated using arrays in Experts but only real indicator buffers can be called by iCustom so for that purpose, a new custom indicator would have to be coded from scratch. Unfortunately, both options are beyond my level of coding ability. Good luck to you in finding better help.
THNAKS
THANKS
Want to see something cool!!
File classexpert.mqh Line 104 :: change >= back to <
hello sir...
Can i have some help?It doesnt work on my side.
THANKS
What I have here for you and the community is an update, so that histogram uses the tickvolume...
Nicely done! I'm guessing that you use tickvolume for trading an S&P 500 CFD. I might have a go at replacing tickvolume with realvolume because I'll be trading S&P 500 futures on the centralized CME.
@ O_M_333, I sent you a private message.