
Pivot Points Helping to Define Market Trends
Introduction
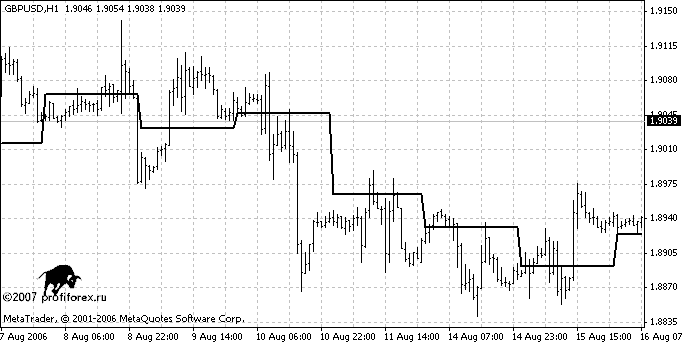
Pivot point is a line on the price chart that shows the further trend of a currency pair. If the price is above this line, it tends to grow. If the price is below this line, accordingly, it tends to fall. In this article, we are going to list the main principles of pivot point construction, and also we’ll try to understand the essence of this concept.
Pivot Calculation Using the Last Day Values
The majority of indicators function similarly: it counts pivot point on the base of the last day values or on the base of arbitrary time range. Let’s consider several examples:
Classical PIVOT calculation:
//----
i = 1;
while(TimeDay(Time[_shift + i]) == prevDay)
    i++;
// The indicator is developed for history, therefore we
//calculate successively for all days
i--;
FH = High[Highest(NULL, 0, MODE_HIGH, i, _shift + 1)];
FL = Low[Lowest(NULL, 0, MODE_LOW, i, _shift + 1)];
// We take maximal and minimal figures
if(Formula == 0)
    FP = NormalizeDouble((FH + FL + Close[_shift+1]) / 3.0, Digits);
else
    FP = NormalizeDouble((FH + FL + 2*Close[_shift+1]) / 4.0, Digits);
// Direct pivot calculation (only creator’s imagination plays an important role here).
// In this case the sum of maximum, minimum and closing price
// is divided by three. It is so-called “classical” pivot //calculation
ResBuffer[_shift] = NormalizeDouble(FP + (FH - FL), Digits);
SupBuffer[_shift] = NormalizeDouble(FP - (FH - FL), Digits);
//----
Ninety percent of indicators calculate the pivot point in such a way.
Analytical PIVOT
Usually supporters of the pivot point theory get it not from calculations but from Dow-Jones Newswires. The current-day PIVOT is given by Rudolf Axel. Here is an example of his intraday analyses:
TECHNICAL EXPERTISE of the EUROPEAN CURRENCY MARKETS: EUR/GBP has reached the highest mark for eight and a half years -2- |
The central part of the forecast contains the so-called "Axel levels":
| /td> | EUR/USD |
USD/JPY |
GBP/USD |
USD/CHF |
3rd resistance |
1.3117 |
122.2000 |
1.9748 |
1.2544 |
2nd resistance |
1.3074 |
121.7500 |
1.9668 |
1.2519 |
1st resistance |
1.3045 |
121.4700 |
1.9623 |
1.2500 |
Pivot point* |
1.3026 |
121.3300 |
1.9546 |
1.2478 |
1st support |
1.3000 |
121.0000 |
1.9549 |
1.2450 |
2nd support |
1.2951 |
120.8200 |
1.9514 |
1.2425 |
3rd support |
1.2913 |
120.6400 |
1.9483 |
1.2380 |
| /td> | EUR/GBP |
EUR /JPY |
EUR /CHF |
AUD/USD |
3rd support |
0.6693 |
159.0200 |
1.6312 |
0.7872 |
2nd resistance |
0.6672 |
158.8800 |
1.6298 |
0.7839 |
1st resistance |
0.6661 |
158.6200 |
1.6275 |
0.7820 |
Pivot point* |
0.6664 |
158.1000 |
1.6257 |
0.7806 |
1st support |
0.6643 |
158.1500 |
1.6245 |
0.7787 |
2nd support |
0.6625 |
157.8100 |
1.6219 |
0.7765 |
3rd support |
614 |
157.2500 |
1.6184 |
0.7750 |
As you see, it is possible to take from the given analyses not only pivot points, but also the basic lines of support/resistance. For those who would not like to allocate levels from a Newswire by him or herself, there is a special section on a website http://www.forum.profiforex.ru/showthread.php?t=480 where the script containing levels is placed daily. After you receive the analytical information, it is necessary just to reflect it in the price chart quickly and in "workmanlike manner". As for me, I prefer to use scripts for this purpose. The scripts stop working after Axel lines have once been drawn.
Line Drawing
After we have calculated (or taken from analytics) the pivot point, it is necessary to display it in the chart of MetaTrader 4 Client Terminal. Let’s consider tools that allows to draw lines in the chart automatically. First of all, it is necessary to create object "Line". It should be done in the following way: first it is necessary to define the line direction. Let’s suggest that it begins on the 13rd of February at 00:00 and runs out in the end of the same day. The level is determined by variable "Pivot".
ObjectCreate("PivotDJ", OBJ_TREND, 0, D'2007.02.13 00:00', Pivot,
D'2007.02.13 23:59', Pivot);
// Object title, type (in this case it is “a trend line”)and
//data about the beginning and the end of the line
// Next it’s necessary to define the main properties of the
//line:
ObjectSet("PivotDJ",OBJPROP_COLOR, colorPivot);
// A color
ObjectSet("PivotDJ", OBJPROP_WIDTH, 0);
// A thickness
ObjectSet("PivotDJ", OBJPROP_STYLE, 0);
// A style
ObjectSet("PivotDJ", OBJPROP_RAY, 0);
// It is necessary to draw a ray not the line. (it should not
//come for other days)
ObjectSet("PivotDJ", OBJPROP_STYLE, STYLE_DASH);
// A type of the line
To draw all Axel lines, it is necessary to create a line for each level. Here is the complete code:
// First of all, let's define the levels (we take levels for GBP for one of
// days)
// if(Symbol() == "GBPUSD")
//   {
//     R3 = 1.9591;
//     R2 = 1.9543;
//     R1 = 1.9514;
//     P = 1.9487;
//     S1 = 1.9441;
//     S2 = 1.9405;
//     S3 = 1.9373 ;
//   }
// Drawing the Pivot Line:
 ObjectCreate("PivotDJ", OBJ_TREND, 0, D'2007.02.13 00:00', P,
              D'2007.02.13 23:59', P);
 ObjectSet("PivotDJ", OBJPROP_COLOR, colorPivot);
 ObjectSet("PivotDJ", OBJPROP_WIDTH, 0);
 ObjectSet("PivotDJ", OBJPROP_STYLE, 0);
 ObjectSet("PivotDJ", OBJPROP_RAY, 0);
 ObjectSet("PivotDJ", OBJPROP_STYLE, STYLE_DASH);
// Drawing the 1st support line:
 ObjectCreate("Sup1", OBJ_TREND, 0, D'2007.02.13 00:00', S1,
              D'2007.02.13 23:59', S1);
 ObjectSet("Sup1", OBJPROP_COLOR, colorSup1);
 ObjectSet("Sup1", OBJPROP_WIDTH, 0);
 ObjectSet("Sup1", OBJPROP_STYLE, 0);
 ObjectSet("Sup1", OBJPROP_RAY, 0);
 ObjectSet("Sup1", OBJPROP_STYLE, STYLE_DASH);
// Drawing the 1st resistance:
 ObjectCreate("Res1", OBJ_TREND, 0, D'2007.02.13 00:00', R1,
              D'2007.02.13 23:59', R1);
 ObjectSet("Res1", OBJPROP_COLOR, colorRes1);
 ObjectSet("Res1", OBJPROP_WIDTH, 0);
 ObjectSet("Res1", OBJPROP_STYLE, 0);
 ObjectSet("Res1", OBJPROP_RAY, 0);
 ObjectSet("Res1", OBJPROP_STYLE, STYLE_DASH);
But there is more to come. It is necessary to add a signature text. It is easy to do.
// It is enough to create object "Text"
  ObjectCreate("PivotText", OBJ_TEXT, 0, 0, 0);
// and set its basic properties
  ObjectSetText("PivotText", "Pivot Point (DJ)", fontsize, "Arial",
                colorPivot);
// Now it is possible to place it above already drawn lines
// ObjectMove("PivotText", 0, D'2007.02.13 3:00',P);
As a result, we received the lines neatly drawn in the price chart:
Conclusion
Thus, we have studied the general ideas of trading using pivot points, opportunities to calculate lines on the base of the previous price values, and also ways of lines drawing given us by analysts (which is easier and much more convenient, than to draw them manually). I hope this article will help you to trade in markets and get profits!
Translated from Russian by MetaQuotes Ltd.
Original article: https://www.mql5.com/ru/articles/1466
 Genetic Algorithms vs. Simple Search in the MetaTrader 4 Optimizer
 Expert System 'Commentator'. Practical Use of Embedded Indicators in an MQL4 Program
 A Method of Drawing the Support/Resistance Levels
 Events in МetaТrader 4
- Free trading apps
- Over 8,000 signals for copying
- Economic news for exploring financial markets
You agree to website policy and terms of use
With anticipation I placed the TWO into... \experts\indicators ... but they do not load onto the chart...
Would you please advise as to what could be wrong...? -Thank you.
Regards, EnkiJr
PS: All my other indicators are working fine...