
帮助定义市场趋势的枢轴点
简介
枢轴点是价格图上的一条线,显示货币对的进一步趋势。如果价格在该线之上,则趋于上升。如果价格在该线之下,则相应的趋于下降。本文中,我们将列出构建枢轴点的主要原则,以及尝试理解该概念的实质。
使用上一日值计算枢轴点
大多数指标功能类似:基于上一日值或任意时间范围对枢轴点计数。让我们来看看几个示例:
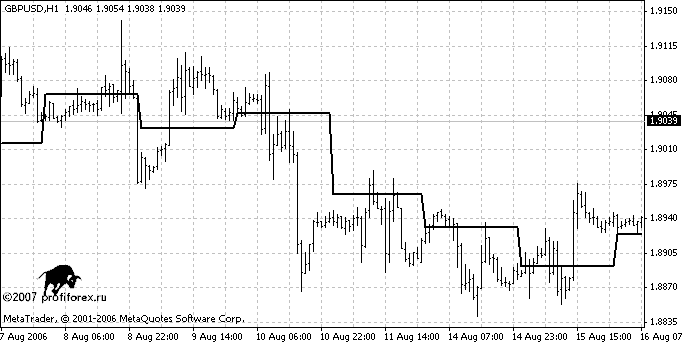
经典的枢轴计算:
//----
i = 1;
while(TimeDay(Time[_shift + i]) == prevDay)
    i++;
// The indicator is developed for history, therefore we
//calculate successively for all days
i--;
FH = High[Highest(NULL, 0, MODE_HIGH, i, _shift + 1)];
FL = Low[Lowest(NULL, 0, MODE_LOW, i, _shift + 1)];
// We take maximal and minimal figures
if(Formula == 0)
    FP = NormalizeDouble((FH + FL + Close[_shift+1]) / 3.0, Digits);
else
    FP = NormalizeDouble((FH + FL + 2*Close[_shift+1]) / 4.0, Digits);
// Direct pivot calculation (only creator’s imagination plays an important role here).
// In this case the sum of maximum, minimum and closing price
// is divided by three. It is so-called “classical” pivot //calculation
ResBuffer[_shift] = NormalizeDouble(FP + (FH - FL), Digits);
SupBuffer[_shift] = NormalizeDouble(FP - (FH - FL), Digits);
//----
百分之九十的指标采用这种方式计算枢轴点。
分析枢轴
枢轴点理论的支持者通常并非从计算结果而是从道琼斯通讯社获得。当前的枢轴由 Rudolf Axel 给出。下面是他的日内交易分析示例:
欧洲货币市场的技术专家:EUR/GBP 已经达到八年半以来的最高点 -2- |
预测的中间部分包含所谓的“Axel 水平”:
|
EUR/USD |
USD/JPY |
GBP/USD |
USD/CHF |
第三阻力位 |
1.3117 |
122.2000 |
1.9748 |
1.2544 |
第二阻力位 |
1.3074 |
121.7500 |
1.9668 |
1.2519 |
第一阻力位 |
1.3045 |
121.4700 |
1.9623 |
1.2500 |
枢轴点* |
1.3026 |
121.3300 |
1.9546 |
1.2478 |
第一支撑位 |
1.3000 |
121.0000 |
1.9549 |
1.2450 |
第二支撑位 |
1.2951 |
120.8200 |
1.9514 |
1.2425 |
第三支撑位 |
1.2913 |
120.6400 |
1.9483 |
1.2380 |
|
EUR/GBP |
EUR /JPY |
EUR /CHF |
AUD/USD |
第三支撑位 |
0.6693 |
159.0200 |
1.6312 |
0.7872 |
第二阻力位 |
0.6672 |
158.8800 |
1.6298 |
0.7839 |
第一阻力位 |
0.6661 |
158.6200 |
1.6275 |
0.7820 |
枢轴点* |
0.6664 |
158.1000 |
1.6257 |
0.7806 |
第一支撑位 |
0.6643 |
158.1500 |
1.6245 |
0.7787 |
第二支撑位 |
0.6625 |
157.8100 |
1.6219 |
0.7765 |
第三支撑位 |
614 |
157.2500 |
1.6184 |
0.7750 |
由此可见,从给出的分析中不仅可以得到枢轴点,还可以得到基本的支撑/阻力线。对于不想自行从新闻专线分配点位的人,以下网址有一个专用板块:http://www.forum.profiforex.ru/showthread.php?t=480,其中包含点位的脚本每天上传。在接收分析信息后,有必要在价格图上快速且以“专业”的方式反映。对我来说,我喜欢用脚本来实现。在绘制 Axel 线之后,脚本停止工作。
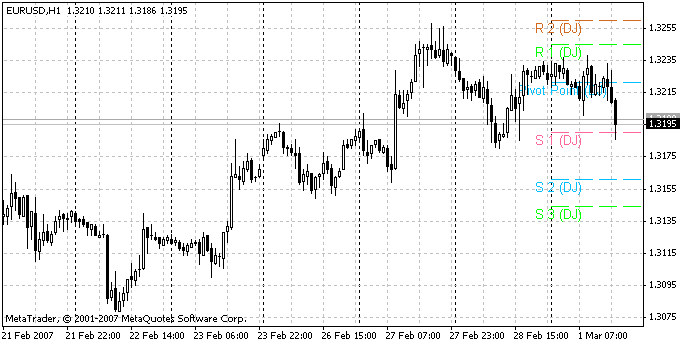
绘制线
在已经计算(或从分析获得)枢轴点之后,需要在 MetaTrader 4 客户端的图表显示。我们来考虑能够在图表自动画线的工具。首先,需要创建“线”对象。应按照以下方式进行,首先要定义线的方向。我们假设其始于二月十三日的 00:00 并直至当日结束。点位由变量“枢轴”决定。
ObjectCreate("PivotDJ", OBJ_TREND, 0, D'2007.02.13 00:00', Pivot,
D'2007.02.13 23:59', Pivot);
// Object title, type (in this case it is “a trend line”)and
//data about the beginning and the end of the line
// Next it’s necessary to define the main properties of the
//line:
ObjectSet("PivotDJ",OBJPROP_COLOR, colorPivot);
// A color
ObjectSet("PivotDJ", OBJPROP_WIDTH, 0);
// A thickness
ObjectSet("PivotDJ", OBJPROP_STYLE, 0);
// A style
ObjectSet("PivotDJ", OBJPROP_RAY, 0);
// It is necessary to draw a ray not the line. (it should not
//come for other days)
ObjectSet("PivotDJ", OBJPROP_STYLE, STYLE_DASH);
// A type of the line
要绘制所有的 Axel 线,需要为每个点位创建一条线。下面是完整的代码:
// First of all, let's define the levels (we take levels for GBP for one of
// days)
// if(Symbol() == "GBPUSD")
//   {
//     R3 = 1.9591;
//     R2 = 1.9543;
//     R1 = 1.9514;
//     P = 1.9487;
//     S1 = 1.9441;
//     S2 = 1.9405;
//     S3 = 1.9373 ;
//   }
// Drawing the Pivot Line:
 ObjectCreate("PivotDJ", OBJ_TREND, 0, D'2007.02.13 00:00', P,
              D'2007.02.13 23:59', P);
 ObjectSet("PivotDJ", OBJPROP_COLOR, colorPivot);
 ObjectSet("PivotDJ", OBJPROP_WIDTH, 0);
 ObjectSet("PivotDJ", OBJPROP_STYLE, 0);
 ObjectSet("PivotDJ", OBJPROP_RAY, 0);
 ObjectSet("PivotDJ", OBJPROP_STYLE, STYLE_DASH);
// Drawing the 1st support line:
 ObjectCreate("Sup1", OBJ_TREND, 0, D'2007.02.13 00:00', S1,
              D'2007.02.13 23:59', S1);
 ObjectSet("Sup1", OBJPROP_COLOR, colorSup1);
 ObjectSet("Sup1", OBJPROP_WIDTH, 0);
 ObjectSet("Sup1", OBJPROP_STYLE, 0);
 ObjectSet("Sup1", OBJPROP_RAY, 0);
 ObjectSet("Sup1", OBJPROP_STYLE, STYLE_DASH);
// Drawing the 1st resistance:
 ObjectCreate("Res1", OBJ_TREND, 0, D'2007.02.13 00:00', R1,
              D'2007.02.13 23:59', R1);
 ObjectSet("Res1", OBJPROP_COLOR, colorRes1);
 ObjectSet("Res1", OBJPROP_WIDTH, 0);
 ObjectSet("Res1", OBJPROP_STYLE, 0);
 ObjectSet("Res1", OBJPROP_RAY, 0);
 ObjectSet("Res1", OBJPROP_STYLE, STYLE_DASH);
但这并不是全部。需要添加签名文本。这很容易做。
// It is enough to create object "Text"
  ObjectCreate("PivotText", OBJ_TEXT, 0, 0, 0);
// and set its basic properties
  ObjectSetText("PivotText", "Pivot Point (DJ)", fontsize, "Arial",
                colorPivot);
// Now it is possible to place it above already drawn lines
// ObjectMove("PivotText", 0, D'2007.02.13 3:00',P);
现在,我们得到价格图上绘制整齐的线:
总结
至此,我们讨论了使用枢轴点进行交易的基本思想、基于过去价格值计算线的方法以及由分析师给出的画线的方式(这比手动绘制更加容易和便捷)。希望本文能够帮助你在市场中交易并获利!
本文由MetaQuotes Ltd译自俄文
原文地址: https://www.mql5.com/ru/articles/1466


