
Studying the CCanvas Class. How to Draw Transparent Objects
Table Of Contents
- Introduction
- 1. Transparency (Alpha Channel)
- 2. ARGB Color Representation
- 3. Scheme of Object Drawing in the Terminal
- 4. Blending Colors. Resulting Color
- 5. The Illusion of Transparency
- Conclusion
Introduction
Drawing in MetaTrader 5 is simple and you need to know only a few nuances. One of the nuances is how the terminal screen is designed. More precisely, we are interested in the way the graphics are output on the screen. For example, a chart can be displayed in the foreground or in the background. Color output on the screen will depend on the chart display. Some graphical objects may change color in the overlapping or intersection areas.
Before proceeding directly to drawing using the CCanvas class, let's analyze some definitions related to color processing. For example, let's find out the meaning of the Alpha channel.
In my opinion, implementation of transparency is the most important technology, which can vivify an image. For example, transparency can be used to implement a more attractive interface with smooth color transition or shadows. Shadow adds up dimension to a graphical object and visually softens the object edges.
1. Transparency (Alpha Channel)
We live in a three-dimensional world and perceive everything around us in three dimensions. We used to see or even feel the three-dimensionality. In the three-dimensional world we can understand which of the objects is closer to us.
Some objects may be translucent. For example, take a clear glass containing a translucent liquid on a blue background. The blue background is visible through the glass with liquid. Background details depend in the degree of transparency of the liquid.
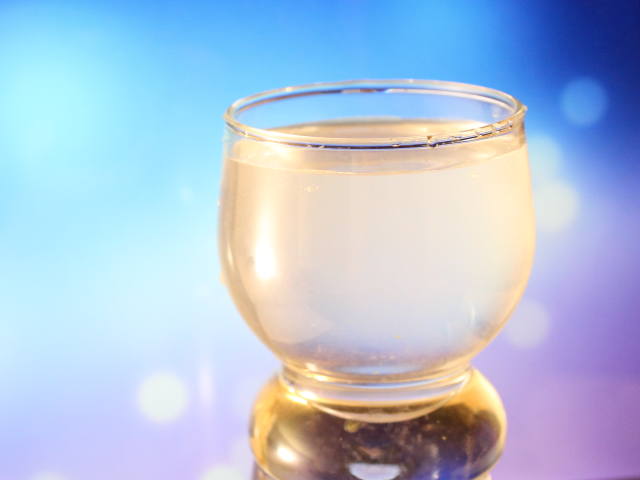
Fig. 1 Common view of the dimensionality
Transparency in this example is not virtual and not illusory. Transparency in this case is seen as a matter of course.
It's all different when an image is displayed on a computer monitor - the pixel matrix is two-dimensional, i.e. the image displayed by the matrix has a height and a width, but does not have the third option of depth. It is therefore not possible to position a pixel over another one simulating the situation when the lower pixel is a yellow background, and the upper pixel is the translucent glass. Any image of a three-dimensional and realistic object on the screen is an illusion, which is achieved through the use of color and shadow.
Let us see the example of an image that can be divided into two layers: the bottom layer, which is a blue background and the top layer, which is a glass with opaque liquid. Here is how it looks on the screen:
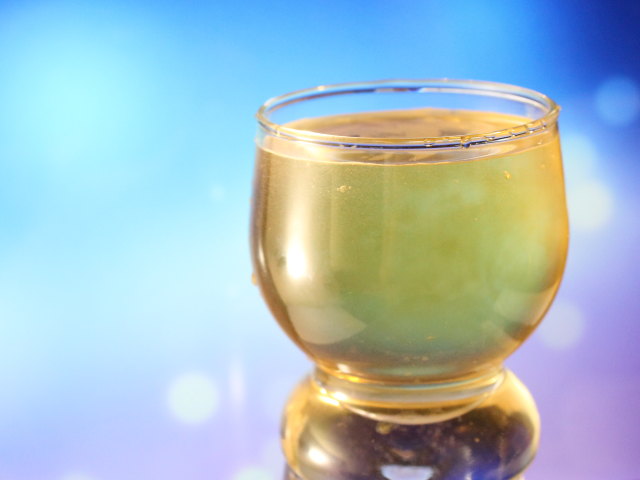
Fig. 2. Opaque glass
On the resulting image the glass is completely opaque. To add (change) transparency, we need to translate all the colors in the image into ARGB color representation.
2. ARGB Color Representation
I have not forgotten about the transparency of the glass. The issue will be discussed in details in the second part.
ARGB color representation is a four-byte type uint, in which the following values are recorded: an alpha channel, red, green, blue. That is, to impart transparency to the color in the RGB format an extra byte with a value of transparency that is an alpha channel is added.

Fig. 3. ARG
The value of an alpha channel is set from 0 (a color of a foreground pixel does not change the display of an underlying one) up to 255 (a color of an underlying pixel is completely replaced by the foreground pixel's one). Color transparency in percentage terms is calculated as follows:
![]()
In other words, the smaller value of the alpha channel leads to a more transparent color. If we know the desired transparency, the alpha value can be calculated as follows:
![]()
Function ColorToARGB(color, alpha) is used for converting color into ARGB.
3. The Scheme of Object Drawing in the Terminal
To better understand how the color is processed, let us consider the scheme of the mutual arrangement of graphical objects with two versions of the chart setup: the chart in the background and the chart in the foreground.
3.1. Chart in the Background
To check this option, right click on the chart, then select "Properties..." from the drop-down menu and go to the "Common" tab.
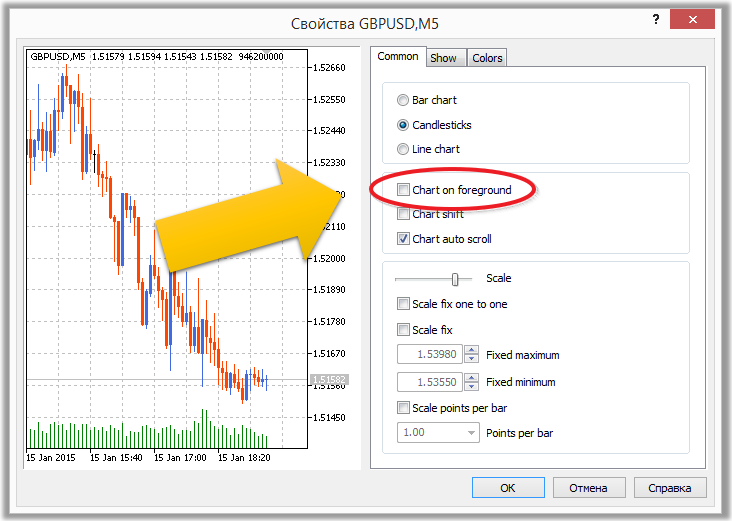
Fig. 4. Chart in the Background
A chart window in the terminal consists of four layers. You can draw on the two extreme layers ("Background" and "Foreground"):
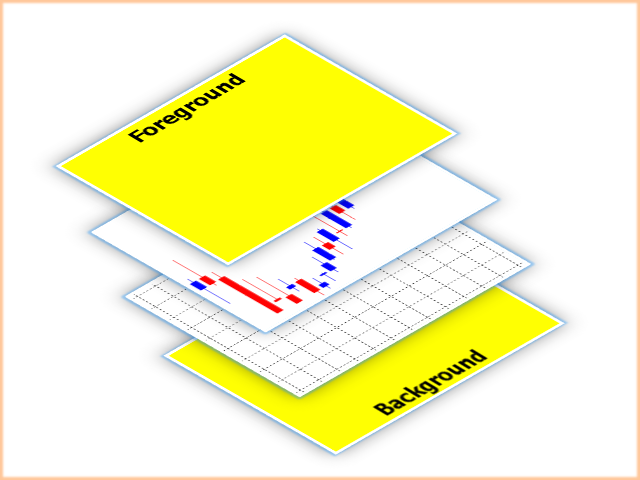
Fig. 5. The scheme of the chart window
In the background and in the foreground, one drawn object is overlaid with another one in accordance with their creation time.
That is, the oldest objects will be located at the very back layer of the "Background" and at the very back layer of the "Foreground". Younger objects will appear on top.
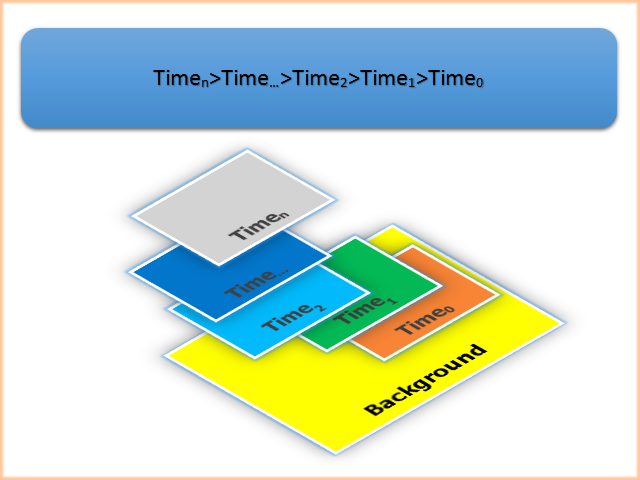
Fig. 6. Location of objects depending on the time of creation
Not all objects can overlap completely, without repainting in the field (or fields) where they overlap with the underlying graphical objects.
The table below summarizes the characteristics of graphical objects followed by an explanation of overlapping of objects that are repainted at the overlapping areas.
| ID | Object | Description | Overlapping with an underlying object |
|---|---|---|---|
| OBJ_VLINE | Vertical line | No repainting | |
| OBJ_HLINE | Horizontal Line | No repainting | |
| OBJ_TREND | Trend line | No repainting | |
| OBJ_TRENDBYANGLE | Trendline by angle | No repainting | |
| OBJ_CYCLES | Cycle Lines | No repainting | |
| OBJ_ARROWED_LINE | Arrowed line | No repainting | |
| OBJ_CHANNEL | Equidistant Channel | No repainting | |
| OBJ_STDDEVCHANNEL | Standard Deviation Channel | No repainting | |
| OBJ_REGRESSION | Linear Regression Channel | No repainting | |
| OBJ_PITCHFORK | Andrews’ Pitchfork | No repainting | |
| OBJ_GANNLINE | Gann Line | No repainting | |
| OBJ_GANNFAN | Gann Fan | No repainting | |
| OBJ_GANNGRID | Gann Grid | No repainting | |
| OBJ_FIBO | Fibonacci Retracement | No repainting | |
| OBJ_FIBOTIMES | Fibonacci Time Zones | No repainting | |
| OBJ_FIBOFAN | Fibonacci Fan | No repainting | |
| OBJ_FIBOARC | Fibonacci Arcs | No repainting | |
| OBJ_FIBOCHANNEL | Fibonacci Channel | No repainting | |
| OBJ_EXPANSION | Fibonacci Expansion | No repainting | |
| OBJ_ELLIOTWAVE5 | Elliott Waves - 5 | No repainting | |
| OBJ_ELLIOTWAVE3 | Elliott Waves - 3 | No repainting | |
| OBJ_RECTANGLE | Rectangle | No repainting if no filling, repainting if filled | |
| OBJ_TRIANGLE | Triangle | No repainting if no filling, repainting if filled | |
| OBJ_ELLIPSE | Ellipse | No repainting if no filling, repainting if filled | |
| OBJ_ARROW_THUMB_UP | Thumb Up | No repainting | |
| OBJ_ARROW_THUMB_DOWN | Thumb Down | No repainting | |
| OBJ_ARROW_UP | Arrow Up | No repainting | |
| OBJ_ARROW_DOWN | Array Down | No repainting | |
| OBJ_ARROW_STOP | Stop | No repainting | |
| OBJ_ARROW_CHECK | Check mark | No repainting | |
| OBJ_ARROW_LEFT_PRICE | Left Price Labe | No repainting | |
| OBJ_ARROW_RIGHT_PRICE | Right Price Label | No repainting | |
| OBJ_ARROW_BUY | Buy mark | No repainting | |
| OBJ_ARROW_SELL | Sell mark | No repainting | |
| OBJ_ARROW | Arrow object | No repainting | |
| OBJ_TEXT | Text object | No repainting | |
| OBJ_LABEL | Text Label object | No repainting | |
| OBJ_BUTTON | Button object | No repainting | |
| OBJ_CHART | Chart object | No repainting | |
| OBJ_BITMAP | Bitmap object | No repainting | |
| OBJ_BITMAP_LABEL | Bitmap Label object | No repainting | |
| OBJ_EDIT | Edit object | No repainting | |
| OBJ_EVENT | The Event object which corresponds to an event in Economic Calendar | No repainting | |
| OBJ_RECTANGLE_LABEL | The Rectangle Label object used to create and design the custom graphical interface | No repainting |
Table 1 Overlay and Transparency of Graphical Objects
Let us see the example of three objects of type OBJ_RECTANGLE (rectangles) and discuss the algorithm of repainting in the object overlapping areas which should be repainted (file xor.mq5).
The script (file xor.mq5) sets the white background color (0xFFFFFF) and draws filled rectangles №1 and №2 in blue (0x0000FF), rectangle №3 is red (0xFF0000) and filled.
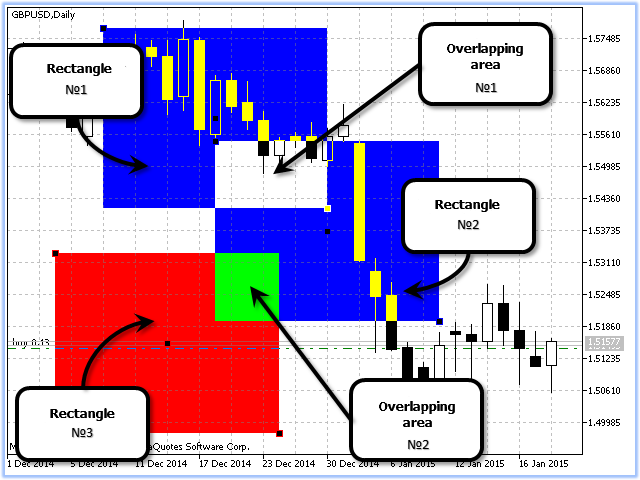
Fig. 7. Repainting. Chart in the Background
We got two intersection areas, in which the color changed:
- Area №1 – the resulting color (0x000000) is fully transparent, so in area №1 we see unchanged background and the chart;
- Area №2 – resulting color (0x00FF00).
When graphical objects such as rectangles overlap, they are repainted by the algorithm of Bitwise OR.
Fig. 6 below shows an example of repainting colors for both areas:
| Literal representation | Integer representation | Binary representation | Note |
|---|---|---|---|
| C’0,0,255’ | 0x0000FF | 0000 0000 0000 0000 1111 1111 | Blue |
| XOR | |||
| C’0,0,225’ | 0x0000FF | 0000 0000 0000 0000 1111 1111 | Blue |
| = | |||
| C’0,0,0’ | 0x000000 | 0000 0000 0000 0000 0000 0000 | Transparent |
| XOR | |||
| C’255,255,255’ | 0xFFFFFF | 1111 1111 1111 1111 1111 1111 | White (background) |
| = | |||
| C’255,255,255’ | 0xFFFFFF | 1111 1111 1111 1111 1111 1111 | White |
Table 2. Bitwise OR for Blue + Blue + White
| Literal representation | Integer representation | Binary representation | Note |
|---|---|---|---|
| C’0,0,255’ | 0x0000FF | 0000 0000 0000 0000 1111 1111 | Blue |
| XOR | |||
| C’255,0,0’ | 0xFF0000 | 1111 1111 0000 0000 0000 0000 | Red |
| = | |||
| С’255,0,255’ | 0xFF00FF | 1111 1111 0000 0000 1111 1111 | |
| XOR | |||
| C’255,255,255’ | 0xFFFFFF | 1111 1111 1111 1111 1111 1111 | White (background) |
| = | |||
| С’0,255,0’ | 0x00FF00 | 0000 0000 1111 1111 0000 0000 |
Table 3. Bitwise OR for Blue + Red + White
3.2. Chart in the Foreground
When the 'Chart in Foreground' parameter is on, the arrangement of chart window layers differs from that with the chart in the background:
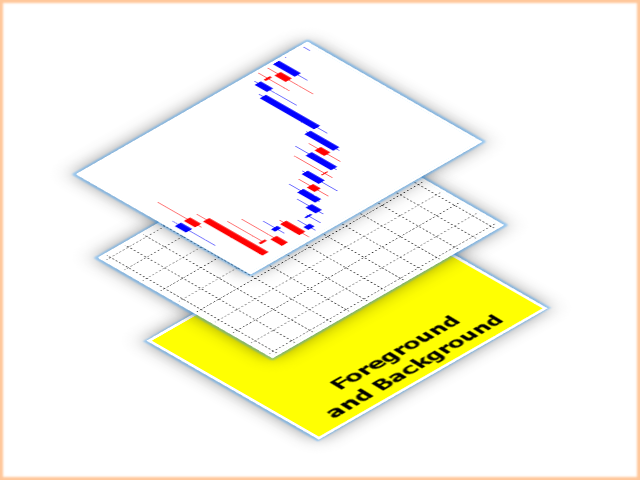
Fig. 8. Chart window scheme. Chart on Top
When the 'Chart in Foreground' option is on, two drawing layers 'Foreground' and 'Background' merge into one common layer. This common layer is below the layers with bars and grid.
3.3. Repainting for "Chart on Top"
As in Fig. 7, we consider the repainting algorithm at the overlapping of objects that are repainted (file xor.mq5).
The script (file xor.mq5) sets the white background color (0xFFFFFF) and draws filled rectangles №1 and №2 in blue (0x0000FF), rectangle №3 is red (0xFF0000) and filled.
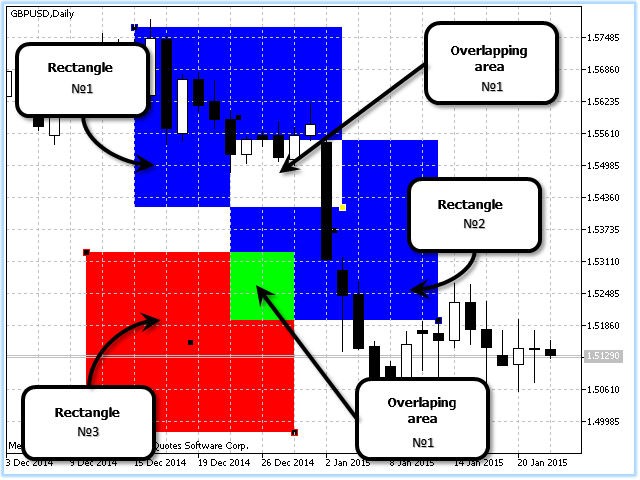
Fig. 9. Repainting. Chart in the Foreground
If we compare Fig. 7 and 9, we see that the overlapping areas are repainted equally.
4. Blending Colors Resulting Color
As mentioned above, the transparency on the screen is an illusion. Color manipulations. To simulate Fig. 2 on the screen, we only need to understand how to display a color with transparency on the screen. That is we need to calculate the resulting color of the pixel.
Suppose, we want to draw red with alpha channel 128 on canvas on a white background (chart background in the "Black On White" color scheme). In the ARGB format the color is 0x80FF0000. To calculate the resulting color, we need to calculate the color of each of the channels (Red, Green, Blue).
Here is the formula for calculating the resulting color with an alpha channel applied to color, normalized to one:
![]()
where:
- result is the resulting value of color channel intensity. If the value is greater than 255, it returns 255.
- background is the value of the background color channel.
- foreground is the color channel value of the overlaying image.
- alpha is an alpha value normalized to one.
Let's calculate the resulting color according to the formula (1.3):
| Alpha channel | Alpha channel, normalized to "1" | R | G | B | Note |
|---|---|---|---|---|---|
| 255 | 255 | 255 | White | ||
| 128 | 0,5 | 255 | 0 | 0 | Red with alpha 128 |
| 255*(1-0.5)+255*0.5=255 | 255*(1-0.5)+0*0.5=127 | 255*(1-0.5)+0*0.5=127 |
Table 4. Results of calculation using the formula (1.3)
The resulting color on the screen is the following:
![]()
Fig. 10. Resulting color
4.1. Color Processing Methods. ENUM_COLOR_FORMAT
When creating a canvas, you can specify one of three methods of color processing (ENUM_COLOR_FORMAT):
| ID | Description |
|---|---|
| COLOR_FORMAT_XRGB_NOALPHA | Alpha component is ignored |
| COLOR_FORMAT_ARGB_RAW | Color components are not processed by terminal (they should be correctly specified by user) |
| COLOR_FORMAT_ARGB_NORMALIZE | Color components are processed by terminal |
Table 5. Color Processing Methods for Canvas Creation
COLOR_FORMAT_ARGB_NORMALIZE provides a more beautiful image by taking into account the correct overlay of RGB components. The resulting color when applying color with an alpha channel is calculated according to the formula (1.3).
COLOR_FORMAT_ARGB_RAW does not control the overflow of RGB components of a color, therefore COLOR_FORMAT_ARGB_RAW is a faster method compared to COLOR_FORMAT_ARGB_NORMALIZE.
Here is the formula for calculating the resulting color with an alpha channel applied to color normalized to one, for method COLOR_FORMAT_ARGB_RAW:
![]()
where:
- result is the resulting value of color channel intensity. If the value is greater than 255, it returns 255.
- background is the value of the background color channel.
- foreground is the color channel value of the overlaying image.
- alpha is an alpha value normalized to one.
5. The Illusion of Transparency
Now we can proceed to the practical implementation of transparency.
Let us draw a number of filled rectangles (script "xor.mq5"). To illustrate the difference of color processing methods, let us apply three non-overlapping horizontal canvases on top of the chart.
The first one is processed using COLOR_FORMAT_XRGB_NOALPHA, the second one - COLOR_FORMAT_ARGB_RAW and the third one - COLOR_FORMAT_ARGB_NORMALIZE. Then we gradually change the transparency from 255 (fully opaque) to 0 (fully transparent). Let's call our script "Illusion.mq5".
The video shows how the script "Illusion.mq5" works:
Fig. 11. Work of script illusion.mq5
5.1. Creating the Script "Illusion.mq5"
New or modified code parts are highlighted.
The empty script template:
//+------------------------------------------------------------------+
//|                                                     Illusion.mq5 |
//|                              Copyright © 2015, Vladimir Karputov |
//|                                           http://wmua.ru/slesar/ |
//+------------------------------------------------------------------+
#property copyright "Copyright © 2015, Vladimir Karputov"
#property link      "http://wmua.ru/slesar/"
#property version   "1.0"
//+------------------------------------------------------------------+
//| Script program start function                                    |
//+------------------------------------------------------------------+
void OnStart()
  {
//---
  }
Let's add script description, an option for entering parameters during script start, and connect the CCanvas class, which enables drawing:
#property version   "1.0"
#property description "The illusion of transparency"
//--- show the window of input parameters when launching the script
#property script_show_inputs
#include <Canvas\Canvas.mqh>
The script operation requires a number of variables - chart height and width, canvas height and width, as well as auxiliary variables for drawing canvas coordinates:
#include <Canvas\Canvas.mqh>

//+------------------------------------------------------------------+
//| inputs                                                           |
//+------------------------------------------------------------------+
input color colr=clrRed;
input color clr_Circle=clrBlue;
//--- variable width and height of the chart.
int            ChartWidth=-1;
int            ChartHeight=-1;
//---
uchar alpha=0;                //alpha channel managing color transparency
int   can_width,can_height;   //width and height of the canvas
int   can_x1,can_y1,can_x2,can_y2,can_y3,can_x3;   //coordinates
To receive the width and height of the chart, we use standard functions:
//+------------------------------------------------------------------+
//| Script program start function                                    |
//+------------------------------------------------------------------+
void OnStart()
  {
//---
  }

//+------------------------------------------------------------------+
//| Chart property width                                             |
//+------------------------------------------------------------------+
int ChartWidthInPixels(const long chart_ID=0)
  {
//--- prepare the variable to get the property value
   long result=-1;
//--- reset the error value
   ResetLastError();
//--- receive the property value
   if(!ChartGetInteger(chart_ID,CHART_WIDTH_IN_PIXELS,0,result))
     {
      //--- display the error message in Experts journal
      Print(__FUNCTION__+", Error Code = ",GetLastError());
     }
//--- return the value of the chart property
   return((int)result);
  }
//+------------------------------------------------------------------+
//| Chart property height                                            |
//+------------------------------------------------------------------+
int ChartHeightInPixelsGet(const long chart_ID=0,const int sub_window=0)
  {
//--- prepare the variable to get the property value
   long result=-1;
//--- reset the error value
   ResetLastError();
//--- receive the property value
   if(!ChartGetInteger(chart_ID,CHART_HEIGHT_IN_PIXELS,sub_window,result))
     {
      //--- display the error message in Experts journal
      Print(__FUNCTION__+", Error Code = ",GetLastError());
     }
//--- return the value of the chart property
   return((int)result);
  }
Go directly to OnStart().
For clarity Fig. 12 shows the layout of the canvases on the chart and the auxiliary variables for canvas coordinates:
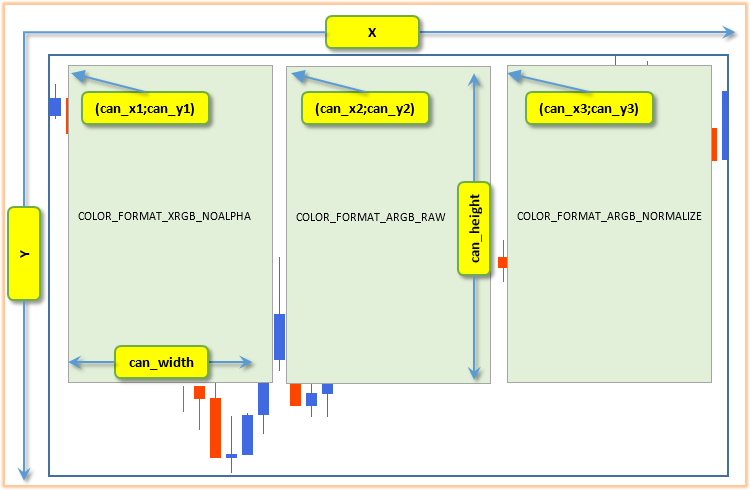
Fig. 12. Coordinates on the chart
Let's find the height and width of the chart and calculate the auxiliary variables for canvas coordinates:
void OnStart()
  {
//--- width and height of the chart
   ChartWidth=ChartWidthInPixels();
   ChartHeight=ChartHeightInPixelsGet()-50;
//---
   can_width=ChartWidth/3;   can_height=ChartHeight;
   can_x1=0;            can_y1=0;
   can_x2=can_width;    can_y2=0;
   can_x3=can_width*2;  can_y3=0;
  }
With the calculated width and height of the canvas and the auxiliary coordinates we can start drawing.
Next let's change the void type of the OnStart() function to int and draw on the first canvas a filled rectangle, a text with the name of the canvas color processing method and a filled circle:
int OnStart()
  {
//--- width and height of the chart
   ChartWidth=ChartWidthInPixels();
   ChartHeight=ChartHeightInPixelsGet()-50;
//---
   can_width=ChartWidth/3;   can_height=ChartHeight;
   can_x1=0;            can_y1=0;
   can_x2=can_width;    can_y2=0;
   can_x3=can_width*2;  can_y3=0;
//--- create canvas COLOR_FORMAT_XRGB_NOALPHA
   CCanvas canvas_XRGB_NOALPHA,canvas_ARGB_RAW,canvas_XARGB_NORMALIZE;
   if(!canvas_XRGB_NOALPHA.CreateBitmapLabel("canvas_XRGB_NOALPHA",can_x1,can_y1,can_width-1,can_height,COLOR_FORMAT_XRGB_NOALPHA))
     {
      Print("Error creating canvas: ",GetLastError());
      return(-1);
     }
   canvas_XRGB_NOALPHA.Erase(ColorToARGB(colr,alpha));
   canvas_XRGB_NOALPHA.TextOut((can_width)/2,can_height/2,"canvas_XRGB_NOALPHA",ColorToARGB(clrBlue,255),TA_CENTER|TA_VCENTER);
   canvas_XRGB_NOALPHA.FillCircle((can_width)/2,can_height/2+50,25,ColorToARGB(clr_Circle,255));
   canvas_XRGB_NOALPHA.Update();
   return(0);
  }
More details on the last added code part.
canvas_XRGB_NOALPHA.CreateBitmapLabel("canvas_XRGB_NOALPHA",can_x1,can_y1,can_width-1,can_height,COLOR_FORMAT_XRGB_NOALPHA)
canvas_XRGB_NOALPHA.CreateBitmapLabel - Here we create a graphical resource bound to a chart object.
The color processing method of the first canvas is COLOR_FORMAT_XRGB_NOALPHA - the alpha component is ignored.
canvas_XRGB_NOALPHA.Erase(ColorToARGB(colr,alpha)); Fills the entire canvas with a color in the ARGB format with the alpha transparency.
The canvas will be filled ignoring the alpha channel, because the COLOR_FORMAT_XRGB_NOALPHA method for color processing is used here.
canvas_XRGB_NOALPHA.TextOut((can_width)/2,can_height/2,"canvas_XRGB_NOALPHA",ColorToARGB(clrBlue,255),TA_CENTER|TA_VCENTER);
Text output - the image processing type for the canvas. The text color is in ARGB format and alpha channel of 255, that is the color of the displayed text is completely opaque.
The displayed text is snapped horizontally (TA_CENTER) and vertically (TA_VCENTER) to the center of the rectangle.
canvas_XRGB_NOALPHA.FillCircle((can_width)/2,can_height/2+50,25,ColorToARGB(clr_Circle,255));
Painting a filled circle. We will draw the circle over the color, which fills the canvas (canvas_XRGB_NOALPHA.Erase(ColorToARGB(colr, alpha));).
This is to show that a shape drawn on the canvas (or an area/point) completely covers an underlying image on the canvas. That is, there is no repainting on the canvas, since the last drawing completely covers the underlying area.
canvas_XRGB_NOALPHA.Update();
To display all the drawn objects on the screen, we need to refresh the screen.
The other two canvases are drawn similarly: the canvas with the display mode COLOR_FORMAT_ARGB_RAW and the third one with COLOR_FORMAT_ARGB_NORMALIZE:
   canvas_XRGB_NOALPHA.Update();

//--- create canvas COLOR_FORMAT_ARGB_RAW
   if(!canvas_ARGB_RAW.CreateBitmapLabel("canvas_ARGB_RAW",can_x2,can_y2,can_width-1,can_height,COLOR_FORMAT_ARGB_RAW))
     {
      Print("Error creating canvas: ",GetLastError());
      return(-1);
     }
   canvas_ARGB_RAW.Erase(ColorToARGB(colr,alpha)); //clrNONE,0));
   canvas_ARGB_RAW.TextOut((can_width)/2,can_height/2,"canvas_ARGB_RAW",ColorToARGB(clrBlue,255),TA_CENTER|TA_VCENTER);
   canvas_ARGB_RAW.FillCircle((can_width)/2,can_height/2+50,25,ColorToARGB(clr_Circle,255));
   canvas_ARGB_RAW.Update();

//--- create canvas COLOR_FORMAT_ARGB_NORMALIZE
   if(!canvas_XARGB_NORMALIZE.CreateBitmapLabel("canvas_XARGB_NORMALIZE",can_x3,can_y3,can_width-1,can_height,COLOR_FORMAT_ARGB_NORMALIZE))
     {
      Print("Error creating canvas: ",GetLastError());
      return(-1);
     }
   canvas_XARGB_NORMALIZE.Erase(ColorToARGB(colr,alpha));
   canvas_XARGB_NORMALIZE.TextOut((can_width)/2,can_height/2,"canvas_XARGB_NORMALIZE",ColorToARGB(clrBlue,255),TA_CENTER|TA_VCENTER);
   canvas_XARGB_NORMALIZE.FillCircle((can_width)/2,can_height/2+50,25,ColorToARGB(clr_Circle,255));
   canvas_XARGB_NORMALIZE.Update();
   return(0);
  }
The canvas and the graphical objects within the canvases have been drawn.
Now let's add the loop, which will change the transparency of the entire canvas:
   canvas_XARGB_NORMALIZE.FillCircle((can_width)/2,can_height/2+50,25,ColorToARGB(clr_Circle,255));
   canvas_XARGB_NORMALIZE.Update();
   //--- transparent from 255 to 0
   uchar transparent;
   for(transparent=255;transparent>0;transparent--)
     {
      canvas_XRGB_NOALPHA.TransparentLevelSet(transparent);
      canvas_XRGB_NOALPHA.Update();
      canvas_ARGB_RAW.TransparentLevelSet(transparent);
      canvas_ARGB_RAW.Update();
      canvas_XARGB_NORMALIZE.TransparentLevelSet(transparent);
      canvas_XARGB_NORMALIZE.Update();
      Sleep(50);
     }
   canvas_XRGB_NOALPHA.TransparentLevelSet(transparent);
   canvas_XRGB_NOALPHA.Update();
   canvas_ARGB_RAW.TransparentLevelSet(transparent);
   canvas_ARGB_RAW.Update();
   canvas_XARGB_NORMALIZE.TransparentLevelSet(transparent);
   canvas_XARGB_NORMALIZE.Update();
   Sleep(6000);
   return(0);
  }
The transparency for all the canvases is changed using the code lines:
.TransparentLevelSet(transparent)
After the end of the drawing, we need to clean up, i.e. remove graphical resources.
Since we have created the graphical resources with reference to the chart object (method CreateBitmapLabel), let's remove the resource using the Destroy() method, which will also delete the chart object (Bitmap Label):
   canvas_XARGB_NORMALIZE.Update();
   Sleep(6000);
   //--- finish
   canvas_XRGB_NOALPHA.Destroy();
   canvas_ARGB_RAW.Destroy();
   canvas_XARGB_NORMALIZE.Destroy();
   return(0);
  }
The script that smoothly changes the transparency is working.
The difference between modes COLOR_FORMAT_ARGB_RAW and COLOR_FORMAT_ARGB_NORMALIZE is better visible if you first run the script in the white chart background, and then in black.
Conclusion
The article covers the basics of working with color. We have learned how to draw objects in a chart window. The article also discusses the basics of working with the CCanvas class of the Standard library and the ARGB format of color representation with transparency.
This is just the basics, and there are still much more opportunities to explore for creating various graphical effects in the MetaTrader 5 terminal. This article deals with transparency: it is the partial transparency that gives the most attractive form for edging graphical objects. Due to the two-dimensional character of monitors, transparency in the chart is an illusion achieved by processing of pixels.
Translated from Russian by MetaQuotes Ltd.
Original article: https://www.mql5.com/ru/articles/1341
Warning: All rights to these materials are reserved by MetaQuotes Ltd. Copying or reprinting of these materials in whole or in part is prohibited.
This article was written by a user of the site and reflects their personal views. MetaQuotes Ltd is not responsible for the accuracy of the information presented, nor for any consequences resulting from the use of the solutions, strategies or recommendations described.
 Bi-Directional Trading and Hedging of Positions in MetaTrader 5 Using the HedgeTerminal API, Part 2
 Optimization. A Few Simple Ideas
 Trading Ideas Based on Prices Direction and Movement Speed
 Bi-Directional Trading and Hedging of Positions in MetaTrader 5 Using the HedgeTerminal Panel, Part 1
- Free trading apps
- Over 8,000 signals for copying
- Economic news for exploring financial markets
You agree to website policy and terms of use
30%
I just gave you the solution at a quick glance. Maybe it's more complicated and I'm wrong.
10%
The first will retain 40 per cent of the light, the second 50 per cent. Together they will retain 90 per cent of the light. So both glasses together will let in 10 per cent of light.We can put it this way:
The first glass reduces the intensity of the light passing through by 40 per cent. The second glass reduces the intensity by 50%, but since it only receives 60% of the original light, it will halve it by half. So that's 30 per cent of the original intensity.
I agree.
You could reason it this way:
The first glass reduces the intensity of the light passing through by 40 per cent. The second glass reduces the intensity by 50%, but since it only receives 60% of the original light, it will halve it by half. Then you get 30 per cent of the original intensity.
I agree.