
Principles of Exchange Pricing through the Example of Moscow Exchange's Derivatives Market
Table Of Contents
- INTRODUCTION
- CHAPTER 1. THE THEORY OF EXCHANGE PRICING
- CHAPTER 2. CLEARING METHODS OF THE DERIVATIVES SECTION OF MOSCOW EXCHANGE
- CONCLUSION
Introduction
In the middle of 2011, the MetaTrader 5 trading platform was certified for the Russian stock exchange "Russian Trading System" (RTS), which has been combined with the Moscow International Currency Exchange (MICEX) into a single Moscow Exchange. Undoubtedly, this is a landmark event. It has opened up an opportunity for many traders to try themselves in stock trading, while still using the familiar and reliable MetaTrader terminal. Another important event happened recently: MetaTrader 5 has become available in Moscow Exchange's FX Market enabling real currency spot trading on a transparent exchange platform.
Despite these remarkable events, exchange trading is considered something mysterious, especially by forex traders. This article is aimed at dispelling the mystery. It is the result of a great effort at creating HedgeTerminal - a special system inside MetaTrader 5, which allows traders to comfortably perform their trading activities in the conditions of the Exchange environment.
This material is a good starting point in the study of trading. It gives the basics, so experienced exchange traders will hardly find anything new here. However, real communication with experienced traders shows that many simple "exchange basics" are new for them. Another important point is that the information about the specifics of exchange trading is scattered throughout the Internet, poorly structured and inconsistent. Moreover, description of the many nuances is simply unavailable. Therefore, it is important to make up a single well systematized and comprehensive source of related information. I hope this article will be just such a source.
Descriptions of the whole process of exchange trading, the theory of pricing and clearing techniques are given in details, and are accessible to mainstream users. The article is not overloaded with formulas. Moreover it has no source code in MQL5, which often prevails in the materials on this site. The information is intentionally represented in an easy to read format. Here is the famous aphorism by Stephen Hawking from the preface of his book "A Brief History of Time":
"Someone told me that each equation I included in the book would halve the sales. I therefore resolved not to have any equations at all. In the end, however, I did put in one equation, Einstein's famous equation Е=mc^2. I hope that this will not scare off half of my potential readers."
Following the example of the famous physicist, we will remove the excess from the article, and focus only on the most important points, which will be represented not by equations or computer code, but by diagrams, charts and tables. However, we will not simplify.
The material presented in this article requires mental work from the reader to grasp it. This article is not fiction. It requires a careful reading.
Chapter 1. The Theory of Exchange Pricing
1.1. Sellers
Like on any normal market, on the exchange there are multiple sellers offering the same goods, and multiple buyers who want to buy the goods. All sellers make up the so called offer stating the ask price. Sellers want to sell their goods as expensive as possible; buyers want to buy goods as cheap as possible. Sellers can set different prices for their goods. Prices may vary, even if the goods from different sellers are exactly the same. This variety stems from different expenditures of the sellers required for obtaining the goods. Also, each of the sellers have their profit expectations, which are not always equal to the expectations of others.
Prices vary also because the number of sellers is very large. They have no opportunity to meet together and determine one common oligopoly ask price. If some of the sellers gather to define the price, others will not follow their example. This means that if a group of sellers set a higher price for their goods, buyers will still be able to buy the same goods cheaper - from other sellers.
So, we have found that the prices of the same product from different sellers differ. The goods offered by sellers being the same, and the prices being different, the sellers start to compete with each other. This is because the buyer has a choice to buy the same goods from different suppliers at different prices, which means that the buyer will always prefer to buy the product from the seller offering the lowest price.
The competition of the sellers is best explained in a table. This table consists of several rows, each of which includes the name of the seller, the price at which the seller can sell the goods, and the volume of goods that the seller can sell. The fact is that every seller has a limited amount of goods to sell. This quantity can be expressed in ounces, or number of contracts or something else. The main thing to remember is that the resources of sellers and buyers are always limited. Sellers cannot sell an infinite amount of goods, while buyers cannot buy an infinite amount. Therefore, in addition to the prices of sellers, the table shows also the volume of goods the seller can sell. Similarly, the table of buyers will represent the volume of goods that they can buy.
The table is sorted by price. The sellers with the lowest prices are at the bottom of the table, the sellers with the highest prices are at the top.
Suppose we want to buy a few ounces of gold in the gold market. Here is a sample aggregate offer by sellers in the form of this table:
| Seller, # | Price, $ per a troy ounce of gold | Number of ounces (Contracts) |
|---|---|---|
| Seller 5 | 1280.8 | 13 |
| Seller 4 | 1280.8 | 60 |
| Seller 3 | 1280.3 | 3 |
| Seller 2 | 1280.1 | 5 |
| Seller 1 | 1280.0 | 1 |
Table 1. Sellers' offer
We will get back to the table later, but now let's move on to the buyers.
1.2. Buyers
As already mentioned, in addition to the sellers, any developed market has a lot of buyers. All buyers make up the so called demand stating the bid price. Unlike the seller who want to sell their goods as expensive as possible, buyers want to buy goods as cheap as possible.
However, the buyers have different view of the true value of the goods. That expensive for some customers, may seem cheap for others. That is why buyers are ready to pay different prices for the same goods. Like sellers, buyers can set their own prices for purchased goods. For example, a buyer can place an order to buy goods, provided that the goods will be sold at no more than a certain price that the buyer sets in the order.
There being too many buyers, they cannot meet together to set an oligopoly bid price. Inadequately low bid price set by any buyer or group of buyers would be uncompetitive - there are many other buyers ready to buy goods from sellers at higher prices. Since different buyers are ready to pay different prices for the same goods, they begin to compete with each other. This is because the seller has a choice to sell their goods to different buyers, and the sellers always prefer to sell their goods to anyone who can buy at a higher price.
The competition among buyers is most easily visualized as the same table that describes the competition of sellers, with the only difference being that the top row of the table features the buyers who are ready to offer the highest buying price, while buyers with lower prices are featured at the bottom.
Here is an example of the gold market. Here is a sample demand buy buyers:
| Buyer, # | Price, $ per a troy ounce of gold | Number of ounces (Contracts) |
|---|---|---|
| Buyer 5 | 1279.8 | 2 |
| Buyer 4 | 1279.7 | 15 |
| Buyer 3 | 1279.3 | 3 |
| Buyer 2 | 1278.8 | 12 |
| Buyer 1 | 1278.8 | 1 |
Table 2. Buyers' demand
Like the table of sellers, this one contains a column with the volume of goods that the buyers are willing to buy. Remember that the demand is not infinite and the desire to buy is always limited by the buyers' resources.
1.3. Matching Sellers and Buyers. Exchange Depth of Market
We have analyzed the buyers and sellers and found that they may have different expectations about the goods they want to sell or buy. These expectations can be represented as sorted tables, where the sellers offering the goods at the lowest price for their goods are featured at the bottom of the table of sellers, and buyers willing to pay the highest price are at the top of the table of buyers.
The rows of these tables can be regarded as trade requests or orders to buy or sell a certain volume of goods at a certain price.
The information featured in these tables can be simplified. First, information on specific sellers or buyers can be omitted, because the commodity itself is important to us, and not someone who is willing to sell or buy. It really doesn't matter whether we buy it from Seller 1 or Seller 2. What's important is the price and amount of the goods that we can buy.
Since we can skip information about the seller or the buyer, we can combine their proposed volumes and prices in simple levels. Each of these levels can indicate the price and the total volume offered buy sellers or requested by buyers at the same prices.
Let's consider another offer table, this time for silver:
| Seller, # | Price, $ per a troy ounce of silver | Number of ounces (Contracts) |
|---|---|---|
| Seller 5 | 19.3 | 21 |
| Seller 4 | 19.3 | 15 |
| Seller 3 | 19.1 | 3 |
| Seller 2 | 19.0 | 5 |
| Seller 1 | 19.0 | 8 |
Table 3. Sellers' offer
Here "Seller 1" and "Seller 2", as well as "Seller 4" and "Seller 5" have set similar prices: $19.0 and $19.3 respectively.
We simplify this table, removing uninformative column "Sellers" and joining the same prices into one level, their volumes are summed up:
| Price, $ per a troy ounce of silver | Number of ounces (Contracts) |
|---|---|
| 19.3 | 36 (21+15) |
| 19.1 | 3 |
| 19.0 | 13(5+8) |
Table 4. The total offer of the sellers
Now we do not know how many sellers are willing to sell us silver at $19.0. All we know is that their total volume for sale is 13 contracts. Whether they are offered by one seller or thirteen is unknown. Sellers gathered in such groups will sell their goods in turn.
The one who has placed an order first will be the first to sell goods. Clearly, if there are no buyers willing to buy the whole offered volume, it is important to be first in the queue of orders to sell goods prior to other sellers, because there will be no buyers for the last seller. Therefore, when it comes to high-frequency trading or HFT, the speed of order placing is of great importance. This method of trading requires special equipment and high-speed communication channels.
It may seem that our simplified table ignores a lot of useful information. Knowing whether we buy from a large market player or a handful of small ones may be useful. Order placing time and status of order execution can also be useful. But this is a large amount of data, and even if such data are available, they should be paid separately. For example, Moscow Exchange provides full orders log with this kind of information at extra cost.
Now that we have removed unnecessary information from our tables, we can combine them. To do this, we connect the top of the buyers table with the bottom of the sellers table. Not to be confused who is who, let's use different colors for buyers and sellers. We use pink for the sellers and blue for the buyers. The resulting table is called Depth Of Market or DOM.
| Price, $ per a troy ounce of gold | Number of ounces (Contracts) |
|---|---|
| 1280.8 | 17 |
| 1280.3 | 3 |
| 1280.1 | 5 |
| 1280.0 | 1 |
| 1279.8 | 2 |
| 1279.7 | 15 |
| 1279.3 | 3 |
| 1278.8 | 13 |
Table 5. Exchange Depth Of Market
It may look different in different exchange trading terminals, but the essence is the same - this table shows buy and sell orders of a selected trading instrument.
The Depth Of Market looks a little different in the MetaTrader 5 trading terminal, but the principle is similar:
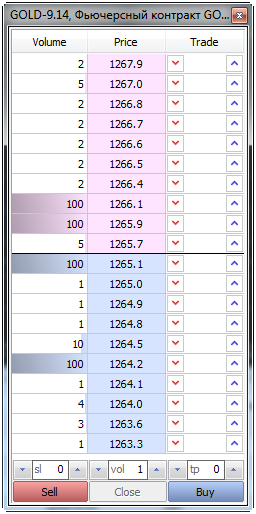
Figure 1. Depth Of Market for the GOLD-9.14 futures contract
1.4. Types of Orders in MetaTrader 5
Let's see the details of how the DOM works. We first buy, and then immediately sell 17 ounces of gold. As mentioned above, our intentions are called orders or trade requests. We have a choice of how to buy:
- We can buy gold at a price which is offered at the moment by sellers in the volume we need.
- We can place an order to buy gold at a required price, in the required amount.
In the first case, we agree with the price offered by sellers. In the second case, we set the buying price. In the first case our order will be executed by market. In the second case, our request has a price limit, below which it cannot be executed, and it will be placed into a common DOM as a limit order.
This is a fundamental difference in the way trades are carried, which entails different mechanisms for the execution of our orders and determines the properties of our execution of trade orders.
Our intentions are not abstract concepts. Intentions are formalized in a trade request or order. Trade requests in MetaTrader 5 are called orders, and there are a few types of them. If we want to buy or sell by market, i.e. we agree with the price offered by demand or supply, then the following types of orders are used:
- Buy – buy at the current Ask price provided by the offer or at a higher price.
- Sell – sell at the current Bid price or cheaper.
- Buy Stop – Buy when the current Ask price is equal to or higher than the one specified in the order. In this case, the price at the moment of placing the order must be lower than the price specified in the order.
- Sell Stop – Sell when the current Bid price is equal to or lower than the one specified in the order. In this case, the price at the moment of placing the order must be higher than the price specified in the order.
If we want to buy or sell goods at prices that we set, the following types of orders should be used:
- Buy Limit – Buy at the price equal to or lower than the one specified in the order.
- Sell Limit – Sell at the price equal to or higher than the one specified in the order.
Unlike Stop and Market orders, limit orders guarantee that their execution price will be no worse than the price stated in them.
In addition to these types of orders, MetaTrader 5 provides special algorithmic order Buy Stop Limit and Sell Stop Limit. These specific orders are implemented at the level of the MetaTrader 5 terminal and its back end. In fact they are synthetic or algorithmic orders of MetaTrader 5 but not of the exchange. They are a combination of Stop and Limit orders, and play an important role in monitoring losses arising from potential slippage and execution at non-market prices.
1.5. The Concept of "Deal"
A trade request or an order is executed in one or several deals. The other party in these deals is a counterparty who meets our conditions. Suppose we want to buy two ounces of gold in the market, where there are only two sellers, each of which sells only one ounce. We need to negotiate a sales contract or simply a deal with each of these sellers. So, our decision stated in one order will be executed in two deals with two different sellers (counterparties).
Just like the order, the deal is not an abstract concept. In MetaTrader 5 deals are represented by the concept of the same name "deal". In MetaTrader 5 committed deals are featured in the "Toolbox" window on the "History" tab.
Each executed order has at least one trade. An executed order can have multiple deals. Each trade always has only two counterparties. One deal belongs to two traders and their trading accounts, but every trader sees only his or her deals and orders in the system, that is why deal identifiers may seem unique.
In MetaTrader 5, any broker operation on the account is also considered to be a deal. Of course, such deals do not have any initiating orders.
The connection between an order and its deals can be easily represented in the form of a diagram:
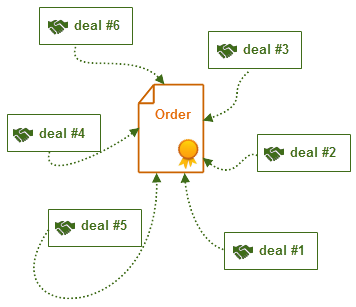
Figure 2. Schematic representation of the relationship of deals and orders
Please note that the connection between deals and the order is one-sided. An order "does not know" what deals belong to it, while deals on the contrary, contain a unique identifier of the order, on the basis of which they were committed. This is because at the moment an order is placed, deals have not yet been conducted, which means their identifiers are unknown. On the contrary, an execution of a market deal is always preceded by an order, and therefore it is always possible to determine the exact order that initiated this deal.
1.6. The Process of Selling and Buying. Slippage. The Concept of Liquidity
Suppose we are ready to accept the offer of sellers and choose market execution.
Once again look at the Depth of Market:
| Price, $ per a troy ounce of gold | Number of ounces (Contracts) |
|---|---|
| 1280.8 | 17 |
| 1280.3 | 3 |
| 1280.1 | 5 |
| 1280.0 | 1 |
| 1279.8 | 2 |
| 1279.7 | 15 |
| 1279.3 | 3 |
| 1278.8 | 13 |
Table 6. Exchange Depth of Market
Out of all available prices, we want to buy gold from the seller offering the lowest price. The lowest price is $1280.0. However, only one ounce is available at this price. We have to buy the remaining 16 ounces from other sellers offering gold at higher prices. We buy 5 contracts at the price of $1280.1, 3 contracts at $1280.3 and the rest 8 contracts at $1280.8. The average value of bought 17 ounces differs from the price of the best offer. Let's calculate it:
(($1280.0 x 1 oz.) + ($1280.1 x 5 oz.) + ($1280.3 x 3 oz) + ($1280.8 x 8 oz.)) / 17 oz. = (10246.4 + 3840.9 + 6400.5 + 1280.0) / 17 oz. = $21767.8 / 17 oz. = $1280.46 per troy ounce (1 contract).
We have calculated the weighted average value of 1 ounce of gold that we bought. It is $0.46 higher than the best offer. This is because both sellers and buyers have limited liquidity.
Liquidity is the ability of market participants to buy from you and sell to you the amount of goods you are interested in, at prices close to the market one.
The higher the liquidity, the greater the amount of goods you can buy or sell at the best prices. The lower it is, the farther your average buy or sell price from the best price. This effect is called slippage. Here is its definition:
Slippage is the difference between the weighted average buy (sell) price and the best ask (bid) price.
More generally, the slippage is defined as the difference between the weighted average buy or sell price, and the price specified in the order to make this Buy or Sell deal. However, this definition is more uncertain and involves more problems, because it is possible to make a trade request in such a way that the desired price specified in it is much worse than the current price (differs by astronomical figures), however, this order will be immediately executed by market.
The fact that the actual order execution price is better than that indicated in the order by the same astronomical value, still does not mean that we actually got a positive slippage, which can be converted into a profit on the trading account. Well, "fine words butter no parsnips". Therefore, we use a more precise definition of slippage.
The effect of slippage is almost unnoticeable in the FOREX market. The bulk of the liquidity of this market is offered by professional players, such as banks and liquidity providers. Buying or selling a currency for the average private trader almost always corresponds to the best bid or ask. That is why the importance of the Depth of Market for Forex is not that high as for exchange trading.
After we buy the required gold amount, the Depth of Market presented in the table above will change.
The sellers that have sold us their gold will leave the market, because we have completed their offer:
| Price, $ per a troy ounce of gold | Number of ounces (Contracts) |
|---|---|
| 1280.8 | 9 |
| 1279.8 | 2 |
| 1279.7 | 15 |
| 1279.3 | 3 |
| 1278.8 | 13 |
Table 7. Liquidity change in Depth Of Market
Now let's try to sell the gold that we have just bought to the buyers who want to buy it. Remember, these buyers are displayed at the bottom of the table and are marked in blue. Like with sellers, buyers' liquidity is also limited. Selling gold to buyers, we also incur additional costs in the form of slippage.
As seen from the Depth Of Market, we can sell 2 ounces at $1279.8 and 15 ounces at $1279.7. Our average selling price (exit from gold) in this case is equal to $1279.71 per ounce. If there were fewer contracts at 1279.7, our slippage would have been even greater.
After we sell the bought contracts, the state of the DOM also changes. Now it looks like this:
| Price, $ per a troy ounce of gold | Number of ounces (Contracts) |
|---|---|
| 1280.8 | 9 |
| 1279.3 | 3 |
| 1278.8 | 13 |
Table 8. Liquidity change in Depth Of Market
It turns out that our actions have reduced the overall liquidity of the instrument. Previously, there were 26 gold ounces (17 + 3 + 5 + 1) for sale, now there are only 9 ounces.
The same thing happened on the demand side: traders we were ready to buy 33 gold contracts (2 + 15 + 3 + 13), and now only 16. If we again want to buy a certain amount of gold, there can be not enough liquidity and our buy order will be executed only partially or not executed at all. The same applies to sales, as they also need liquidity.
Real Depth Of Market in the terminal can display blank price levels, they appear as white empty rows on the tables above. The empty levels can also be hidden. For example, one and the same Depth Of Market in MetaTrader 5 in the maximized and minimized form will be as follows:
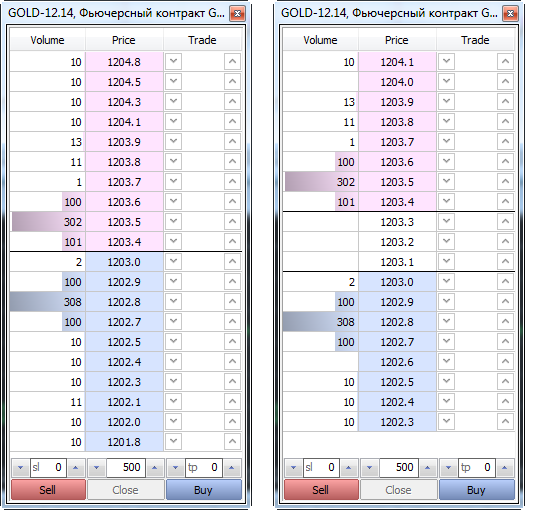
Figure 3. Depth Of Market with price gaps (right) and without price gaps (left)
1.7. Why Does the Price Move?
Let's visualize our actions as a chart, where the X axis conditionally shows times or the sequence of deals and the Y axis shows the price of gold.
The red line visualizes dynamics of the best offer (Ask), the blue one shows the dynamics of the best demand (Bid), and green one shows the price dynamics of the last deal (Last).
Our deals appear as triangles on the chart:
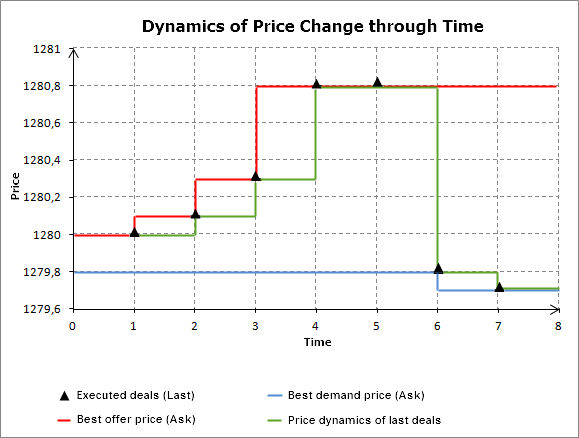
Figure 4. Schematic diagram of the price changes over time
As seen from the chart, our actions not only reduced the overall market dynamics, but also changed the price! The price on the exchange is the price of the last concluded deal (Last). Since we first bought and then sold gold at different prices, the last price was constantly changing due to our actions.
Pay attention to deals #4 and 5. They have the same price. This is due to the fact that there can be multiple buyers or sellers at the same price level. However, each deal always has only two parties - the buyer and the seller. When there are multiple sellers, we contract one deal with each of them. The deals can have different volumes. Deals form long sequences of ticks on one price level.
On a tick chart they appear as straight lines consisting of multiple points (ticks):
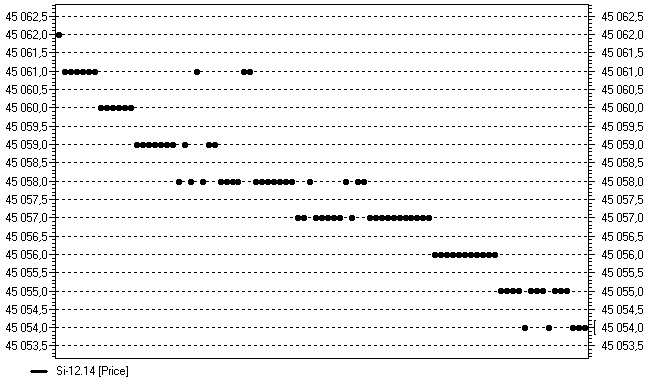
Figure 5. Sequence of ticks
The MetaTrader 5 terminal provides a chart similar to the price dynamics change diagram, through which you can monitor changes in Ask, Bid and Last prices in real time.
To open this chart, choose the required instrument in the Market Watch window and switch to the Ticks tab:
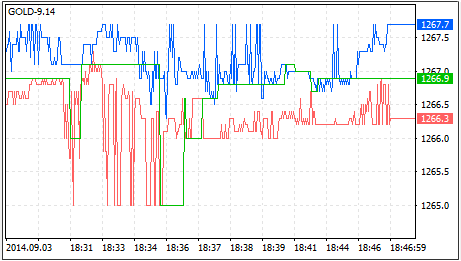
Figure 6. Representation of the tick stream in MetaTrader 5
In this chart, the best offer price (Ask) is shown as a blue line, and the best demand price (Bid) is displayed as a red line. The price of the last deal (Last), like in the previous chart, is shown as a green line.
The flow of deals (ticks) is shown in the special video available in section "1.12 Common supply and demand, Buy and Sell orders" of this article.
Please pay attention to the difference between the best selling price (red line) and the best purchase price (blue line). This difference is called spread. With each conducted deal spread increased, since the number of sellers and buyers willing to sell or buy at the best prices was gradually reduced. Since we bought and sold at the prices available in the market, we satisfied the orders of sellers and then buyers, after which they left the market. We can say that we "swallowed up" market liquidity. On the other hand, the market price moved following our operation. Without our deals, buyers and sellers would have stood apart, waiting for the first one who would agree with the proposed price of the other side.
The diagrams, among other things, show exactly which party initiated the deal - the party wishing to buy or to sell. As seen from the chart, our buy deal made the Last price equal to Ask and a sell deal made Last equal to Bid. In the future, the stream of all completed deals will be available in MetaTrader 5 in a special table of all trades "Time & sales". The table displays all committed deals, their volume, price, and who initiated the deal - the buyer or the seller.
This window may look like the following one from the Quik terminal:
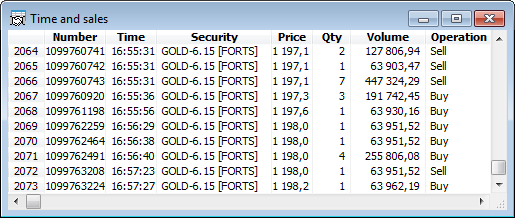
Figure 7. Table of all deals in Quik
1.8. Market Makers
It is important to remember that in moments of strong price change, the spread can be very large, and liquidity can fall. At such moments, entering the market at market prices can be very costly: the value of slippage will be substantial. This happens frequently in low liquidity markets with a small number of participants. Even in the relatively quiet moments, entering such markets may be accompanied by high costs for slippage and spread. To minimize costs and encourage traders to trade in these markets, the exchange can attract professional market makers, whose main task is to maintain the market liquidity at a reasonable level and keep the spread within the narrow limits from the market price.
Let's refer to the original Depth Of Market for Gold and see how it would look like with market makers in the market:
| Price, $ per a troy ounce of gold | Number of ounces (Contracts) |
|---|---|
| 1280.8 | 17 |
| 1280.3 | 3 |
| 1280.1 | 500 |
| 1280.0 | 1 |
| 1279.8 | 2 |
| 1279.7 | 500 |
| 1279.3 | 3 |
| 1278.8 | 13 |
Table 9. Market makers in Depth Of Market
Large amounts are concentrated on levels $1280.1 and $1279.7. Depth Of Market does not show who provides the amount and how many participants possess them. They may well belong to the typical market maker who puts large-volume mirror Buy and Sell orders. Without the market maker, the average weighted gold buying price was $1,280.46, with the market maker it would be close to $1280.1. We would have bought the main amount of gold from the market maker. The effect of the sale would be imperceptible, but only because our volumes are insignificant.
Market makers are "defenders" of the exchange market. They increase liquidity and prevent spread extension. On some low-liquidity markets, such as the Russian options market, usually market makers are counterparties in your deals. In this case, the question arises: if the market maker, who is usually a large company, is willing to buy from you and sell to you large amounts, then is your expectation of future price change really correct?
The operation of market makers is regulated by the exchange they are working on. Market makers are obliged to be in the market for a certain percentage of time or during certain trading hours, they are obliged to keep the spread within certain limits and to provide certain amounts of liquidity. Exchange, in return, provides certain benefits for the market makers, like payment of fees or pays some fee to the market makers.
However, the exchange does not guarantee any profit to market makers. They should develop their own algorithms which comply with the exchange rules while generating profits. The success of market makers is largely due to lower commission costs they incur. Many strategies that do not pay off the general exchange rates can generate profits at the reduced commission, and market makers benefit from it.
1.9. Limit Orders and Their Execution
We have examined in detail the market execution of orders and described the effects that arise from execution of such orders.
Imagine now that we do not want to put up with the slippage and will not agree with the price offered by buyers and sellers. Instead, we set our own buying and selling prices. Now we state the price to the seller, when we want to buy a product. We will also set prices to the buyers, when we decide to sell it. Let's buy again our 17 gold contracts, but this time we will use a limit order.
Here is our original Depth Of Market:
| Price, $ per a troy ounce of gold | Number of ounces (Contracts) |
|---|---|
| 1280.8 | 17 |
| 1280.3 | 3 |
| 1280.1 | 5 |
| 1280.0 | 1 |
| 1279.8 | 2 |
| 1279.7 | 15 |
| 1279.3 | 3 |
| 1278.8 | 13 |
Table 10. Exchange Depth Of Market
There are other participants who want to buy gold. The best buyer price is $1279.8. Suppose that we are ready to set the best possible price (of all available on the market) and buy 17 ounces of gold at a price of $1279.9 or less. So we issue a special limit order to buy gold at the specific price.
Once our order is sent, it appears in Depth Of Market together with other participants' orders:
| Price, $ per a troy ounce of gold | Number of ounces (Contracts) |
|---|---|
| 1280.8 | 17 |
| 1280.3 | 3 |
| 1280.1 | 5 |
| 1280.0 | 1 |
| 1279.9 | 17 |
| 1279.8 | 2 |
| 1279.7 | 15 |
| 1279.3 | 3 |
| 1278.8 | 13 |
Table 11. A limit order in Depth Of Market
Depth Of Market has changed. You see the buyer who wants to buy 17 ounces of gold. This is us!
We and all market participants can see our order now. Now anyone who wants to sell their gold on the market, will first sell it to us, and only then proceed to the following buyers, because our buy offer is the best one. However, unlike market execution, execution of our limit order is not guaranteed. If there is no seller willing to sell their gold, our limit order will stay in Depth Of Market. Remember, deals are initiated by market orders, not by limit ones.
In addition, a buyer may come willing to buy gold by market, which will move the price of the last deal due to up slippage. Other buyers can respond to this change and open limit orders above our one, and this will shift us from the highest position in the queue of orders.
This is how Depth Of Market changes after someone buys 10 gold contracts by market:
| Price, $ per a troy ounce of gold | Number of ounces (Contracts) |
|---|---|
| 1280.8 | 16 |
| 1279.9 | 17 |
| 1279.8 | 2 |
| 1279.7 | 15 |
| 1279.3 | 3 |
| 1278.8 | 13 |
Table 12. Changes in Depth of Market
If buyers appear, who are ready to buy gold at a higher price than offered by us, we will be shifted down:
| Price, $ per a troy ounce of gold | Number of ounces (Contracts) |
|---|---|
| 1280.8 | 16 |
| 1280.3 | 15 |
| 1280.1 | 10 |
| 1280.0 | 3 |
| 1279.9 | 17 |
| 1279.8 | 2 |
| 1279.7 | 15 |
| 1279.3 | 3 |
| 1278.8 | 13 |
Table 13. Change in Depth Of Market
Our limit order has just moved into the middle of Depth Of Market. We were unable to compete with the best buy offers. If the price continues to go up, our order will not be executed at all.
1.10. Partial Execution of Orders
Partial execution of orders is one of the most important features of the exchange execution. Partial execution occurs when liquidity in the market is not enough or when limit orders are used.
An interesting feature of the exchange limit order is the ability to state a limit price in it, which will be worse than the current price.
Let's look at our DOM once again:
| Price, $ per a troy ounce of gold | Number of ounces (Contracts) |
|---|---|
| 1280.8 | 17 |
| 1280.3 | 3 |
| 1280.1 | 5 |
| 1280.0 | 1 |
| 1279.8 | 2 |
| 1279.7 | 15 |
| 1279.3 | 3 |
| 1278.8 | 13 |
Table 14. Exchange Depth of Market
We can set a limit buy order, stating its limit price above $1280.0, for example $1280.3! How will our order be executed in this case?
In Depth Of Market, three sellers offer their goods at prices better than our stated price or equal to it. Their total amount is 9 ounces (1 + 5 + 3).
Exchange will match their limit orders with our order, and the rest 8 (17 - 9 = 8) ounces of gold will appear in the DOM in the place of these sellers:
| Price, $ per a troy ounce of gold | Number of ounces (Contracts) |
|---|---|
| 1280.8 | 17 |
| 1280.3 | 8 |
| 1279.8 | 2 |
| 1279.7 | 15 |
| 1279.3 | 3 |
| 1278.8 | 13 |
Table 15. Execution of a limit order
Our limit order has just been partially executed. Some of the stated volume was filled immediately by available sellers, and the rest part was left to wait for new sellers in the DOM. This is very important for any trading system, operating in the exchange execution mode. It should take into account the possibility of partial execution of orders and placing of limit orders at a worse price than the current one. The further life of our limit order is unknown. On high-liquidity markets, it is likely to be filled in full: sellers who agree with our price will come and satisfy our demand. The order can also remain partially filled until it is canceled.
With limit orders you can easily control your maximum slippage. If you want to limit it to a certain level, simply set the limit order at this level. On the one hand, its execution price will never be worse than the price indicated therein. On the other hand, there will always be some amount of liquidity filling it immediately, at least partially.
1.11. Properties of Limit and Market Orders
We have considered the basic types of orders. It is the time to describe the properties of the market and limit orders. We outline these important and fundamental properties:
A market order guarantees its fulfillment, but does not guarantee the price at which will be executed. A limit order guarantees the price at which it will be executed, but does not guarantee its execution.
A market order changes the price to worse and is subject to slippage, but can always be executed. A limit order does not change the prices and is not subject to slippage, but its execution is not guaranteed.
Of course, even the execution of a market order can fail in the absence of liquidity. But markets with such a low liquidity should be avoided, and we do not consider extreme cases.
We have also found that an order is executed by concluding one or more deals. The orders can be executed fully, partially or not executed at all. These are important features that need to be taken into account when developing a reliable trading system. These properties are even more important for Hedge Terminal type systems, where deals and orders are bound with each other so that they constitute a single logical transaction with an entry point and an exit point, as well as supporting orders that implement operation of Stop Loss and Take Profit.
The trader decides what types of orders to use. However, none of the order types has a clear advantage over the other type. In highly volatile markets, it is sometimes better to enter with a large slippage, using a market order, than to place a limit order and have it executed partially or not executed at all.
In high-liquidity markets and when trading small volumes, slippage is small and the resulting costs of market orders may be less than the cost of lost profits in case of partial execution. On the other hand, in low-liquidity and slow markets, placing market orders is extremely dangerous. They can lead to huge slippage and even bankrupt a trader. In any case, try to keep a balance between your expectations and the price the market can offer.
1.12. Common Supply and Demand, Buy and Sell Orders
Now that we've analyzed limit orders and their execution features, we can proceed to some interesting properties, which can be observed on centralized exchanges, like Moscow Exchange.
Every day, tens of thousands of traders make deals on the exchange. Many of them put limit orders, and many traders buy at current prices. Deals at current prices are executed immediately. Relatively speaking, the trader enters the market, sees the current prices and buys.
Until the moment of buying, the trader's intent is unknown. The situation is different with limit orders.
As we remember, the limit order does not move the price. As a rule, it is set in the DOM and then waits to be executed, when the Sell or Buy price becomes appropriate. Due to this, the exchange may collect interesting statistics on such pending intentions. For example, in real time, you can watch the total number of buyers and sellers, as well as the total volume of supply and demand.
- Total demand is the number of all contracts to buy at limit (pending) prices. In fact, it is the total liquidity of the DOM from the demand side.
- Total Offer is the number of contracts to sell at limit (pending) prices. Similarly to the total demand, the total supply shows the total liquidity of the DOM from the supply side.
- The total number of sellers is the total number of sellers willing to sell an asset at their specified limit prices.
- The total number of buyers is the total number of buyers willing to buy an asset at their specified limit prices.
Analysis of information on the total supply/demand dynamics and changes in the number of participants can help you develop interesting strategies based on predicted crowd behavior. Such strategies are called 'sentiment analysis'.
Due to exchange specifics, this information is available in real time. MetaTrader 5 receives this information. But the terminal does not provide any table or chart visualizing this information the way it is done in Quik. However, using the special programming language MQL5 for MetaTrader 5 you can create a user table of any kind or a special tick chart displaying this information exactly as the user needs. Development of such programs is beyond the scope of this article, therefore we will not program such an "indicator" now (which would have been a very exciting though time consuming task).
Let's use a ready-made solution. Thousands of different programs have been written for MetaTrader 5. They are either available in the free Code Base or in the specialized Market of trading applications for MetaTrader.
Both free and paid applications are available in the Market. One of such programs is IShift by Yuri Kulikov. It is designed for real-time monitoring of changes in supply and demand, as well as the number of traders willing to buy and sell exchange contracts. This is exactly what we need to demonstrate these properties.
In this program, the dynamics of supply and demand is shown at the top. In the very beginning of the video it is highlighted by an arrow "Session buy/sell volume sentiment":
This information is only available on centralized exchanges. This makes it possible to create unique strategies, working only on a centralized market.
1.13. Comparison of Marker Order Execution Systems and Trade Presentations in MetaTrader 5 and MetaTrader 4
The previous terminal version MetaTrader 4 provides a simplified representation of trader's actions. In MetaTrader 4, all transactions actually appear as orders. An order in MetaTrader 4 can be pending, canceled, active and closed. The concept of "open" and "closed" order on exchange is pointless because, as described above, an exchange order is an order to buy or to sell. The order will be executed or not. The order cannot be "closed" or sold back at the current price. You can only sell or buy back the asset that was bought on the basis of this order by sending an opposite order to the exchange.
Thus, the exchange order and in particular the MetaTrader 5 order significantly differ from the concept of order in MetaTrader 4. An order in MetaTrader 4 is a kind of transaction that combines market entry and exit. It optionally can include additional conditions to limit the maximum loss on this transaction (Stop Loss) and/or fix a certain level of profit (Take Profit). An order in MetaTrader 5 is what it really should be - it is an order to buy or to sell.
In MetaTrader 4, an executed order does not give any idea of who has performed it. While in MetaTrader 5, an order is executed by deals. They give an idea of how many contractors have executed our order and at what price. Availability of this information increases execution transparency.
While analyzing Depth Of Market in MetaTrader 5, we can calculate the approximate slippage before entering into a deal. It cannot be done in MetaTrader 4.
MetaTrader 5 provides transparent mode of partial order filling through independent representation of orders and deals. In fact, the total volume of deals relating to this order is either equal to amount specified in the order, which means the order is executed, or it is less, and then the order can be considered in process or partially executed. In MetaTrader 4, order execution can also be partial in large volume trading in real conditions. In this case, it is not clear whether the partial fulfillment is the result of real lack of liquidity, or it is due to broker's counteraction against successful trading. It simply does not provide any information confirming partial execution (deals).
Execution of a trade request only in a particular case may be a discrete (momentary) event. The execution of an order often takes some time. See the example of such performance in the section describing partial fulfillment of a limit order. A part of this order was filled by several deals, and the other part entered the "standby" mode, waiting for the appropriate price. The order in this case is in the process of execution, making more and more deals.
Due to the deals, the order state is always extremely clear and transparent. The order execution stage can be monitored whenever you need it. In MetaTrader 4, order state is undefined during execution. We cannot see what happens to it during execution.
Chapter 2. Clearing methods of the derivatives section of Moscow Exchange
This chapter is intended for those who are already trading in the derivatives section of Moscow Exchange, as well as those who are still eyeing this exchange and plan to trade derivatives in the future.
In the first chapter we have discussed the specific exchange pricing, now is the time to learn how the exchange regulates transactions between parties. This information will help us to better understand how an exchange broker sees our positions and our committed deals. This vision is significantly different from that presented in MetaTrader 4, where any trading activity is an independent transaction with an individual trading result.
We will discuss clearing through the example of the derivatives market of Moscow Exchange, i.e., the section in which the futures and options are traded. This is due to the fact that in 2011 MetaTrader 5 was certified for RTS (Russian Trading Systems) which has been combined with MICEX (Moscow International Currency Exchange) into a single Moscow Exchange.
2.1. The Concept of Futures
Futures and futures based options are traded on the derivatives section of Moscow Exchange.
Futures is a standardized contract for the supply of commodities, valid till a certain date, called the expiry of the futures.
Commodities can be represented by any asset, like company shares, gold, currency or equity indices, which have no physical substance. A futures contract is a contract between a seller and a buyer. The seller undertakes to deliver the asset at a future point (delivery date), and the buyer agrees to purchase the asset from the seller at the agreed price. Obviously, the asset price can rise or fall by the date of delivery. Therefore, the seller and the buyer of the futures contract undertake the risks associated with price changes.
A lower price on the futures expiry date is beneficial for the seller, because the seller has already sold the asset at a higher price. A higher price is beneficial for the buyer, because the buyer has already bought the asset at a lower price. Thus, the difference between the price at the time of contract negotiation and the price on the delivery date is important. The seller and the buyer may negotiate not to deliver goods physically. Instead, the seller and the buyer simply receive the difference between the price at the time of contract negotiation and the price during its expiry. Futures contracts with this kind of settlement are called cash-settled.
In contrast, futures, after the expiry of which goods are physically delivered, are referred to as physical. Description of the delivery procedures is beyond the scope of this article, therefore, in our examples futures means cash-settled futures since it is easier to understand and its settlement model until expiration is similar to the deliverable physical futures. In fact, the cash-settled futures resembles a contract for difference, or CFD (Contract For Difference) negotiated between two parties, however it features a greater transparency and is traded on centralized trading platforms, like the derivatives section of Moscow Exchange.
It is obvious that at the time of settlement, one of the parties will have a negative result and the other one will have a positive result due to the price change. Their results are different in absolute terms, but are modulo equal. Thus, we can say that futures trading is a zero-sum game. Although the amount of loss and profit is the same for everyone involved, it can be unevenly distributed among them, and therefore, it is possible to make a profit at the expense of less informed market participants.
Let's analyze the following example. August 5th, 2014 at 10:00 am we bought a cash-settled futures contract of gold at $1292.1 per troy ounce, that is we entered into a long position. The futures expiry date is August 7th, 2014 at 18:45. Suppose that by this time the price of gold will grow and reach $1306.6. The second party of our contract agrees to pay us the difference between these prices.
Thus, at the time of expiration, we will receive profit from the second party in the amount of $14.5 ($1306.6 - $1292.1 = $5.14). If the price of gold during this time fell, we would pay the difference.
The figure below shows this situation:
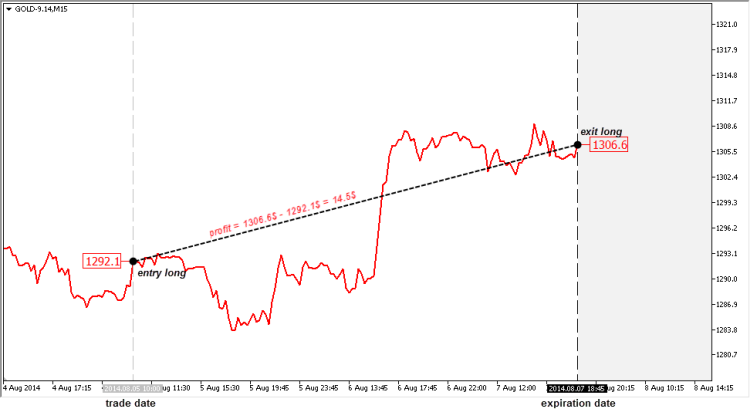
Figure 8. A futures contract and the time of its expiry
The vertical dotted lines indicate position entry and exit due to the expiry of the futures contract.
However, we do not have to wait for the expiry of the futures. We can exit from a deal at any time, by selling our bought contract to another participant.
In this case, the settlement will be the same as it would be at the time of expiration: the difference between the contract buy and sell is either written off from our account or debited to it. However, there are some specific features of how this price difference is calculated. You'll learn these differences and nuances later.
2.2. The Concept of "Open Interest" and "The Total Number of Open Positions"
A very interesting property can be traced from the futures definition; it is available only for this type of contract.
Unlike spot commodities, such as shares or currencies, futures always have two contractors. One of them sells a contract and the other buys the contract.
Suppose trader A decides to buy a futures contract. There are two options in the market:
- Trader A can repurchase a futures contract from trader B, who decided to sell the previously bough contract. In fact, trader B assigns his right under the contract to trader A. In this case, there is no need to enter a new futures contract, it will be enough just to pass the old contract from trader B to trader A. Trader B in this case, leaves the market and trader A, on the contrary, takes his place. The total number of participants does not change.
- Having entered the market, trader A cannot find participants ready to transfer their right of contract ownership. In this case, the trader will have to wait for the new trader C willing to negotiate a new contract and sell a futures to sign a new contract and sell the futures to the new trader. In this case, the total number of participants increases by two: new traders A and C come to the market.
The total number of positions is the total number of positions that were concluded for futures contracts. It is always an even value, since each contract has two counterparties.
Open interest or OI is the number of negotiated futures contracts. To obtain the value of OI, divide the total number of positions by two.
The total number of members can either rise or fall. For similar reasons, if two traders on opposite sides of the deal want to mutually withdraw from the market, their contract is canceled. In this case, the total number of members is reduced by two, and the open interest, which shows the total number of contracts, decreases by one, because one contract corresponds to two parties.
Due to specific organization, Moscow Exchange has a unique opportunity to track the total number of market participants in real time. In other markets, such information usually is limited. For example, on Chicago Mercantile Exchange (CME) information on Open Interest is calculated only at the end of the day, and is published only a few days after the completion of trades.
In MetaTrader 5, information on the Open Interest (number of open positions) is available in real time, but special programs in MQL5 are required for accessing it. Some information about this and about one such program is available in section "1.12. Common Supply and Demand, Buy and Sell Orders" of this article.
2.3. Futures Margin. The Concept of "Leverage"
Since the futures is a commodity contract, rather than the commodity itself, then you can buy and sell goods not owning them. On the one hand, participants are able to trade commodities regardless of prices, on the other hand, its absolute price dynamics may be too large for small deposits of exchange participants.
So, if the price of gold has changed from $1292.1 to $1306.6, then we can say that the price of gold has increased by 1.1% (($1306.6 - $1292.1)/$1292.1). On the other hand, if we enter into a futures sell contract with $100 on our account, a similar change in the price of gold would write off from our account $5.14, which corresponds to -14.5% of the account. This is a significant figure.
To balance out the desire of participants to make deals in the markets with their capabilities, exchange charges initial margin or IM, which is a special deposit which acts as a guarantee of participant's solvency. The ratio between the initial margin and the current level of prices of the futures contract is called maximum leverage. The classical definition suggests that the leverage is the ratio of equity and borrowed funds used to buy an asset. In futures trading the concept of borrowed funds is not used, because there is no physical purchase of goods. The broker gives us a credit, and we do not pay the interest rate for its use.
Let's consider an example of specification of a futures contract for gold traded on the Derivatives Market of Moscow Exchange.
We open MetaTrader 5 connected to one of the brokers who provides access to Moscow Exchange, in Market Watch select "GOLD-9.14" if it is available there or otherwise add it by selecting this instrument in the "Symbols" window:
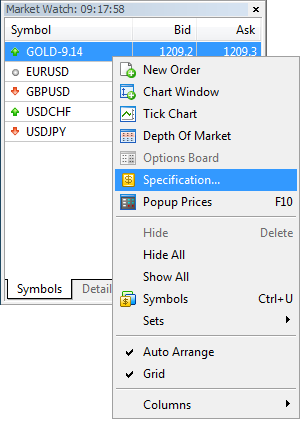
Figure 9. Access to instrument specifications through MetaTrader 5 menu
By clicking the right mouse button we open the context menu of this instrument and go to "Specification..."
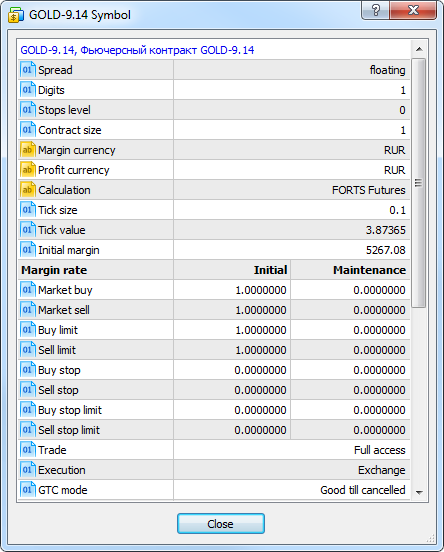
Figure 10. Futures contract specification window
The initial margin value for the instrument is specified in the "Initial Margin" field. It corresponds to the value of 5267.08 rubles. All calculations on Moscow Exchange are carried in rubles, so all the values are specified in rubles. What does this figure mean?
When a contract is concluded, the broker locks this amount on our account as a margin. If our total account balance is 5268 rubles, we will be able to buy one futures contract to buy or sell 1 troy ounce. So with the current gold price of $1292.1 and the rate of 38.7365 rubles per 1 US dollar, our conditional leverage would be: ($1292.1 * 38.7365)/5268 rubles = 9.5 or 1:9.5
Due to the fact that the initial margin is significantly lower than the price of the commodities underlying the futures contract, it is possible to use complex diversification strategies combining futures and risk-free assets. For instance, instead of simply buying gold, we can buy cash-settled gold futures with the leverage of 1:1 - deposit on our account the amount equal to the initial margin and additional funds to cover risk of price movements in the wrong direction, while depositing the remaining amount to a risk-free account with an interest rate in a bank.
2.4. The Concept of Clearing
Price can change significantly from the moment of contract negotiation until its expiration. The difference between the buying or selling price and the final price can be so significant, that one of the deal parties can fail to fulfill their obligations. To avoid this, the exchange regularly provides conversions between all participants, converting the difference in price into profits and losses of certain participants.
Such redistribution is called clearing procedure. To perform clearing, an exchange employs a special independent financial organization called clearing house. This is a way to avoid conflict of interests between the parties and to ensure transparency and impartiality of calculations.
By the procedure of clearing, exchange controls risks of traders and ensure fulfillment of obligations between parties. On Moscow Exchange, actual crediting and debiting on the account occurs at the time of clearing, or during settlement between the parties, rather than at the time of order closing, as is done in MetaTrader 4.
The brokers providing access via MetaTrader 4 and 5, control clients' risks in real time. If an open position in MetaTrader 5 or an order in MetaTrader 4 reaches a critical loss level, the broker instantly closes it requiring to pay additional margin (Margin Call). On Moscow Exchange, the requirement to increase initial margin come at the time of clearing, because the actual redistribution of funds between the parties happens during clearing.
The clearing procedure is complicated and takes time. On Moscow Exchange (successor of MICEX and FORTS), clearing takes place twice a day: from 14:00 to 14:03 (intraday clearing) and from 18:45 to 19:00 (evening clearing). No trading is held during this time. Before closing trading for clearing, the exchange fixes the price of the last deal. This price is called clearing price. It is the settlement price for all trade participants. All conducted deals and positions open at the time of the previous clearing are matched with this price. A little later we will look at the daily clearing, but let's focus on the main evening clearing for now.
2.5. Position Rollover through Clearing
Let's get back to our long position of gold and analyze it from the point of view of a broker and a clearing house.
The long position for the trader was opened on 05.08.2014 at 10:00 at the price of $1292.1 and closed on 07.08.2014 at 18:45 at the price of $1306.6 with the result +$14.5. However, two days passed between the events, and the clearing house recalculated three times, fixing the relevant settlement prices.
Here is our trading position in the form of a table with the time, price and event:
| Date | Price, $ | Event |
|---|---|---|
| 05.08.2014 10:00 | 1292.1 | Entering a long position for gold |
| 05.08.2014 18:45 | 1284.9 | Evening clearing. |
| 06.08.2014 18:45 | 1307.6 | Evening clearing. |
| 07.08.2014 18:45 | 1306.6 | Evening clearing. Futures expiry. Closing the long position. |
Table 16. Position Rollover through Clearing
Conventionally, our long position can be divided into three segments, each of these segments has its conditional price of entry and exit, as well as its financial result (the difference between the entry and exit price). This procedure is called rollover in MetaTrader 5.
Here is a table visualizing the segmentation:
| Period | Price of entry, $ | Price of exit, $ | Financial result, $ | Initiating event |
|---|---|---|---|---|
| 05.08.2014 10:00 - 05.08.2014 18:45 | 1292.1 | 1284.9 | -7.2 | Entering a long position |
| 05.08.2014 19:00 – 06.08.2014 18:45 | 1284.9 | 1307.6 | +22.7 | Rollover through clearing. |
| 06.08.2014 19:00 – 07.08.2014 18:45 | 1307.6 | 1306.6 | -1 | Rollover through clearing. |
| The final result: | +14.5 | Futures expiry, closing the long position. | ||
Table 17. Rollover through clearing
The total result in either case is identical and equal to $14.5, but in the first case, the calculation is performed only once calculating the difference between the position open and close prices, while in the second case a more complex calculation is involved, which divides the position into three time periods. The result in both cases is always the same, because the level of the clearing price can be any, it does not have to be equal to the actual price of the last deal.
You can easily check this by replacing the price by any other clearing price. Again, the result is equal to the classical calculation, because the additional gain or loss derived from the price difference on the first day before clearing will always be covered by the additional loss or gain on the second day. However, the clearing price is not always exactly the same as the price of the last deal accessible through the terminal.
In the example above, position rollover actually results in three independent positions. These positions have individual entry and exit prices and the financial result (see the table above). However, for the convenience of traders, no new position is created in MetaTrader 5 after clearing, although strictly speaking this should be done.
Instead, it leaves the old position, but changes its entry price. This price is equal to the last clearing price. The unrealized profit of the position changes accordingly. Thus, although the position still exists after rollover, in fact that's another position with its opening price and unrealized financial result.
The table above is better illustrated through the following chart:
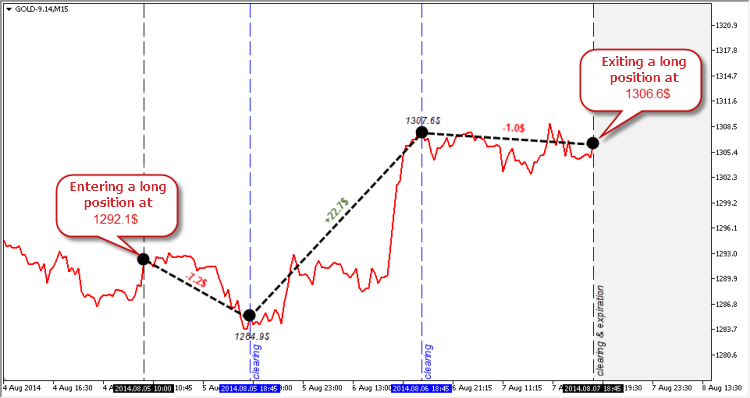
Figure 11. The process of clearing and position rollover
2.6. Variation Margin and Intraday Clearing
Variation Margin is the floating financial result for the account which is not fixed by clearing. Variation Margin is an indicative figure which calculates an approximate financial result of your deals and open positions on the basis of current prices. The analogue of the variation margin on the Forex market is the concept of equity. However, floating profit or loss in the Forex market can stay for an indefinite period.
The evening clearing on Moscow Exchange fixes the variation margin regardless of a trader's wish and reflects the appropriate financial result of the clearing on the trader's account. Thus, every evening at the time of clearing, the variation margin is reset.
Intraday clearing is a special intermediate clearing, which Moscow Exchange performs to assess the current positions of the market participants and to more accurately redistribute risks between them. By the time of the intraday clearing, the variation margin is recorded in the special field of accumulated income in the brokerage account. Unlike the variation margin, the accumulated income can be used as an additional initial margin for making new deals and increasing the cumulative position of the instrument. However, the accumulated income is not used in the calculation of the main evening clearing, so the intraday clearing procedure can generally be ignored.
2.7. The Upper and Lower Price Limits
The intraday and evening clearing procedures effectively cope with the redistribution of financial responsibility between the exchange trading participants, and effectively control their risks. However, even these measures are not enough sometimes. In particularly dramatic moments, the market price can vary so much in a short time, that by the time of the next clearing many of the participants will not be able to fulfill their financial obligations. To avoid this situation, the exchange sets upper and lower price limits, and if these price levels are reached, acceptance of trading orders and redistribution of liabilities among the participants is temporary halted.
Price limits are individually set for each market at the time of opening of a new trade session. When the limit is reached, the exchange restricts the flow of certain orders for a few minutes, redistributes the risks between the parties and then removes the restrictions, setting new limits calculated based on the current price. In addition to risk control, the exchange limits allow participants to cool off: very often upon reaching the limit, the market reverses or begins to trade quietly. However, the limits are reached quite rarely. Therefore no convincing statistics of price behavior can be drawn from these cases.
Limit levels are specified on the official website of Moscow Exchange. For example, to see the price limit of the Futures on USD/RUB Exchange Rate Si-12.14 for the current day (12/12/2014), check the relevant sections in its specifications, in the figure below they are shown in a red frame:
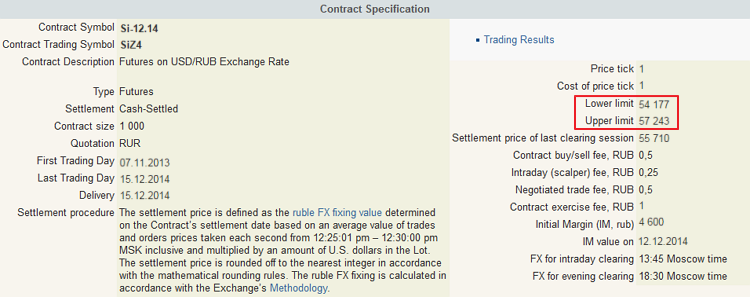
Figure 12. Upper and lower price limits on the contract specification page
In MetaTrader 5, limits are accessible through its software interface. For example, price limits can be obtained using a script and shown in the terminal panel:
2014.12.12 13:04:07.875 GetLimitValue (Si-12.14,H1)     Lower price limit: 54177
2014.12.12 13:04:07.875 GetLimitValue (Si-12.14,H1)     Upper price limit: 57243
Now let's see how reaching the price limit looks on the chart. Let's see the futures contract Si-12.14. It features dramatic moments in the history of ruble. In fact, this is the global devaluation of the ruble. At such moments, the volatility is very high and limits are reached very often:
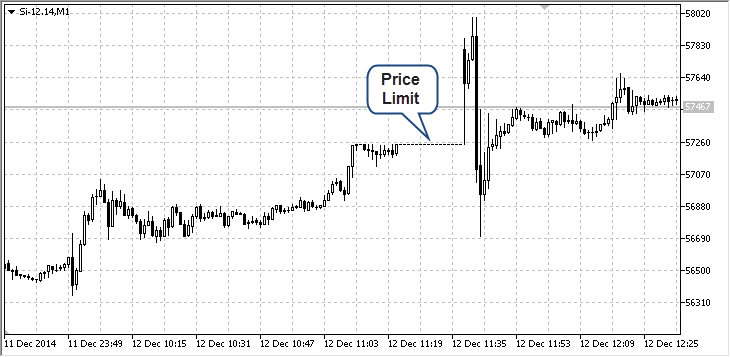
Figure 13. Price limit reached
On the chart the reached price limit appears as a row of several bars whose prices Open High Low Close are equal. There can be multiple limits during one session. When the limit price is reached, orders are still accepted, but the prices in these orders cannot be above the upper or below the lower limit prices. Otherwise, the order shall be rejected by the exchange.
Reaching the limit is a serious challenge for trading robots. They need to identify such situations and correctly execute their logic. Although such situations are rare, a well-designed exchange robot should take them into account.
2.8. Conversion Operations and Indicative Rate Calculation
The results of classical and exchange calculations match only if the calculation value of a point is always the same. If the futures price is indicated in a currency other than the trader's account currency, additional currency conversion is required. In these cases Moscow Exchange uses the special indicative course, which is based on a combination of rates by Thomson Reuters and exchange's own rate obtained from currency trading in Moscow Exchange's Forex market.
Details of indicative rate calculation are described in the document "Methodology for calculation of indicative foreign exchange rates" stored on the exchange's file server. We will focus only on the main points of the methodology, you need to know for a proper understanding of conversion operations on the exchange.
Since the calculation exchange rate is floating, the point value of futures, the price of which is quoted in foreign currencies, is constantly changing. Thus, the value expressed in the account currency of the same number of points is different during different clearing times! We already know that the exchange redistributes the financial result among all participants during the evening clearing from 18:45 to 19:00.
By the time of the evening clearing, this rate is generated as the average price of the appropriate currency trading for the last minute to 18:30 Moscow time. Similarly, the conversion rate by the time of intraday clearing is formed as the average price for the last minute to 13:45.
During non-trading hours of Moscow Exchange's Forex market, the rate by Thomson Reuters is used. However, in our case, we are interested only in two prices: the price of the last trade or Close of 1-minute bar at 14:44, and the price of the last deal or Close of the 1-minute bar at 18:29.
The list of indicative rates for any period can be found on web http://moex.com/en/derivatives/currency-rate.aspx?currency=USD_RUB.
The list is available in the form of a conventional table and in XML, which, for example, can be use by trading algorithms for accurate calculation of trade results:
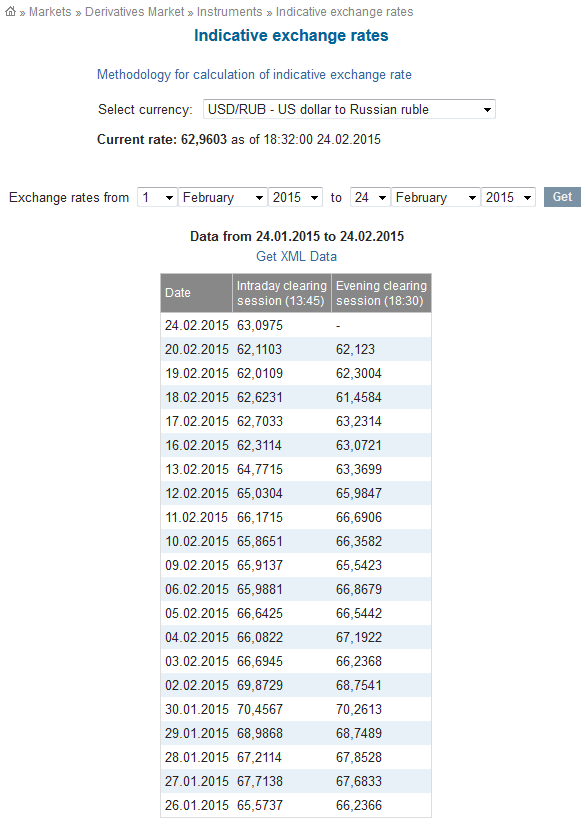
Figure 14. Indicative currency rates on moex.com
MetaTrader 5 provides a separate indicative instrument FORTS-USDRUB visualizing the rates on charts.
Here is the chart:
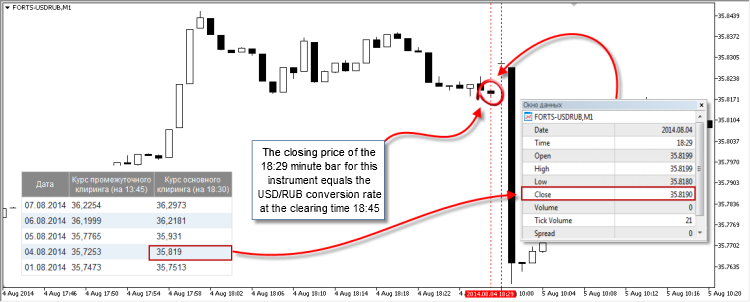
Figure 15. Chart of the indicative instrument FORTS-USDRUB
2.9. Calculating Deals and Positions at the Clearing Price
Now that we have a general idea of how futures contracts are calculated, let's try to calculate the financial result of our deals without resorting to the broker calculations, because the best way to deal with the problem is to try to solve it yourself.
Let's analyze the following task. Four orders to buy and to sell gold were placed from 2014/09/24 to 2017/09/25. These orders were filled in several deals.
Here is a table from MetaTrader 5, which describes the situation:
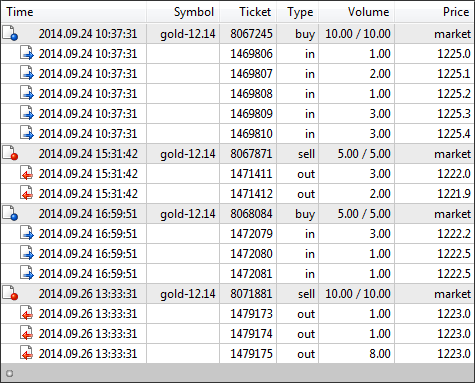
Figure 16. Representation of executed trade operations in MetaTrader 5
Based on the table displayed in MetaTrader 5, here is a table containing the calculation of these trading operations:
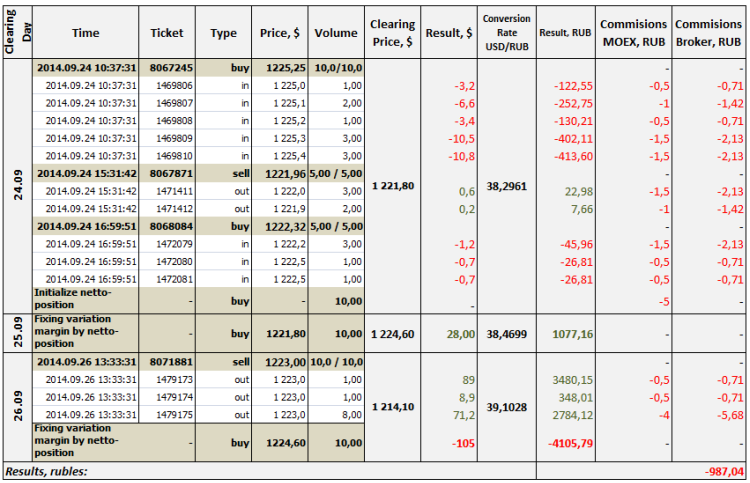
Table 18. Full clearing
Orders in this table, as well as net positions are marked by brownish-green, deals are white and calculations are gray.
The "Clearing Day" column divides trade operations into clearing days – time intervals from 19:00 of the previous day to 19:00 of the current day. The next five columns are familiar to us from the previous table of deals and orders in MetaTrader 5. They contain the time the order was placed and the deal time, the order number of the order or the deal, entry price and volume. Orders in the "Price" column contain weighted average entry price of all related deals.
The "Clearing Price" column features the clearing price or the price of the last deal for the symbol trading session on the relevant date ClearingDay. This price can be obtained from the analysis of the Close price of the last 1-minute bar at 18:44. Also, the price is indicated in the "Trade Results" table generated by the exchange for each instrument and published in the symbol specifications section.
Our gold futures' table is available at: http://moex.com/en/derivatives/contractresults.aspx?code=GOLD-12.14:

Figure 17. Futures contract trade results published on moex.com
The "Results, $" column shows a simple difference between the deal price and the clearing price multiplied by the deal volume. For Buy operations it is equal to (Clearing Price – Deal Price) * Deal Volume. For Sell operations: (Deal Price – Clearing Price)* Deal Volume.
Column "Conversion Rate USD/RUB" features conversion rate as of 18:30 of the current clearing date. As already mentioned, this rate is available in the MetaTrader 5 terminal in the form of an indicative instrument, and as a special table of conversion rates on the exchange site.
"Result, RUB" contains results of all deals and positions in rubles. Knowing the conversion rate specified in column "Conversion Rate USD/RUB", you can easily calculate the ruble result of each deal and position according to the formula: Result, $ * Conversion Rate USD/RUB. For example, the result of deal №1469806 is -$3.2 * 38.2961 = 122.55 rubles.
The next two columns contain the fees charged by the exchange and the broker for execution of deals. A little more details on it. On Moscow Exchange, fee is charge both by the Exchange and the broker providing access to it. The broker charges a commission from the client in accordance with the tariff plan.
For example, the brokerage company "Otkritie" charges fees of 0.71 rubles per contract from the clients whose accounts are larger than 20000 rubles. This price is listed in the table as a base one. Commission of the exchange involves a more complicated calculation. Separate commission fees are set for each instrument. It consists of two parts and is specified in the contract specification section - "Contract buy/sell fee" and "Intraday (scalper) fee".
For our gold example, it is available at: http://moex.com/en/contract.aspx?code=GOLD-12.14
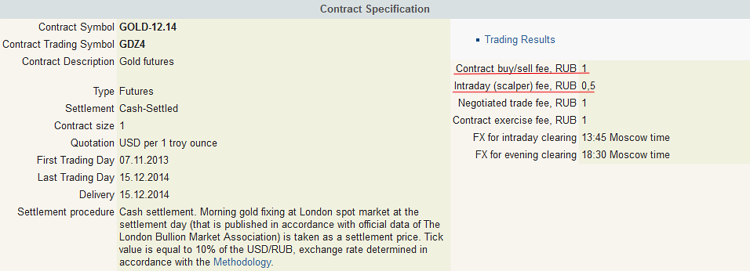
Figure 18. Contract specification on moex.com
The exchange also takes a commission from each bought or sold contracts, but the market divides all committed transactions into Scalping and Non-scalping. A scalping deal is a deal of the volume that does not generate a net position at the time of clearing.
Here is an example. Two deals of one contract buying and selling are executed during a trading session, their total value or the net position at the time of clearing is zero: 1 buy + 1 sell = 0. No net position will be generated after clearing. Both of these deals are considered scalping and subject to the relevant tariff "Intraday (scalper) fee": 0.5 rubles per contract.
If two contracts are bought and one is sold, a long net position of 1 contract (2 buy + 1 sell = 1 buy) is formed during clearing. One contract generates a net position, so it will be treated as a non-scalper deal, and the remaining volume is "scalper". The fee for the two contracts is 2*0.5 = 1 ruble, and 1 more ruble is charged for 1 non-scalper contract. The total commission is 2 rubles.
At the moment the deal is negotiated, it is yet unknown whether the deal is scalper or not. So scalper fee can be charged immediately, while the remaining fee for the non-scalper deal is charged based on the net position when it is being generated. This method is simpler and clearer, and it is used in the table above.
The calculation formula can be represented as follows:
Scalper Fee * (Sum(buy) + Sum(sell)) + (Non-scalper Fee - Scalper Fee) * Module(Sum(buy) - Sum(sell))
I.e. the volume of all deals negotiated during a trading session is summed up, and then multiplied by the Scalper Fee.
Then the absolute difference between the cumulative amount of all buy and sell deals is calculated (it forms the volume of a net position), and this difference is multiplied by the base fee (non-scalper fee is twice the fee for a scalping deal) and then summed up with the initial fee amount.
Once all of deals are calculated, a net position is formed during clearing on the basis of their total volume. This operation is marked as "Initialize netto-position" in the table and appears during clearing 2014/09/24 at 18:45. The non-scalper fee displayed in the table is calculated based on the net position ((1.0 rubles - 0.5 rubles) * 10 contracts = 5 rubles).
After the next trading session opens on 2014/05/25 at 19:00, variation margin is charged for this position, i.e. the difference between the position open (2014/09/24 clearing price) and the current price. Even if opposite directed deals are committed during the session, they will still be matched with the clearing price, not with this position.
Thus, the deals and the position will exist until clearing, which is clearly seen in the figure that shows these trading activities on a chart:
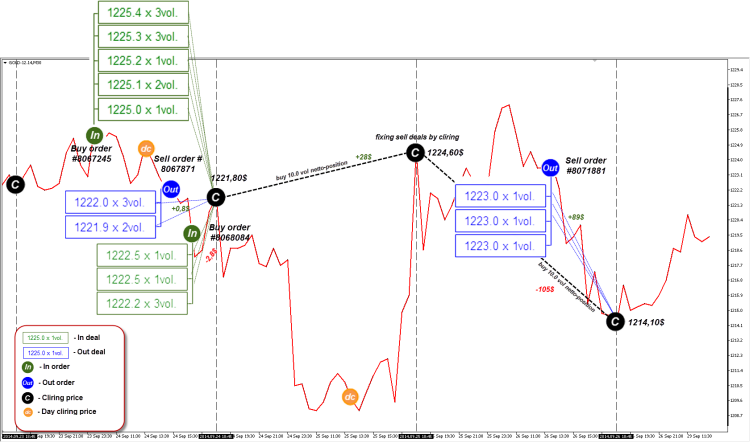
Figure 19. Clearing scheme
Pay attention to the last day, when the current position is "closed" by opposite deals. In fact, they do not close the position, they only fix its price. Position still produces a loss of -$105, but it is compensated by the profit from the opposite deals in the amount of +$89.
2.10. When a Closed Position is Not Completely Closed
In fact, the net position is close to the representation of traders' obligations. These obligations are inseparable from the clearing price, conversion rate and the individual calculation of each deal during the clearing day.
The difference between the calculated net positions and exchange calculation can be seen in the appearance of the unexpected and even paradoxical property. In MetaTrader 5, a closed position for an instrument quoted in foreign currency always has a fixed result expressed in the deposit currency.
This result is calculated at the close of the position and depends on the number of points earned and the conversion rate. The first value is always constant, it is obtained at the time the position is closed and is no longer subject to change. However, the conversion rate at the time of position closing can be floating (unrecorded yet). In this case, the cost of the same number of points will constantly change up until the rate is fixed.
In other words, if we closed a position say at three o'clock in the afternoon, its financial results would still vary slightly, up to 18:30, the time the conversion rate is fixed! Since MetaTrader 5 locks profits at the close, the broker conducts additional adjustments at the time of clearing by crediting the difference between the conversion rate at the time the position is closed and rate fixing time.
2.11. Analyzing Broker Report
To conclude the chapter, let's analyze a real account statement for one day. This is a report provided by broker "Otkritie".
The account statement can be ordered in the "personal account" on the site in several formats, but we will use a statement in pdf.
This statement covers one trading session of 2013/09/26. Let's consider it in detail:
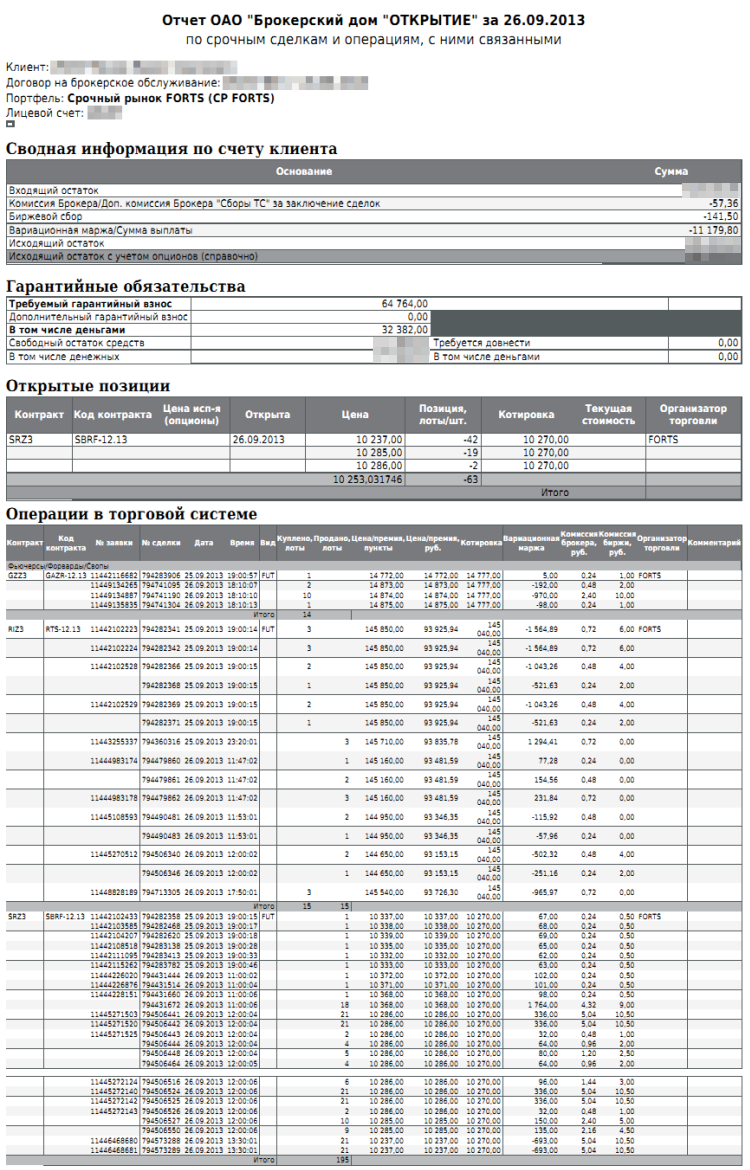
Figure 20. Standard report from "Otkritie"
Summary of the client's account - The table contains a summary of the final results for the selected period, in this case for one trading session.
Opening balance - Size of the account at the time the trading session was opened on 2013/09/25 at 19:00.
Broker commission - The total amount of brokerage commissions. Calculated based on the broker's rate. In this case, it is equal to 0.24 rubles for one contract. The total number of contracts concluded during the trading session was 239. Thus, the amount of brokerage commissions amounted to 239 contracts * 0.24 rubles = 57.36 rubles, which corresponds exactly to the value specified in this column.
Exchange fee - The total amount of fees charged by the exchange. 15 contracts of RTS-12.13 or RIZ3 were bought and sold during the session. The fee for each contract of RIZ3 is 1 ruble per a scalper deal and 2 rubles per a non-scalper deal. Thus, according to the formula presented above, we get the fees for the conclusion of these deals:
Fee = 1 ruble * (15 buy + 15 sell) + Module(15 buy – 15 sell) = 1 ruble * 30 + 0 = 30 rubles.
Similarly, we can calculate the total commission on other contracts. Their total amount will be equal to the value in this column: 141.50 rubles.
Variation margin - fixed profit or loss by the time of clearing on 2013/09/26 at 18:45. This section resulted with a loss of 11,179.80 rubles.
Closing balance - Calculated as follows: Incoming balance + Variation Margin + Broker commission + Exchange fee.
Margin requirements – The table mostly contains the value of the initial margin required to maintain current net positions. The actual value of the margin is specified in "Margin requirement", in this case it is 64,764 rubles. This margin was taken for the maintenance of a net short position for SRZ3 of 63 contracts. So, Initial Margin for one contract was 1028 rubles. Free balance is calculated as the difference between the closing balance and the required margin. This amount can be used as a margin for future deals.
Open positions - This table contains the active net position generated by the time of the current clearing. In our case, only one short 63-contract net position to sell SRZ3 was formed. However, by simply calculating the volume of all deals, we can find that their net amounts are not equal to our net position. In particular, the net position for all SRZ3 deals was 195 contracts to sell, and the net position for GZZ3 was 14 contracts to buy, although no position was formed for this instrument.
Where has the volume of these deals gone? Actually the information on positions is available only at the time they are formed. Thus, if a SRZ3 position is formed today, it will not be shown in the tomorrow report, however its variation margin will be fixed in the tomorrow report like for any deal. The same is true for positions formed the previous day (2013/09/25). They're just not visible. Thus, part of the deals concluded today, closed the previous positions that are not shown in the report. Analytically, we can calculate it out, that at the beginning of the current session the account already had an open 132-contract long position of SRZ3: -195 contracts + x = -63. X = -63 + 195 = 132 contracts.
If we downloaded the previous day report (2013/09/25), we would see that a new position was formed: a 132-contract long position of SRZ3 and a 14-contract short position of GZZ3, which were transferred to the current trading session. The variation margin of such "invisible" positions is calculated according to the rules described above, i.e., from "clearing to clearing".
Transactions in the trading system – This is the final table of the report. It contains information about deals executed during the current trading session. We will not calculate all the deals from the table, since we already know the method of calculation. Let's calculate variation margin of two deals, just to make sure that our calculation corresponds to the actual broker calculation. Let's take the first two deals of GZZ3 (deal number 11442116682 ) and RIZ3 (deal number 11442102223).
GZZ3 is a deliverable futures contract of Gazprom shares in the amount of 100 shares. It is quoted in rubles, so we do not need the additional conversion of its value into rubles. According to the report, the long deal was executed at 14,772 rubles. The clearing price for the contract in the "Quotation" column is equal to 14,777 rubles. To make sure that this is the price, check the contract page under "Trading results" on Moscow Exchange website. This price is listed in the column "Settlement Price" under the relevant date. So, the difference between the buying and selling price was 5 points: 14,777 - 14,772 = 5 points. One point equals to one dollar, hence, the deal result is equal to +5 rubles, which is specified in column "Variation Margin" in front of this transaction.
RIZ3 is a futures cash-settled contract of the RTS index. The calculation of its variation margin is a little more complicated. One point of this contract is 2 US cents ($0.02). Calculate the difference between the clearing price and the deal price: 145,040 - 145,850 = -810 points. Multiply the result obtained by 2 cents: -810 * $0.02 = -$16.2. This deal has brought a loss of -$16.2. Now convert dollars into rubles, for which we use the conversion rate for the current day. As you already know, it is available at http://moex.com/en/derivatives/currency-rate.aspx and is equal to 32.1995 rubles. Convert the result into rubles and multiply by the number of contracts bought: -$16.2 * 32 * 3 = -1564.8957 rubles. This value is exactly equal to the value in the broker's report.
2.12. Automating Calculations
MetaTrader 5 provides built-in features for generating reports based on the history of executed deals and orders. However, it does not support advanced reporting, such as separating the trading activities into algorithms. In addition, the method of calculation in MetaTrader 5 is still different from the methods of clearing settlements. However, MetaTrader 5 provides a new WebRequest() function.
The function is used by Expert Advisors to receive information from various web servers. For example, they can receive the clearing price and conversion rate directly from the site of Moscow Exchange. The availability of these values makes it possible to fully automate calculations of a trader's positions and calculate the financial results for each trading algorithm (Expert Advisor) separately by the method described above.
This is a complex and resource consuming calculation. Among other things, you will need to match clearing periods into single trading transaction. However, if this is done, traders will receive an incredibly accurate statistical tool, which in this case will have the utmost clarity and simplicity. Of course, such a tool will attract more potential traders to Moscow Exchange's Derivatives Market through the MetaTrader 5 trading terminal.
Conclusion
We have considered the basic questions of exchange pricing. I hope this information is useful for you.
The calculation carried out by the clearing house of Moscow Exchange is closely connected with issues of pricing. Accounting for the total position and rollover during clearing to the next trading session, execution of deals and calculating them using the clearing price make up a complex system of mutual obligations and redistribution between the participants. Presentation of net positions and deals in MetaTrader 5 organically fits the exchange clearing system, thereby making it possible to consider this platform as the basis for exchange trading, and use it to automate your trading.
Knowledge of the exchange pricing and nuances of settlements between participants pave the way for building reliable trading systems which can run in the exchange environment. In addition, knowledge about the formation of the price and its properties may give rise to further interesting research in the field of trading system development. For example, further study can concern the dynamics of open interest or overall liquidity of buyers and sellers, can be aimed to find patterns and predict the future price dynamics on the basis of previous changes in the structure of buyers and sellers.
These ideas are interesting, I hope that the knowledge outlined in this article, will be a good base for exploring them.
Translated from Russian by MetaQuotes Ltd.
Original article: https://www.mql5.com/ru/articles/1284
 Bi-Directional Trading and Hedging of Positions in MetaTrader 5 Using the HedgeTerminal Panel, Part 1
 MQL5 Cookbook: ОСО Orders
 Optimization. A Few Simple Ideas
 Building an Interactive Application to Display RSS Feeds in MetaTrader 5
- Free trading apps
- Over 8,000 signals for copying
- Economic news for exploring financial markets
You agree to website policy and terms of use
This is probably the best article I have read on this site, and I have read a lot of them.
Congratulations for this great article.
This article head my knowledge of the market to another level. Now I am determined to learn algorithmic scalping with the DOM.
The autor wrote a serie of articles about it for those who are interested.