Technische Indikatoren für den MetaTrader 5 - 84

With this indicator, you can predict future price behavior for a certain number of bars ahead, giving you the ability to anticipate market dynamics. The indicator draws a forecast line , which models potential future price values based on sophisticated algorithms analyzing past data. This information can be leveraged not only for market entry and exit decisions but also for setting or adjusting stop-loss levels to better manage your positions. Application of the Forecast The data provided by the
Order Block Tracker is here to solve one of the biggest challenges traders face: identifying order blocks. Many traders fail to spot these critical zones, often missing out on key market entries. But with Order Block Tracker , you no longer have to worry about that. This advanced indicator automatically highlights these crucial zones for you, giving you the confidence to enter the market at the right time. MT4 Version - https://www.mql5.com/en/market/product/123358/ Key Features of Order

Fractal Indicator Strategy is an advanced MetaTrader 5 indicator specifically designed for traders who use fractal analysis in their strategies. This indicator provides an essential tool for marking key levels on the chart with horizontal lines, making it easier to identify and follow fractal patterns in the market. Key Features: Fractal Horizontal Lines: Automatically draws horizontal lines at customizable intervals in pips, based on key levels essential for fractal analysis. These horizontal

This is the best indicator we have created by far, this indicator replicates the well known heiken ashi indicator, but with a more precise entry point, this indicator can work on all time-frames and is strong on all the time frames , this indicator does not repaint nor does it lag , this indicator strategy combined with price action will change your trading experience , elevate your experience to the next level.

Dieser MACD (Moving Average Convergence Divergence) Indikator hat folgende Eigenschaften: Separates Fenster: Wird unter dem Hauptchart angezeigt. MACD-Linie: Blaue Linie, die den Unterschied zwischen schnellem und langsamem EMA zeigt. Signallinie: Rote Linie, die den SMA der MACD-Linie zeigt. Histogramm: Graues Histogramm, das den Unterschied zwischen MACD- und Signallinie zeigt. Kauf-/Verkaufssignale: Grüne (Kauf) und rote (Verkauf) Pfeile an Schnittpunkten. Nulllinie: Graue gepunktete Linie,
Looking for EA to automate your trading strategy on the Forex market? TrendRocWaves Oscillator — your faithful companion in the world of trading! This manual trading system offers unique features:
- works exclusively on an hour(H1) timeframe for instant response to market changes. - uses the most popular and liquid currency pairs such as EURJPY, EURGBP, EURUSD, GBPUSD and USDCAD with minimal spreads and fast transaction execution. - applies a scalping method based on a medium-term trend to ac
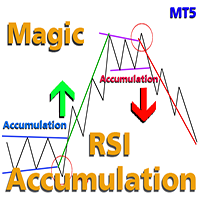
Magic RSI Accumulation is indicator like a magic ,"test it", it is no longer just an indicator but has turned into a strategy.. I will not talk much, try it and you will see for yourself. indicator is no repainting ever. blue and red boxes have become magic .. Just wait until they are completely penetrated and you will see the results .. test it on gold, oil, Dow Jones, Nasdaq, Bitcoin or currency pairs and you will understand its work quickly. You can also put it with other indicators to enha

This multi-currency annual dashboard analyzes the nearest high and low to the current price for a chosen number of recent years. It displays how many pips away the price is from the nearest high or low. You can set a pip threshold, and the alert will notify you when the price gets close to the specified levels. In real-time, the dashboard also provides an overview of the closest high or low values for each specific year, helping you make informed trading decisions.

Key level analysis : The indicator tracks the nearest annual high and low to the current price over a chosen number of years. Proximity alerts : It triggers an alert when the price reaches a specified number of pips from the nearest high or low. Customizable notification intervals : You can set how often alerts repeat, for example, every 30 minutes. Historical perspective : Enables long-term tracking of market levels and effective planning of trading strategies. Multi-currency support : This ind
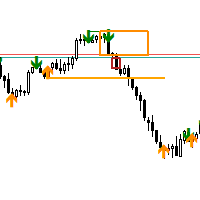
USIOLA SMC 1 is a specialized tool designed to enhance trading strategies by pinpointing high-probability trading opportunities on price charts. This indicator provides traders with a robust filtering mechanism to identify optimal entry and exit points. This indicator identifies setups which spot these sequence of events. BULLISH Bearish BOS Bullish CHoCH Bullish FVG Bullish Order Block
BEARISH Bullish BOS Bearish CHoCH Bearish FVG Bearish Order Block
FREE
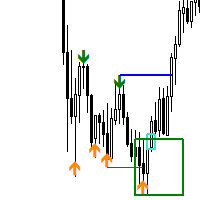
USIOLA SMC 2 is a specialized tool designed to enhance trading strategies by pinpointing high-probability trading opportunities on price charts. This indicator provides traders with a robust filtering mechanism to identify optimal entry and exit points. This indicator identifies setups which spot these sequence of events. While it shares the same logic of events with the Version 1, their sequence differs. BULLISH Bearish BOS Bullish CHoCH Bullish FVG Bullish Order Block
BEARISH Bullish BOS B
FREE

Swing Points Indicator for MetaTrader 5
The **Swing Points Indicator** is a custom-built technical tool designed for MetaTrader 5 (MT5), primarily used for identifying crucial reversal points in price action. By plotting swing highs and swing lows, it highlights potential trend reversals, making it a valuable tool for traders relying on price action analysis. This indicator helps traders anticipate changes in market direction by visually marking significant turning points on the chart.
Main
FREE
Der MetaTrader Market ist die beste Plattform für den Verkauf von Handelsroboter und technischen Indikatoren.
Sie brauchen nur ein gefragtes Programm für die MetaTrader Plattform schreiben und schön gestalten sowie eine Beschreibung hinzufügen. Wir helfen Ihnen, das Produkt im Market Service zu veröffentlichen, wo Millionen von MetaTrader Benutzern es kaufen können. Konzentrieren Sie sich auf dem Wesentlichen - schreiben Sie Programme für Autotrading.
Sie verpassen Handelsmöglichkeiten:
- Freie Handelsapplikationen
- Über 8.000 Signale zum Kopieren
- Wirtschaftsnachrichten für die Lage an den Finanzmärkte
Registrierung
Einloggen
Wenn Sie kein Benutzerkonto haben, registrieren Sie sich
Erlauben Sie die Verwendung von Cookies, um sich auf der Website MQL5.com anzumelden.
Bitte aktivieren Sie die notwendige Einstellung in Ihrem Browser, da Sie sich sonst nicht einloggen können.