Technische Indikatoren für den MetaTrader 5 - 77

Versus USD berechnet die Preisänderung jeder wichtigen Währung gegenüber dem USD und zeigt eine klare und vergleichende Ansicht ihrer Leistung für jeden Zeitraum oder Balken, der durch den Cursor im aktuellen Zeitrahmen des Diagramms mit Fortschrittsbalken indiziert ist. Darüber hinaus markiert es einen Pfeil auf dem Balken/Zeitraum, in dem die betreffende Währung die höchste oder niedrigste Veränderungsrate gegenüber dem USD im Vergleich zu anderen Währungen erlebt hat, wodu

"Sentiments of traders" in the financial markets is a topic that has been of interest to us for a long time. In time, we could not find the right formula to define these sentiments. We went through many stages in the search for the right methodology - from taking data from external sources to calculate open positions of buyers and sellers to calculating tick volumes, but still we were not satisfied with the results. The calculation of open positions of buyers and sellers from external sources ha
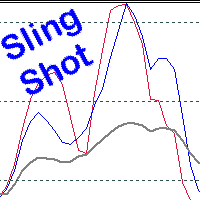
Scalping, Mean reversion or Position trading strategy
Get into an established trend on a pullback in the market. Use the Pinch in the indicator for profit taking. Use the Pinch as a mean reversion strategy, scalping back to a moving average line.
Input Parameters Fast Sling Shot configuration. Slow Sling Shot configuration. Dual Sling Shot configuration. Price line configuration. Trigger zones or levels. Example of Sling Shot trade idea: Price line sets the mood, below the baseline level (50)

The ICT Concepts indicator regroups core concepts highlighted by trader and educator "The Inner Circle Trader" (ICT) into an all-in-one toolkit. Features include Market Structure (MSS & BOS), Order Blocks, Imbalances, Buyside/Sellside Liquidity, Displacements, ICT Killzones, and New Week/Day Opening Gaps. It’s one kind of Smart money concepts. USAGE: Please read this document ! DETAILS Market Structure Market structure labels are constructed from price breaking a prior extreme point. T

The Breakout Line in technical analysis serves as a crucial tool for understanding market dynamics and potential shifts in price direction. It's designed to highlight rapid accelerations or declines in the market's trajectory. Unconventional Analysis : The Breakout Line is not your typical technical indicator; it's tailored to capture swift market movements, offering a unique perspective on price trends. Angle of the Breakout Line : The sharper the angle formed by the Breakout Line, the stronger
Einführung von BreakOut Consult, dem revolutionären Werkzeug, das Ihr Trading auf die nächste Stufe bringt! Unser hochmoderner Algorithmus kombiniert mehrere Trends und Oszillatoren, um genaue Kauf- und Verkaufssignale zu generieren, was es zu einem leistungsstarken Werkzeug für jeden Trader macht. Mit BreakOut Consult können Sie mit Hilfe unseres dynamischen Kanals, der Widerstands- und Unterstützungsniveaus verwendet, um Durchbrüche zu erkennen, leicht Ausbrüche auf dem Markt identifizieren.
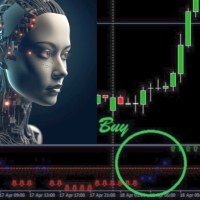
Introducing Trend Fusion 444F, a powerful MQL4 indicator designed to determine market direction using multiple trading indicators. This comprehensive tool offers a unique fusion of technical analysis techniques that help traders make informed decisions in various market conditions. Key Features: Comprehensive Analysis: Trend Fusion 444F combines several widely-used trading indicators to provide a multi-dimensional view of the market. The indicators include Moving Averages, MACD, RSI, DeMarker,

INTRODUCTION The Fib Autotrendline is a basic tool that analysts use to find out when a security's trend is reversing. By determining the support and resistance areas , it helps to identify significant changes in price while filtering out short-term fluctuations, thus eliminating the noise of everyday market conditions. It is an excellent tool for any trader who follows indicators that use swing highs and swing lows . How to Use the fib Auto Trendline Indicator The Fib Auto Trendline

Supply and Demand Indicator + FREE Currency Strength Meter ADD-ON Looking for a powerful tool that can help you identify the most reactive zones in the forex market? Our supply and demand indicator for MetaTrader 4 and 5 is exactly what you need. With its advanced algorithms and real-time analysis, this indicator helps traders of all experience levels make informed trading decisions. The supply and demand indicator is a cutting-edge tool that helps traders identify areas where buyers and sellers
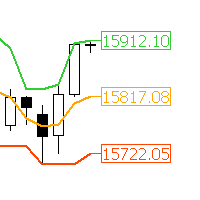
"AV Donchian Channel MT5" ist ein Indikator für den MetaTrader 5, welcher die aktuellen Preise des Donchian Channels und der Mittellinie anzeigt.
Es können mehrere AV Donchian Channel Indikatoren in einen Chart gelegt werden. Die Mittellinie kann zum trailen benutzt werden.
Siehe auch Turtle Trader Strategie von Richard Dennis.
Einstellungen:
- Donchian Channel Periode
- Farben und Stärken der Linien
- Farben und Stärken der Preismarken
Bitte berichtet mir Fehler.

Considering the main theories of Forex (Dow Theory, support lines, chart patterns, and Fibonacci retracements), It tells you the price range where whales (large investors) are likely to appear. You can trade at the price points that professionals also aim for. You no longer have to warry about where to aim next.
We are live-streaming the actual operation of the system. Please check for yourself if it is usable. Please check it out for yourself. https://www.youtube.com/@ganesha_forex
We do not

A pivot point is an intraday technical indicator used to identify trends and reversals mainly in equities, commodities, and forex markets . Pivot points are calculated to determine levels in which the sentiment of the market could change from bullish to bearish, and vice-versa.
the swing daily is an advanced pivot points indicator that grants the user control over many aspects of the trading levels that you'll get familiar with in the controls section it's used mainly to locate intraday tr

This indicator uses candle stick patterns and moving averages to determine trend , the candle sticks patterns it uses are harami Bull harami Bear Bullish Engulf Bearish Engulf this can both be used to catch trends and also for sculping it has 2 take profits and 2 stop losses which can be turned off if they are not ideal for you. the reward parameter is used to scale the take profit lines , if reward is 2 then the take profit will be 2 times the stoploss the are mobile alerts and terminal alerts

The best instrument for scalping. It allows you to always be correctly positioned in the price. It's a simple and extraordinarily powerful visual reference. Very suitable for price action. It consists of four components. 1. Fork. There are two levels that surround the price and mark the rebound points. They can be varied independently with 4 associated controls, two for each level. Its amplitude is indicated in pips in the indicator data. The minimum fork is updated with each tick. It has
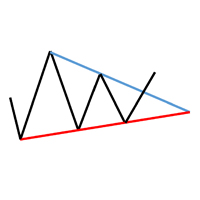
Der TrianglesPro Indikator für den MetaTrader5 zeichnet, basierend auf den lokalen Hochs und Tiefs Dreieicke in den Chart ein. Die Länge der Trendlinien ist begrenzbar. Optional kann man sich die Hochs und Tiefs, die zur Bestimmung der Dreieicke herangezogen werden, anzeigen lassen. Es lässt sich ebenfalls bestimmen, wie weit zurück mit der identifizierung von Dreiecken begonnen werden soll.
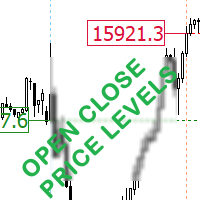
This indicator displays the open and closing price for the selected number of days. Easily identify market open and close Gaps. Select the Day icon to show the open and closing price line. Select the Time icon to show the open and closing hours. Indices and stocks are not a 24hour market as shown on MT5 charts, they open and close at specific times. Marketplace
Time Zone
Trading Hours
New York Stock Exchange (NYSE)
EDT
9:30 a.m. to 4:00 p.m.
Nasdaq Stock Market
EDT
9:30 a.m. to 4:00 p.m.

The fate of a trade depends on knowing the direction of the price trend. Whatever style you trade, you must know that the direction of the main market trend is in the hands of buyers or sell
YZD Trend indicator helps you to find the main direction by using mathematical parameters and ATR This indicator is a good supplement for your strategy, especially price action, which can reduce your trade losses.
How to use: YZD Trend indicator consists of two ranges in the form of bands, when the p

Indicator introduction: A channel and trend line indicator, which is a good tool for manual trading, and also can be used for creating new EAs, without drifting or repainting. It applies to any timeframes and any symbols. The work of the indicator is shown in the screenshots. For any novice and programming trading friend, you can write the signal into the EA to play freely, buffer 0 corresponds to the bold trend line, buffer 4 and 5 respectively corresponds to the channel's upper and lower f
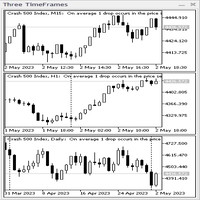
Anzeigefeld mit drei Zeitrahmen. Der Indikator wird in Form eines Panels basierend auf der Klasse CAppDialog erstellt. Das Panel kann minimiert oder mit der Maus im aktuellen Diagramm verschoben werden. Der Indikator zeigt drei Zeitrahmen des aktuellen Symbols im Panel. In der aktuellen Version verfügt der Indikator über eine Mindestanzahl an Einstellungen – dies sind die Parameter von drei Zeitrahmen: „Jüngerer Zeitrahmen“, „ Mittlerer Zeitrahmen “ und „ Älterer Zeitrahmen “. Beim S

Der Indikator berechnet fraktale Linien, die technisch gesehen psychologische Unterstützungs-/Widerstandslinien sind. Es handelt sich dabei um die Höchst- und Tiefststände des Preises über einen bestimmten Zeitraum. Der Indikator funktioniert auf allen Charts und Zeitrahmen. Einstellungen: Fractal Candels - die Anzahl der Candlesticks, auf deren Basis ein Fraktal gebildet wird. Berechnet das Maximum/Minimum, bei dem der psychologische Preis berechnet werden kann Rigth Candels - die Anzahl der Ke

Suchen Sie nach einem leistungsstarken Indikator, um Ihr Trading auf die nächste Stufe zu heben? Suchen Sie nicht weiter als nach unserem einzigartigen RSI-basierten Indikator, der das Beste aus dem Relative Strength Index (RSI), dem gleitenden Durchschnitt und den Heiken-Ashi-Indikatoren in MQL5 kombiniert.
Unser Indikator bietet Echtzeitdaten ohne Verzögerung, sodass Sie mit Zuversicht fundierte Handelsentscheidungen treffen können. Es ist perfekt für Händler aller Niveaus, vom Anfänger bis

Nadaraya-Watson Envelope Indicator convert to MT5 Nadaraya Watson Envelope Indicator is one of the monst popular indicator in TradingView. TradingView(Chrome, Edge) eats a huge of CPU, so I convert this to MT5 version.
As you can see the screenshot, it's good with Schaff trend RSI Indicator (or others) If you want to get Schaff trend RSI Indicator , Link: https://www.mql5.com/en/market/product/98011
Window Size - determines the window size for calculating smoothed values. A larger window siz

There are many linear regression indicators out there, most of them draw lines or channels, but this one actually draws a chart. The beauty of the indicator like Heiken Ashi is it removes a lot of market noise. 4 (OHLC) arrays are filled with Linear Regression(LR) values of each price for the LR period (default=14). The period of the Linear Regression is adjustable dependant on the market conditions. The SMA (default=14) also has period adjustment. Candles are generated with Green for 'Up' cand
Schaff trend RSI indicator (It is related with EMA and RSI) It is suited for sub-Indicator to undertand trend(or direction change)
As you can see the screenshot, it's good with Nagaraya-Watson Envelope Indicator (or others) I am using this indicator as Screenshot setting. (Schaff value is default value. 23, 50, 9, close) If you want to get Nagaraya-Watson Envelope, Link: https://www.mql5.com/ko/market/product/97965

The Super Trend is one of the best trend-following indicator for MT5 platforms. It's working fine for real-time trend alerts and accurate signals and it help to identify the best market entry and exit positions. This indicator is the tool you can refers to a trend following overlays. It contains two major parameters: the period and the multiplier. Besides, traders should consider default values that include 10 for every true range aтd 3 for the multiplier. 2 Types TP SL you set in input Point

The Off Trend MT5 Forex Indicator is a trend-following tool. Its signals are presented in the cloud. When the cloud is green, the trend momentum is bullish, and traders should take buy opportunities. Conversely, the trend momentum is bearish when the cloud is pink, and traders should take sell opportunities. The Off Trend mt5 Forex Indicator fits all timeframes and mt4 currency pairs.
Introducing our groundbreaking Forex indicator, specifically designed to help traders master the art of identifying critical support and resistance zones, as well as double top and double bottom patterns with unprecedented accuracy. Say goodbye to guesswork and hello to a powerful tool that will revolutionize your trading experience. Our proprietary indicator leverages cutting-edge technology to recognize key price levels where buying and selling pressures are poised to shift the market dynamics

Highly advanced Non-repaint MT5 Trading indicator. Arrow appears on current candle stick arrow will not disappear, The indicator works in All timeframes M1 - Monthly timeframe. Pairs to trade: US30, SPX500, NASDAQ100, GOLD BLUE ARROW- BUY SIGNAL PINK ARROW- SELL SIGNAL Note the indicator will show multiple blue arrows showing a strong uptrend. Same goes as Multiple pink arrows showing a strong downtrend Entry is on arrow direction and exit on opposite signal.
Please contact me after purchase.

Detector Fix indicator.
Currency pairs never rise or fall in a straight line. Their ups and downs are interspersed with rollbacks and reversals. Every rise and fall is reflected in your emotional state: hope is replaced by fear, and when it passes, hope appears again. The market uses your fear to prevent you from taking advantage of a strong position. At such moments you are most vulnerable.
Everything will change if you use the Detector Fix indicator.
The Detector indicator was created to n

--- StudentK RVI --- 1. Advanced strategy based on RVI 2. EA adapted (especially for StudentK's EA)
--- Context --- StudentK is not indicated as a master or K Sir for knowledgeable person who claims for winning all the time. (But lots of traders should know the fact that it is rarely truth, especially in fluctuated period of time)
StudentK is a group of years-experienced traders who want to share amazing tools in Free and Paid versions. Aiming helping people getting out of "The Rat Race" by u
--- StudentK CCI --- 1. Advanced strategy based on CCI 2. EA adapted (especially for StudentK's EA)
--- Context --- StudentK is not indicated as a master or K Sir for knowledgeable person who claims for winning all the time. (But lots of traders should know the fact that it is rarely truth, especially in fluctuated period of time)
StudentK is a group of years-experienced traders who want to share amazing tools in Free and Paid versions. Aiming helping people getting out of "The Rat Race" by u

--- StudentK MACD --- 1. Advanced strategy based on MACD 2. EA adapted (especially for StudentK's EA)
--- Context --- StudentK is not indicated as a master or K Sir for knowledgeable person who claims for winning all the time. (But lots of traders should know the fact that it is rarely truth, especially in fluctuated period of time)
StudentK is a group of years-experienced traders who want to share amazing tools in Free and Paid versions. Aiming helping people getting out of "The Rat Race" b

The main purpose of this indicator is to determine the moments of entries and exits from transactions, so the Trend Factorial indicator displays only the trend line and entry points, i.e. it displays market entry points.
Despite the apparent simplicity of the indicator, it has complex analytical algorithms inside, with the help of which the system determines the moments of entries.
The indicator gives accurate and timely signals to enter and exit a trade that appear on the current candle.
Us
Based on data from the Bank for International Settlements, 78.8% of the world's major 8 currency pairs can be checked instantly. It tells you whether the U.S. dollar is being bought or sold in a matter of seconds. So, even in the fast-moving phase after the release of economic indicators, you can see the flow and pushes of the U.S. dollar,
We are live-streaming the actual operation of the system. Please check for yourself if it is usable. Please check it out for yourself. https://www.youtube.c
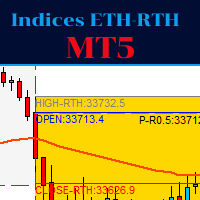
This indicator is for trading indices.
The RTH sessions (regular trading hours) where the underlying cash market is open are distinguished from ETH: for example for the American indices from 9:30 to 16:15 East Coast (New York) time, while for the Dax from 09:00 to 17:35 CET.
For the ETH session (outside RTH) the Fibonacci levels are plotted, as well as sensitive levels such as 25,50,75% retracement from the minimums and maximums.
Also for the RTH session the Fibonacci levels are graphed, as
JPYTraderSR ist ein einfacher Unterstützungs- und Widerstandsindikator speziell für den JPYTrader Expert Advisor . Es bietet zusätzliche Bestätigungen für den Fachberater, indem es Unterstützungs- und Widerstandsniveaus anzeigt, die die Marktstruktur zu einem bestimmten Zeitpunkt prägen. Für diesen Indikator sind keine Einstellungen vorgesehen, da sein einziger Zweck darin besteht, mehrere Zusammenflusskriterien für JPYTrader bereitzustellen.

Market Viewer gives a quick glance on correlation and direction. This indicator takes a list of symbols (max 8) Leave a symbol setting empty if you wish not to use that many - like in the defaults… It will check for each timeframe (Monthly, Weekly, Daily, H4, H1, 30min, 15min, 5min and 1min) if the current candle on that timeframe is bullish or bearish. This will give a good indication of the direction for us to trade in. We need to be in sync with the bigger timeframes.

Max Min Reversal Arrows MT5 - an arrow reversal indicator for predicting price movement. The indicator is built on the support and resistance levels at the local lows and highs of the price. Product features
Arrows appear on the current candle. The indicator does not redraw.
Can be used on all time frames and trading instruments. Recommended timeframes to use M30, H1, H4.
The dotted lines are the support and resistance levels within the signal. Price movement from these levels means a reversa

Introducing the POWER TRADE indicator created by a small group of traders with a few years trading trading the financial market profitably . This is a plug and play indicator that provides you with POWERFUL Entry signals with Profit Taking and rebound zones. The indicator Works with all MT5 trading instruments. The indicator uses previous chart data as receipt to speculate on future market moves.

Achtung! Bevor Sie unser Produkt verwenden, lesen Sie bitte sorgfältig den Haftungsausschluss auf Englisch durch. Unser Produkt ist dafür konzipiert, Informationen über mögliche Markttrends und Preisbewegungen bereitzustellen. Es kann jedoch keine Garantie für Gewinne oder bestimmte Handelsergebnisse gegeben werden. Der Handel an den Finanzmärkten birgt Risiken und wir übernehmen keine Verantwortung für mögliche Verluste. Weitere Informationen finden Sie im englischen Haftungsausschluss.
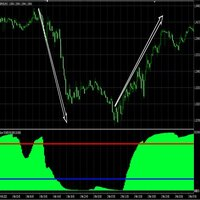
Absolute High Low indicator is a discretionary tool for assessing extremes in the price. It is very self-explanatory, and you can test against other default oscillators to see the difference. Combine with your trend following systems to master entry and exit at extremes. Back test and study the indicator to see the results up against a system or indicator. The indicator calculates a number of max bars so a gap will appear at the end, and it will restart. MT4 Version: https://www.mql5.com/e

The Visual Volatility Clustering indicator clusters the market based on volatility. The indicator does not redraw and gives accurate data, does not use closing prices. Uses the opening prices or the highs or lows of the previous completed bar. Therefore, all information will be clear and unambiguous. The essence of the indicator is to divide the price market into certain areas according to a similar type of volatility. This can be done in any way. In this example, the indicator is configure

The Visual Volatility Clustering indicator clusters the market based on volatility. The indicator does not redraw and gives accurate data, does not use closing prices. Uses the opening prices or the highs or lows of the previous completed bar. Therefore, all information will be clear and unambiguous. The essence of the indicator is to divide the price market into certain areas according to a similar type of volatility. This can be done in any way. In this example, the indicator is configure

This is an Immediate Reversal Indicator, a powerful tool designed to help traders and investors to identify trend reversal points in the financial market quickly and efficiently.
Indicator Description: Our immediate reversal indicator is an arrow based on a combination of technical analysis and advanced algorithms, which aims to identify the moments when a market trend is about to reverse, can be used in all TimeFrames, can configure to send an alert when the signal appears. It is designed to

Pinbar Outside Pattern indicator shows in a table symbol, time frame and direction of the last price candle if it matches outside pinbar input parameters. Outside pinbar means that the candle is extreme in the chosen time frame. By clicking ' Open chart ' button you can view drawn pattern. You can choose to scan through all the symbols in Market Watch or enter your favorite symbols, and also you can enter time frames you need to scan. ---------Main settings-------- Select all symbols from Market

It is one of the famous indicator in TradingView platform. Supertrend indicator shows the trend of the market intuitively . You can use it for understanding the trend or get insight about the market.
------- Value & Color -------- You can change the colour (line, filled). Default value is the same as Tradingview Supertrend default value ( period 10, ATR multiplier 3.0)
Willkommen beim Provlepsis-Indikator.
"Provlepsis" ist ein hochentwickelter Indikator, der für den MQL-Markt entwickelt wurde. Durch die Analyse früherer Balken zur gleichen Tageszeit berechnet er präzise das potenzielle Kursbewegungsintervall und liefert wertvolle Einblicke in zukünftige Preisfluktuationen. Im Gegensatz zum traditionellen ATR-Indikator berücksichtigt "Provlepsis" den Zeitfaktor und ist damit ein leistungsstarkes Werkzeug, das sich an unterschiedliche Marktbedingungen anpasst. W

Pack Volatility 75 1/3 In this indicator stage 1 I am pleased to present you the volatility 75 Buy/Sell Professional indicator. where in each temporary structure it will mark a sale and a safe purchase to operate manually, where the strategy is based on the lines EMA of 7 exponential periods and the EMA of 50 exponential periods. where purchasing a product comes 2 as a gift (it's the pack) purchasing any of the 3 products will be sent the remaining indicators, to be able to apply the strategy we

The Your Trend indicator not only signals an immediate buy or sell. It indicates a short-term and long-term trend. operations. The simplest way to use the indicator is to open a trade in the direction of an existing trend. The indicator allows you to study the real and historical market trends in more detail! Shows the opening points of transactions for sale or purchase, and also indicates the direction of the trend on: short-term and long-term periods. The analysis is based on the selected tim
On this occasion I am pleased to present the (Boom 300 Professional Pack) where it consists of 4 indicators for the Boom 300 index of synthetic indices (Deriv Broker) Acquiring this indicator enables you the pack of the 4 boom 300 indicators where the rest of the indicators will be sent, This indicator is 1 of the 4 that includes the Buy/Sell strategy, sending you clear alerts where there buy or sell the pair It is recommended to use in a period of 15 minutes, to have a greater profit since the
Professional Pack Crash 300 Indicators, On this occasion I present the trend indicator that is for the crash index 300 (Deriv Broker) The indicator consists of a strategy where trends are caught in periods of 15 minutes, very clearly the indicator shows the purchase marking the tip of red until the trend develops, and then mark the green point of purchase, it is very simple to use, It is recommended to use in that temporality since it serves to catch longer trends and increase profit, the indica
Channel Stochastic Boom 1000 I am pleased to present the pack (Tendence Boom 1000) where on this occasion I present the Channel Stochastic Boom 1000 indicator for (Deriv Broker) where is 1 of the 4 indicators that the pack brings! The indicator consists of the sthochastic strategy, where it reaches the point of (0 Level) the purchase is made, taking advantage of hunting spike, where it reaches the point of (90 Level) the sale is made taking advantage of the trend candles! It is used in 1 minute
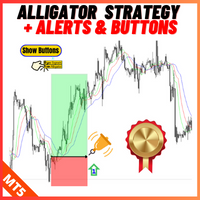
Description: For a comprehensive understanding of our indicators, we invite you to explore the entire Q&A section within this MQL5 blog post here . The Alligator Cross Strategy with Alert and Button is an effective technical analysis tool designed to assist traders in identifying potential entry and exit points with enhanced trading. Based on the popular Alligator Indicator, this tool brings an added layer of convenience with real-time alerts and trading buttons for seamless execution. Key F
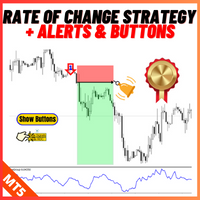
Description: For a comprehensive understanding of our indicators, we invite you to explore the entire Q&A section within this MQL5 blog post here . The Rate Of Change Cross Strategy with Alert Indicator is a valuable tool for traders seeking to identify potential trend reversals and capitalize on market opportunities. Based on the Rate of Change (ROC) indicator, this tool provides clear and timely buy or sell signals, helping traders make informed decisions in their trading endeavors. Key Fe
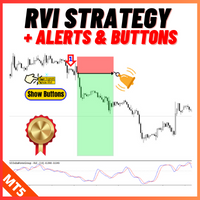
Description: For a comprehensive understanding of our indicators, we invite you to explore the entire Q&A section within this MQL5 blog post here . The RVI Cross Strategy with Alert and Button Indicator is a powerful technical analysis tool designed to help traders identify potential trend changes and seize opportunities in the financial markets. Utilizing the Relative Vigor Index (RVI) indicator, this tool offers precise and timely buy/sell signals, enabling traders to make well-informed tradi
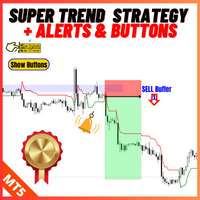
Description: For a comprehensive understanding of our indicators, we invite you to explore the entire Q&A section within this MQL5 blog post here . The Super Trend Line Strategy with Alert Indicator is a versatile technical analysis tool designed to help traders with valuable insights into market trends and potential entry and exit points. By effectively capturing trend movements, this indicator helps traders make informed trading decisions across various financial markets. Key Features: - S

The Fisher Transform is a technical indicator created by John F. Ehlers that converts prices into a Gaussian normal distribution. The indicator highlights when prices have moved to an extreme, based on recent prices. This may help in spotting turning points in the price of an asset. It also helps show the trend and isolate the price waves within a trend. The Fisher Transform is a technical indicator that normalizes asset prices, thus making turning points in price clearer. Takeaways Turning poi

"Advanced Daily VWAP with Standard Deviation and Trading Bands" Description: "The 'Advanced Daily VWAP with Standard Deviation and Trading Bands' indicator offers a comprehensive view for traders who wish to make the Volume Weighted Average Price (VWAP) the crux of their trading strategy. It not only calculates the VWAP on a daily basis but also incorporates standard deviation to give an accurate representation of market volatility. The trading bands are calculated using a 1.5% multiplier for th

Description: The CCI Arrow Indicator is a powerful trading tool designed to offer clear buy and sell signals based on the Commodity Channel Index (CCI). Buffer 0 signifies the buy signal, while Buffer 1 represents the sell signal, providing a straightforward visual representation of market conditions. Users can easily install and apply the indicator to their MetaTrader platform, where arrows indicate potential entry and exit points, aiding in informed trading decisions. A green arrow (Buffer 0)

Probability-Based Indicator This indicator analyses price movements of a given period to obtain crucial information for probability distribution analysis such as their mean and standard deviation, Once it has such piece of information it does all the necessary calculations and finally calculates the probability that the current market value will go above or below the given period bars. Since this indicator effectively leverages the power of probability which doesn't lie, It is a powerful indicat
Der Palantir-Indikator sagt eine Preisumkehr um die vom Benutzer in den Einstellungen angegebene Anzahl von Punkten voraus. Sie wählen die Größe des Trends aus, an dem Sie interessiert sind, und der Indikator sagt voraus, mit welcher Wahrscheinlichkeit sich der Preis um die angegebene Anzahl von Punkten vom nächstgelegenen Extrem in die entgegengesetzte Richtung bewegen wird.
Die Funktionsweise des Indikators basiert auf der statistischen Berechnung historischer Trends. Palantir analysiert his

The ChanLun or Chan theory is one of the most popular trading theories in China. But it seems like that it has little influence in western countries. Actually, the Chan Theory is based on a sophisticated mathematical model. The basic idea ChanLun is to simplify the bar chart by its model. With the help of ChanLun, a trader can analyze and predict the trend of future goods, stocks.
In ChanLun, there are several basic elements called fractals, strokes, line segments and pivots . A trader should pa

King of Dragon-Kanal, King of Dragon-Indikator, King of Dragon-System, King of Dragon MT5, King of Dragon-Klassiker-Indikator, King of Dragon-Wischsystem, König der Drachen in einem
Das Channel-Handelssystem King of Dragon, ein klassisches Channel-Trading-System, wird von vielen Benutzern dringend nach der MT5-Version verlangt. Dieses Programm wurde in mehreren Versionen auf Leistung optimiert und ist bereits ein relativ reibungsloses System. 49$ → 59$ Roter Bereich, langer Trend, nur lang, ni

*This is trading view indicator converted in mql5*
The HA Market Bias Indicator is a popular tool used in trading and technical analysis, designed to help traders identify market bias and potential trend reversals. It is commonly used in conjunction with candlestick charts and provides valuable insights into market sentiment. The indicator is based on the Heiken Ashi (HA) candlestick charting technique, which aims to filter out market noise and provide a smoother representation of price action.

The Breaker Blocks with Signals indicator aims to highlight a complete methodology based on breaker blocks. Breakout signals between the price and breaker blocks are highlighted and premium/discount swing levels are included to provide potential take profit/stop loss levels.
This script also includes alerts for each signal highlighted.
SETTINGS
Breaker Blocks
Length: Sensitivity of the detected swings used to construct breaker blocks. Higher values will return longer term break
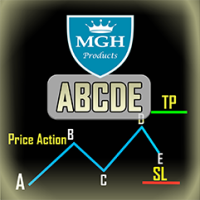
ABCDE-Indikator
Dieser Indikator basiert auf den primären abc-Mustern der Preisaktion (d.h. Ausbruch, Rückzug, Bewegung). Diese Muster ähneln dem Rallye-Basis-Rallye-Muster, und eine Reihe von Analysen wie Trendanalyse und Divergenzanalyse werden überprüft, um das genaue Signal auszugeben. Er bietet ziemlich genaue Handelssignale und sagt Ihnen, wann es am besten ist, einen Trade zu eröffnen und zu schließen. Er kann auf jedem Finanzinstrument angewendet werden: Devisen, Kryptowährungen, Metall

Besondere Kerze
Möchten Sie einen der besten Forex-Indikatoren mit einer erfolgreichen Ichimoku-Strategie verwenden? Sie können diesen großartigen Indikator verwenden, der auf der Ichimoku-Strategie basiert. Die MT4-Version finden Sie hier.
Erste Strategie:
Diese Strategie beinhaltet das Identifizieren ähnlich starker Kreuzungen, die selten vorkommen. Die besten Zeiträume für diese Strategie sind 30 Minuten (30M) und 1 Stunde (H1). Geeignete Symbole für den 30-Minuten-Zeitraum sind:
• CAD/JPY
•

-- BEST SWING --
L'indicateur BEST SWING est un indicateur technique personnalisé, un excellent outil pour négocier les cassures en fonction des niveaux de support et de résistance horizontaux. L'indicateur BEST SWING utilise une formule complexe en analysant des données de prix autrement incongrues sur les cours de clôture de chaque période, ainsi que les hauts et les bas du prix, afin de donner un aperçu de la force ou de la faiblesse de la tendance du marché et de sa probabilité

Der Indikator Trading Hours zeichnet die Rahmen, die die Öffnungs- und Schlusszeiten einer konkreten Börse in einem Diagramm darstellen. Eingaben: Der Eingabeparameter „UTC-Zeitzonenverschiebung“ legt die Zeitzonenverschiebung des Benutzers gegenüber der UTC fest. Die anderen Parameter werden zum Ein- oder Ausblenden der Rahmen oder zum Einstellen der Farbe verwendet. Merkmale: Zeichnet die Rahmen, die die Öffnungs- und Schlusszeiten konkreter Börsen in einem Diagramm darstellen, Zeigt/versteck

A visual Order Book is a powerful tool used in the financial market to provide a detailed view of buy and sell orders in a given financial instrument in real time.
This visual representation allows traders to observe the liquidity available in the market, identify the supply and demand levels at different prices and follow the evolution of orders as they are placed, modified or withdrawn.
By analyzing the visual Order Book, traders can identify trading patterns, detect possible reversal point
MetaTrader Market - Handelsroboter und technische Indikatoren stehen Ihnen direkt im Kundenterminal zur Verfügung.
Das MQL5.community Zahlungssystem wurde für die Services der MetaTrader Plattform entwickelt und steht allen registrierten Nutzern der MQL5.com Webseite zur Verfügung. Man kann Geldmittel durch WebMoney, PayPal und Bankkarten einzahlen und sich auszahlen lassen.
Sie verpassen Handelsmöglichkeiten:
- Freie Handelsapplikationen
- Über 8.000 Signale zum Kopieren
- Wirtschaftsnachrichten für die Lage an den Finanzmärkte
Registrierung
Einloggen
Wenn Sie kein Benutzerkonto haben, registrieren Sie sich
Erlauben Sie die Verwendung von Cookies, um sich auf der Website MQL5.com anzumelden.
Bitte aktivieren Sie die notwendige Einstellung in Ihrem Browser, da Sie sich sonst nicht einloggen können.