Technische Indikatoren für den MetaTrader 5 - 80

The Lumina Parallax indicator is developed on the basis of original indicators for searching for extremes and is excellent for identifying reversals or sharp price movements in one direction. With the help of this indicator, you will be able to know about such changes in advance, since it will notify you by the appearance of a blue dot for buying and a red dot for selling. At its core, the indicator uses the process of identifying the rate of change in price growth, which allows you to find the

Swing Sentry is an advanced technical indicator specifically created for Forex traders. It works based on a unique algorithm that allows you to predict future prices by analyzing historical data for a user-specified period.
The indicator provides traders with valuable information about possible changes in the direction of price movement. The special formula behind Swing Sentry accurately calculates signals, effectively identifying moments of reversal or sharp price movements in one directio

The Rising indicator is a full -fledged trading system processing data from several technical tools. The appearance of its signals is the result of complex calculations. The indicator independently evaluates the power of market signals and indicates the direction of the direction, notifying the trader about this, who then makes a trade decision. This indicator operates on all timframes. It is important to understand that any indicator is just a visual signal representation. Currency pairs never

Visual Heatmap Book Analyser
This indicator monitors the market liquidity and generates colors based on order patterns, quantities, and renewal activities in the book. This allows you to visualize the order flow and identify areas of high and low liquidity and activity. The indicator uses machine learning techniques to analyze the order behavior in the book, enabling it to detect patterns and trends in orders, allowing you to make informed decisions about your trading operations. The color pal

Introduction The “RSI Continuous Detection” is an innovative trading indicator developed by TvT Trading. It integrates the principles of the Average Directional Index (ADX) and the Relative Strength Index (RSI) to analyze market trends and pinpoint potential profitable entry points for traders. Our observations indicate that during a trend, prices typically retract temporarily before continuing in the direction of the prevailing trend. This insight forms the basis of our “RSI Continuous Detectio
===> Was macht dieser Indikator? Wie viele meiner Codes handelt es sich um mehrere Zeitrahmen.
Es wird ein einzelner EVWMA-Durchschnitt mit der Wahl des Zeitrahmens dargestellt
Die Codes, um mehrere EVWMA in einem einzigen Skript mit icustom zu haben, stelle ich bei Bedarf auf Anfrage kostenlos zur Verfügung
EVWMA (Volume-Weighted Elastic Period Moving Average) ist ein technischer Indikator, der hilft, Markttrends zu erkennen, indem er die Periode des gleitenden Durchschnitts basierend au

Wir stellen den Indikator „TW Trend Sniper“ vor, einen leistungsstarken Indikator, der zum Erkennen der wichtigsten Trends verwendet wird. Dazu nutzt er die exklusive Indikatorformel von „Trade Wizards“ zusammen mit Preisbewegungen, der Erkennung von Währungshandelssitzungen, Fibonacci- und Erkennungsfunktionen und Methoden zur Rauschentfernung durch künstliche Intelligenz mit hoher Genauigkeit. Diese von der „Trade Wizards Group“ entwickelte Strategie, die aus erfahrenen Händlern u

I suggest trying trading using the Bph indicator to everyone who is interested.
Bph is a technical analysis tool that uses mathematical calculations to determine various aspects of price movements based on historical data. The indicator works on the principle of cyclical wave dependence, which allows you to find optimal entry points where the direction of price movement changes. Bph identifies key aspects of price movement, helping traders make informed decisions. All trading indicators analy

TMA Channel is a price channel obtained through a special calculation method based on traditional TMA . The channel has upper, middle, and lower tracks . When the price approaches or exceeds the upper track, it is already in an overbought state, and attention should be paid to the situation of reversal and decline; When the price approaches or falls below the lower track, it is already in an oversold state, and attention should be paid to the situation of reversal and rise . The indicator will

Terra Infinity is a flat indicator.
This improved version of the CalcFlat indicator has three additional lines that significantly increase its effectiveness. Unlike its predecessor with two static levels, Terra Infinity adds three dynamic lines above the main histogram, which are interpreted as follows:
base signal line, minimum signal line, maximum signal line. These lines are formed using the additional parameter Avg, which is the average value of the histogram. Averaging produces a line
This is a multi time frame Support and resistance indicator which works on all forex pairs and commodities. Users can also see the historical support and resistance levels which got taken out . For Major Forex pairs like EURUSD, GBPUSD, USDCAD , USDCHF, NZDUSD, AUDUSD, EURCHF enable the s&r levels from 5 minutes from the settings. (Lower timeframe snr levels may act as as noise for major currency pairs.) For Gold and Silver enable all timeframe s&r levels.
Results may vary from broker to br
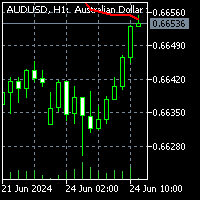
To download MT4 version please click here .
- This is the exact conversion from TradingView: "Chandelier Exit" By "everget". - This is a non-repaint and light processing load indicator - input options related to coloring and labels are removed to fit into MetaTrader graphics. - Buffers are available for processing within EAs. - You can message in private chat for further changes you need.

Indicator Description This indicator displays the highest and lowest prices for the previous day, week, and month. Additionally, it shows pivot levels calculated using different methods: Standard, Fibonacci, Woodie, Camarilla, and Floor pivots. Features: Previous Day High/Low: Indicates the highest and lowest prices of the previous trading day. Previous Week High/Low: Indicates the highest and lowest prices of the previous trading week. Previous Month High/Low: Indicates the highest and lowest p

Jabidabi Session Indicator The Market Session Indicator is a powerful tool used by traders to identify and track different trading sessions within the forex and stock markets. It visually highlights key trading periods, such as the Asian, European, and North American sessions, directly on the trading chart. This indicator is especially useful for traders who follow ICT (Inner Circle Trader) strategies, which emphasize the significance of various market sessions for optimal trading opportunities.
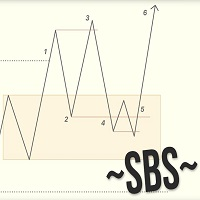
Swing Breakout Sequence | SBS presents a comprehensive trading strategy designed to help traders identify and capitalize on market swings and breakouts. The Swing Breakout Sequence (SBS) strategy is built around a series of well-defined steps to optimize trading decisions and improve profitability. Key Components of the SBS Strategy: Breakout Identification : The initial step involves identifying potential breakouts in the market. This is a crucial phase where traders look for key levels where t
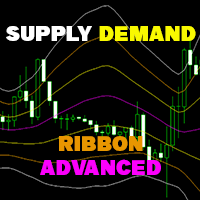
Supply Demand Ribbon is an indicator with moving supply and demand lines that help you identify price zones more easily.
The indicator helps you determine flexible entry, stop loss, and take profit areas.
There are also strategies for algorithmically changing ribbon colors.
From there you can come up with many trading strategies for yourself! You can try the Basic version here ! MT4 version: Click here!
Feature in Advanced version: Hide/Show 2 Supply/Demand Over lines. Hide/Show

We mark the fair value gap (FVG) and wait for the price to reach that zone, but sometimes it reverses before getting there. This can happen because we didn't notice the Balanced Price Range (BPR). My tools will enhance your analysis by displaying everything on the chart, helping you identify potential price reversal areas so you can make informed decisions about when to enter the market. MT4 - https://www.mql5.com/en/market/product/119216 So, what is BPR or Balanced Price Range? A Balanced Pri

Our new indicator is an important part of the Smart Money Concepts (SMC) system
It uses a modern market vision and fast calculation methods. As a result, the trader has a complete picture of the trade at every moment in time, which makes the process of obtaining results easier and faster.
Our new indicator displays the following important patterns:
Order Blocks. Imbalance – Fair Value Gap (FVG). Break Of Structures (BoS). Change of character (CHoCH). Equal highs & lows. Premium , Equili

Description of work
The 'MA7 Moss' indicator is based on the standard Accelerator Oscillator (AC) indicator. Shows overbought and oversold zones. Detailed information about the 'MA7 Moss' indicator.
Indicator settings
General settings: Upper level ; Lower level .
Message settings: Send message to the terminal (Alert) – permission to send messages to the terminal using the Alert function; Send message to the mobile terminal (Push) – permission to send messages to the mobile terminal using p
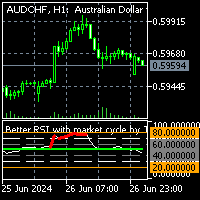
To get access to MT4 version please click here . This is the exact conversion from TradingView: " Better RSI with bullish / bearish market cycle indicator" by TradeCalmly.
This is a light-load processing and non-repaint indicator. All input options are available. Buffers are available for processing in EAs. You can message in private chat for further changes you need.

To get access to MT4 version please contact in private messages. This is the exact conversion from TradingView: " Impulse MACD" by LazyBear.
This is a light-load processing and non-repaint indicator. All input options are available except candle coloring option. Buffers are available for processing in EAs. You can message in private chat for further changes you need.
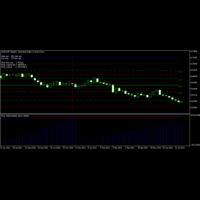
Float MetaTrader indicator — a sophisticated indicator that analyzes the previous chart history for the given currency pair and then tries to analyze the trends in the current situation. It shows where trends start and end in a separate chart window and Fibonacci retracement levels combined with DiNapoli levels on the main chart. It also displays how long ago the local high and low were detected. This indicator is available for MT4 and MT5. The indicator repaints its levels based on all

The Idie indicator not only shows the trend direction, but also the change in slope angle, which allows you to filter signals using angle filters. This makes it useful when creating a trading bot based on this signal indicator. Idie is very sensitive to current price activity and displays signals effectively.
The color version of the indicator signals a change in trend, allowing traders to see a rising or falling trend. The indicator quickly reacts to trend changes and clearly shows price mov

SpinSpike Detector is an amazing New Deriv MT5 indicator on the Market which detects Spikes and Crashes on Boom and Crash pair with more than 90% Accuracy . This indicator will give alerts before a spike or a crash so that you get ready to strike. The Indicator will only work for Boom and Crash pairs and will not work on any pair and it will give errors. This is a Non-Lag Indicator as witnessed by its stagnant arrows on chart which do not move. You can scalp all the day with this wonderful ind

Introducing a cutting-edge trading indicator, specifically designed to predict and signal upcoming spikes in Boom 1000 and Boom 500 markets. This innovative tool provides traders with timely alerts, enabling them to capitalize on market movements with precision. Key Features: Accurate Spike Prediction : The indicator utilizes advanced algorithms to identify potential spike occurrences in Boom 1000 and Boom 500 markets. User-Friendly Signals : The indicator generates clear buy signals, allowing t

Order Block indicator, highs and lows; the indicator focuses mainly on OBs, on the chart they are represented with a horizontal line on the minimum and maximum of that candle. While for the maximums and minimums only one line is marked (see the images to understand better). The indicator is for MT5, it works on all Timeframes, on any Forex Pair, on any index and on crypto markets. (For any information on the indicator do not hesitate to contact me).
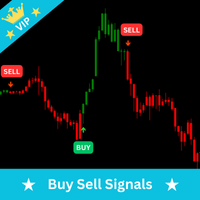
The "Buy Sell Signals" is designed to provide BUY and SELL trade signals based on the current market conditions. A Profitable Trading Strategy (Chee sheet) is provided for this trading indicator. (Read the description). This indicator has time tuned e ntry signals . so, you will enter the market at the very best price level with this indicator . NO MORE LATE ENTRIES.
Specifications Designed for Lower Time Frames (LTF) like 5 min. but you can trade Higher Time Frame

RSI OverZone: Enhancing Trading Accuracy RSI OverZone is a trading tool designed to optimize the use of the Relative Strength Index (RSI) by dynamically adjusting its values to identify overbought and oversold conditions. Here’s how it works: Higher Timeframe Analysis: RSI OverZone leverages higher timeframes to determine the current trend. By doing so, it aims to maximize profitability. We recommend using the H1 (1-hour) and D1 (daily) timeframes for trend analysis. Trend as Our Guide: Recogni
===> Was macht dieser Indikator? Wie viele meiner Codes handelt es sich um mehrere Zeitrahmen. Es wird ein einzelner TEMA-Durchschnitt mit der Wahl des Zeitrahmens dargestellt
Der TEMA (Triple Exponential Moving Average) ist ein leistungsstarker technischer Indikator, der Ihnen hilft:
Identifizieren Sie Markttrends genau Generieren Sie relevante Handelssignale Bestätigen Sie Ausbrüche wichtiger Ebenen
Vorteile von TEMA: Reduziert Preislärm Passt sich schnell an wechselnde Trends an Kann z

This is the test product. Please, DO NOT BUY IT! This is the test product. Please, DO NOT BUY IT! This is the test product. Please, DO NOT BUY IT! This is the test product. Please, DO NOT BUY IT! This is the test product. Please, DO NOT BUY IT! This is the test product. Please, DO NOT BUY IT! This is the test product. Please, DO NOT BUY IT! This is the test product. Please, DO NOT BUY IT!
MetaTrader Market - Handelsroboter und technische Indikatoren stehen Ihnen direkt im Kundenterminal zur Verfügung.
Das MQL5.community Zahlungssystem wurde für die Services der MetaTrader Plattform entwickelt und steht allen registrierten Nutzern der MQL5.com Webseite zur Verfügung. Man kann Geldmittel durch WebMoney, PayPal und Bankkarten einzahlen und sich auszahlen lassen.
Sie verpassen Handelsmöglichkeiten:
- Freie Handelsapplikationen
- Über 8.000 Signale zum Kopieren
- Wirtschaftsnachrichten für die Lage an den Finanzmärkte
Registrierung
Einloggen
Wenn Sie kein Benutzerkonto haben, registrieren Sie sich
Erlauben Sie die Verwendung von Cookies, um sich auf der Website MQL5.com anzumelden.
Bitte aktivieren Sie die notwendige Einstellung in Ihrem Browser, da Sie sich sonst nicht einloggen können.