YouTube'dan Mağaza ile ilgili eğitici videoları izleyin
Bir ticaret robotu veya gösterge nasıl satın alınır?
Uzman Danışmanınızı
sanal sunucuda çalıştırın
sanal sunucuda çalıştırın
Satın almadan önce göstergeyi/ticaret robotunu test edin
Mağazada kazanç sağlamak ister misiniz?
Satış için bir ürün nasıl sunulur?
MetaTrader 5 için teknik göstergeler - 80
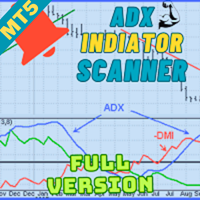
Welcome to advanced trading with the ADX Multicurrency Scanner for MT5! Elevate your trading experience with our powerful MT5 indicator, meticulously designed to offer seamless currency scanning and real-time insights. Key Features: Effortless Multicurrency Scanning: Unlock the full potential of the ADX Multicurrency Scanner for MT5 by effortlessly scanning multiple currencies. Receive instant alerts when specific conditions are met, ensuring you stay ahead of the market and capitalize on every

The DYJ StochasticSignalSource is displayed as two lines. The main line is called %K. The second line, called %D, is a Moving Average of %K. The %K line is usually displayed as a solid line and the %D line is usually displayed as a dotted line. There are several ways to interpret a Stochastic Oscillator. four popular methods include: Buy when the Oscillator (either %K or %D) falls below a specific level (for example, 20) . Sell when the Oscillator rises above a specific level (for example, 80)
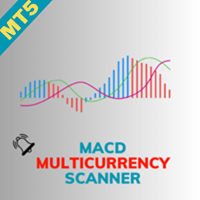
Welcome to the world of advanced trading with the MACD Multicurrency Scanner for MT5! Elevate your trading experience with our powerful MT5 indicator meticulously designed for seamless analysis and real-time insights. Key Features: Effortless MACD Scanning: Unlock the full potential of the MACD Multicurrency Scanner for MT5 by effortlessly scanning multiple currency pairs. Receive instant alerts when specific Moving Average Convergence Divergence (MACD) conditions are met, ensuring you stay ahea

This indicator obeys the popular maxim that: "THE TREND IS YOUR FRIEND" It paints a Blue line for BUY and also paints a RED line for SELL. (you can change the colors). It gives alarms and alerts of all kinds. IT DOES NOT REPAINT COLOR and can be used for all currency pairs and timeframes. Yes, as easy and simple as that. Even a newbie can use it to make great and reliable trades. https://www.mql5.com/en/market/product/115553

Welcome to the future of trading! Are you ready to elevate your trading game to new heights? Introducing a groundbreaking trading indicator that is set to redefine the way you approach the markets. With its unparalleled features and cutting-edge technology, this indicator is not just another tool in your arsenal – it's your secret weapon for success. Imagine having access to real-time alerts that keep you ahead of the curve, ensuring you never miss a lucrative opportunity. Picture a tool that

The technical indicator, TrendGenius , is based on the values of statistical trading indicators. It allows you to predict the future value of an asset. Calculations are carried out according to a certain algorithm based on data on quotes for a certain period. The tool was created to simplify technical analysis and is used on various markets and exchanges, including cryptocurrency ones.
A change in direction, from the point of view of market fundamentals, means a shift in trading interest to

SmartTrend Analyzer is a reliable non-repainting indicator that will interest any trader.
SmartTrend Analyzer is a tool that analyzes all five aspects (opening price, high, low, closing price, and volume) based on mathematical calculations. With the algorithm of the forex indicator SmartTrend Analyzer, you can quickly determine which trend is developing in the market at the moment. The SmartTrend Analyzer technical indicator is presented on the chart as a set of points for easy interpretati

QuantAlgo Signal is one of our best Premium Indicators.
It was designed with an intention of giving traders clear and precise entry signals.
It's main strength is in the possibility of simulating the trades and giving you realistic results.
With this features it is incredibly simple to find the settings you like the best!
QuantAlgo Signal is very simple to use, therefore it is suitable for both beginning and experienced traders.
Features: Precise Entries Backtesting simulation

The "Trend Orbital" indicator is a tool for tracking trends in the financial asset market. It is based on the analysis of price data and provides a visual interpretation of the current direction of price movement.
Options: InpAmplitude: Amplitude - determines the amount of volatility that the indicator takes into account when determining the trend. Group "Arrow": InpCodeUpArrow: Up Arrow Code - Defines the arrow symbol to display an uptrend. InpCodeDnArrow: Down Arrow Code - Defines the arrow

The "Trend Tandem" indicator is a trend analysis tool in financial markets that helps traders determine the direction of price movement.
Options:
RISK: Determines the level of risk taken into account in the trend analysis. The higher the value, the more aggressively volatility is taken into account. SSP (SSP Period): Defines the period of the moving average used to identify a trend. The higher the value, the smoother the trend signal will be. CountBars: Determines the number of bars on whic

Bu indikatör Deriv firmasındaki Boom ve Crash çiftlerinde spike hareketlerini tespit etmek ve işleme girmek için kullanılır. Kullanılan çiftler Boom300, Boom500, Boom1000, Crash300, Crash500, Crash1000. İndikatör, beklenen yönde ok işareti verdiği zaman işleme girilir ve indikatörün gösterdiği destek/direnç bölgelerine Stop Loss koyulmalıdır. İndikatör yeniden boyama(repaint) yapmaz. Trend takibi için değil, spike yönünde işleme girmek için kullanılır. Tavisye edilen; sadece spike yönünde işlem

MOST is applied on this RSI moving average with an extra default option added VAR/VIDYA (Variable Index Dynamic Moving Average)
MOST added on RSI has a Moving Average of RSI and a trailing percent stop level of the Moving Average that can be adjusted by changing the length of the MA and %percent of the stop level.
BUY SIGNAL when the Moving Average Line crosses above the MOST Line
LONG CONDITION when the Moving Average is above the MOST
SELL SIGNAL when Moving Average Line crosses belo

Trend based on Extremum Levels and Volatility göstergesi, yatırımcıların trend kırılma noktalarını ve farklı zaman dilimlerinde potansiyel kar alma seviyelerini belirlemelerine yardımcı olmak için tasarlanmış kullanışlı bir araçtır.
Gösterge forex, vadeli işlemler, hisse senetleri, endeksler, emtialar ve kripto para piyasalarında kullanılabilir.
Bu evrensel gösterge yerel ekstrema, volatilite ve ortalama fiyat sapmasına dayalı trendler oluşturarak hem küçük hem de büyük zaman dilimlerinde k

ATR Bantları Uyarısı, kanal genişliğinin sabit bir çarpan ("Çarpan") ve "Ortalama Gerçek Aralık" göstergesinin değeri olarak hesaplandığı bir kanal göstergesidir. Bollinger Bantlarından farklı olarak bant genişliği çok sık değişmez; ATR Bant Uyarısı göstergesinde bantlar genellikle uzun düz çizgilere sahiptir.
ATR Bantları Uyarısının yorumlanması, fiyatın çoğu zaman bantların içinde olduğu gerçeğine dayanmaktadır ve fiyatın sınırlardan birine ulaşması bir trend değişikliğine işaret edebilir.

ENG-GOLD Scalper It is an auxiliary indicator that identifies potential targets and determines the place of entry with a stop loss that works on Heiken Ashi candles
The green lines are usually the targets, the red lines are the stop loss, and the yellow lines are the entry location.
This file is recognized on small and medium frames, usually less than the watch frame
I highly recommend using XAUUSD US100 US30 USOIL
DYJ SignalSourceOfRSI is a momentum oscillator which shows price strength by comparing upward movements of Close prices to their downward movements over a selected number of periods. There are two kinds of signals provided by RSI: RSI reaching of either overbought or oversold level and then making a bit of reversal: Signals to buy are generated falling of RSI below level(30) and Signals to sell are generated rising of RSI above level(70) Falling of RSI below level(30) and then rising above level

The TimeCycleCaptor indicator is an innovative tool for accurately visualizing the market trend and generating buy and sell signals.
The market trend plays a key role in making trading decisions, and our indicator provides a reliable tool for determining it. We have made traders' dream of non-lagging moving averages come true in our indicator.
TimeCycleCaptor is capable of predicting future values and is designed to both identify the underlying trend and identify short-term buy or sell si

In the trading world, there is no universal indicator that always provides exceptionally profitable signals regardless of market conditions. Despite your persistence, such a tool simply does not exist. However, with the Trend Master Arrow indicator you will have a reliable assistant in creating your own trading system.
Although following arrow signals requires caution and additional filters, the Trend Master Arrow indicator provides valuable information for identifying possible reversals or s

The Market Might indicator, despite its apparent simplicity, is based on complex analytical algorithms that allow you to accurately determine the moments of entry and exit from transactions. The signals generated by this indicator are accurate and timely, appearing directly on the current candle.
The main task of the Market Might indicator is to determine the moments of entry and exit from trades. Therefore, it displays only the trend line and entry points, which provides a clear view of the

Do you want to know how an economic event will impact price? What will happen to price after the news? How has an economic news affected price in the past? This indicator can help you with that.
Do you like technical analysis? Do you enjoy studying the tick history to predict the future? But what do you think could be more important than technical analysis, what could improve technical analysis? Of course, it's fundamental analysis! After all, economic events directly impact the market, and t
Crash500 Spike Detector v1.0 Crash500 spike detector prints Down non repaint Arrow for catching crash spikes. It is suitable for 1M time frame for majorly crash500 When the Red arrow prints, it indicates high probability of crash spikes downwards. Its pretty straight forward since I designed it to follow strong trends. Use default settings, however, you can change the color of your chart background as may be appropriate. The system uses mathematical approach in to display statistical data inf

We proudly introduce the Forex Ballin Remastered trading system, your key to financial freedom. Developed by a team of experienced traders with trading experience of over 13 years . IMPORTANT! After the purchase please send me a private message to receive the installation manual and the setup instructions. Buy Forex Ballin Remastered and you could get Market Breaker, Tinga Tinga EA for free !*** Ask in private for more details.
*Promotional Price: $ 1199 . The price will increase by $ 5
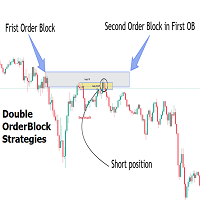
Introduction
The Price Action, styled as the "Smart Money Concept" or "SMC," was introduced by Mr. David J. Crouch in 2000 and is one of the most modern technical styles in the financial world. In financial markets, Smart Money refers to capital controlled by major market players (central banks, funds, etc.), and these traders can accurately predict market trends and achieve the highest profits.
In the "Smart Money" style, various types of "order blocks" can be traded. This indicator
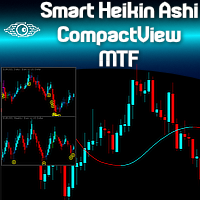
Are you already a fan of the Minions Labs Smart Heikin Ashi chart analysis tool? Or perhaps you're looking for a versatile Heikin Ashi chart capable of operating across multiple timeframes? Want to see the bigger picture before diving into the details, to make smarter ENTRY decisions? Do you want to build your own Dashboard of Symbols in just one chart, without dealing with messy multi-window MT5 stuff? Welcome to the Minions Labs Smart Heikin Ashi CompactView MTF indicator! Please see the power
With this indicator TheStrat bar numbers can be displayed above and below candles of the chart. The numbers have the following meaning: 1 = Inside Bar 2 = Directional Bar 3 = Outside Bar. In TheStrat-method there are Actionable and In-Force patterns / combos to define entries for trades. These patterns are also displayed by the indicator.
Here are the settings that can be configured: Number of lookbar bars : For how many candles in the past numbers are dislayed Color of inside bar : The color

FOTSI (Forex Overview True Strength Index) for MT5! FOTSI is an indicator that analyzes the relative strength of currencies in major Forex pairs. It aims to anticipate corrections in currency pairs following strong trends by identifying potential entry signals through overbought and oversold target areas. Theoretical Logic of Construction: Calculation of Individual Currency Momentum: FOTSI starts by calculating the momentum for each currency pair that includes a specific currency, then aggregat

The product gives optimized entries for 3min ,1 hr and day timeframes
Does well with indices ASIAN- HK50 AND CHINA A50 USA-US30,US100,US500 GER40 ,UK100 For stocks trade with the day timeframes Happy Entry employs advanced algorithms and real-time data analysis to identify optimal entry points with unprecedented accuracy. Its adaptive nature allows it to seamlessly adjust to changing market conditions, ensuring you never miss out on profitable opportunities. Whether you're a beginner or sea

THis indicator is a typical trend following indicator. ION BOT is based on the price position and its trail stop. When the price is above its trail stop the indicator is in an uptrend, and therefore the candles are coloured green, signalling the beginning of a trend with a green arrow.
Here are some of its key functionalities: Trend Analysis: The UT Bot Alert Indicator uses advanced algorithms to analyze market trends and identify key support and resistance levels. This information can help t

Using the Future Trend indicator, you can predict the future price movement a certain number of bars ahead. This indicator creates a line depicting simulated future price values, providing you with valuable information for making decisions about entering or exiting the market, and for setting or adjusting stop losses accompanying your position.
In addition, the Future Trend indicator has several parameters: HistoricBars - determines the number of historical bars that are used for analysis. Fu
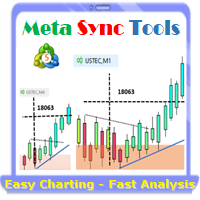
Supercharge Your MetaTrader Analysis and Trading with Meta Sync Tools! Struggling to analyze price action across different timeframes? Meta Sync Tools eliminates the frustration of unsynced crosshairs and charts, allowing seamless multi-timeframe analysis. Missing key correlations between assets and constantly switching between charts? Meta Sync Tools empowers you to visualize relationships between instruments effortlessly. Tired of wasting time on repetitive tasks? With 30+ Customizable Short

MT4 / MT5 için Astronomi Göstergesini Tanıtıyoruz: En İleri Göksel Ticaret Arkadaşınız Ticaret deneyiminizi göksel seviyelere yükseltmeye hazır mısınız? MT4 için devrim niteliğindeki Astronomi Göstergemizi arayın. Bu yenilikçi araç karmaşık algoritmaları kullanarak eşsiz astronomik içgörüler ve hassas hesaplamalar sunmak için geleneksel ticaret göstergelerini aşmaktadır. Bilgi Evreni Parmaklarınızın Ucunda: Göksel verilerin hazinelerini açığa çıkaran kapsamlı bir paneli gözlemleyin. Gezegenl

Introduction
The "Smart Money Concept" transcends mere technical trading strategies; it embodies a comprehensive philosophy elucidating market dynamics. Central to this concept is the acknowledgment that influential market participants manipulate price actions, presenting challenges for retail traders.
As a "retail trader", aligning your strategy with the behavior of "Smart Money," primarily market makers, is paramount. Understanding their trading patterns, which revolve around supply
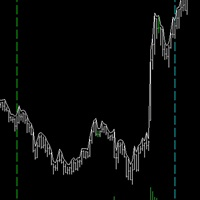
This is one of my most important indicators. Did you ever miss the session open/close? I did, which is why I made this indicator. It took a long time to get this right, since depending on your platform and timezone, it can be incorrect. It should be accurate for everyone now. It takes into account Daylight savings for NY and EU timezones, and should just work like magic on your charts.

PMax, KivancOzbilgic tarafından 2020'nin başlarında geliştirilen yepyeni bir göstergedir. PMax, iki takip eden stoploss göstergesinin kombinasyonudur; Birincisi Anıl Özekşi'nin MOST (Hareketli Zarar Durdurma) Göstergesi Diğeri ise bilinen ATR tabanlı SuperTrend göstergesidir.
MOST ve SuperTrend Göstergeleri, trend takip sistemlerinde çok iyi olsalar da, diğer göstergeler gibi yatay piyasa koşullarında parlak performans sergilemezler. Kar Maksimizörü - PMax bu sorunu çözmeyi amaçlar. PMax, MOST

The Fat and Slim indicator tracks strong and weak money in the market. It is derived from RSI, MFI and many similar indicators. Input values are closing prices and volumes. The RSI (yellow curve) is in the range -100 ... 100. It is additionally multiplied by a coefficient so that the curve is not compressed to the middle values at higher periods (a problem with the classic RSI with different periods). Strong/Fat red curve is RSI weighted by higher volumes. Weak/Slim blue curve is calculated so t
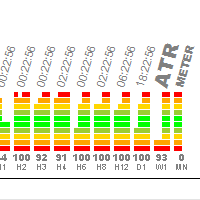
Gösterge, cihazdaki oynaklığı hızlı bir şekilde belirlemek için tasarlanmıştır. Programları değiştirirken, hangi araçların ve zaman dilimlerinin canlı ticaret olduğunu ve durgunluğun nerede gerçekleştiğini hemen anlamak çok uygundur. Gösterge, yüzdeye çevrilen ATR göstergesinin verilerini kullanır. Atr'yi grafiğe çizerseniz, ekranda yaklaşık 100-300 çubuk görünür olacak, bu değerin ortalamasını aldım ve varsayılan olarak 150'ye ayarladım (tercihlerinize bağlı olarak ayarlarda değiştirebilirsini
>>> BIG SALE PROMOTION: 50% OFF + GIFT EA! - Promo price: $64 / Regular price $129 <<< - The promotion will end soon!
The Forex Trend Tracker is an advanced tool designed to enhance the trading capabilities of forex traders. This sophisticated indicator uses complex mathematical formulas alongside the Average True Range (ATR) to detect the beginnings of new upward and downward trends in the forex market. It offers visual cues and real-time alerts to give traders a competitive advantage in th

Volume plays a crucial role in trading, serving as a key indicator of market activity and investor sentiment. Here are some important roles of volume in trading:
Confirming trends: Dow Theory emphasizes the importance of volume in determining market trends. Larger volume usually indicates greater disagreement between bulls and bears, while smaller volume may indicate higher market agreement with the current price. Capturing institutional moves: By analyzing volume over a period of time, one c

Overview
In the evolving landscape of trading and investment, the demand for sophisticated and reliable tools is ever-growing. The AI Trend Navigator is an indicator designed to meet this demand, providing valuable insights into market trends and potential future price movements. The AI Trend Navigator indicator is designed to predict market trends using the k-Nearest Neighbors (KNN) classifier.
By intelligently analyzing recent price actions and emphasizing similar values, it help
The Boom300 Spike Indicator is a powerful tool designed to identify significant price spikes in the market.
Key Features: Real-time Spike Detection: The indicator continuously scans the market for sudden spikes in price action, providing timely alerts when significant spikes occur. And recommend to use the 1Min chart Customizable Alerts: Traders can customize alerts to suit their preferences, including audible alerts, email notifications, and push notifications to mobile devices. User-Friend

Description: The Spike Sniper Crash Market Indicator is a sophisticated tool designed to identify and navigate volatile market conditions, often associated with sudden price spikes and market crashes. Leveraging advanced algorithms and technical analysis, this indicator serves as a vigilant guardian, alerting traders to potential market disruptions and providing actionable insights to mitigate risks and capitalize on opportunities. Key Features: Precision Spike Detection: The indicator employs c

The indicator determines the ATR value (points) in a classic way (taking into calculation paranormal bars/candles) and more correctly - ignoring paranormal movements of the Instrument. Correctly it is excluding paranormal bars from the calculation, extremely small bars (less than 5%( customizable ) of the standard ATR) and extremely large bars (more than 150% ( customizable ) of the standard ATR) are ignored. This is a Extended version - allows you to set calculation parameters a
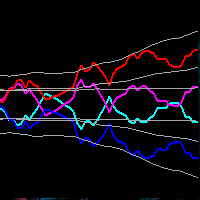
This indicator obeys the popular maxim that: "THE TREND IS YOUR FRIEND" Channel indicators incorporate volatility to capture price action. The Bollinger Bands is widely used, however, there are other options to capture swing action opportunities. Each study you will find here is unique, and reveals different types of price action.
https://www.mql5.com/en/market/product/116256
https://www.mql5.com/en/market/product/115553

MultiFractal Levels MultiFractal Levels – bu, seviyelerin eklenmesiyle değiştirilmiş bir Bill Williams fraktal göstergesidir. Fraktallar, ayarlarda izin verilen tüm TF'lerden oluşturulmuştur.
Seviyeler yalnızca henüz fiyata göre test edilmemiş en son fraktallara dayanarak oluşturulmuştur. Orijinal terminal göstergesine göre avantajları: Kolaylık Görünürlük bilgilendiricilik En son seviyeler Özelleştirilebilir fraktal Özelleştirilebilir seviyeler Gösterge kullanışlıdır çünkü çalışırken farklı z

This is the MT5 version of Ku-Chart.
This is an indicator devised by Ku-chan, a famous Japanese trader, based on the dealings of Lehman Brothers' discretionary traders. Unify the measuring stick of currencies to display the true value of currencies.
Although it is an indicator, it does not use a buffer and is displayed using objects such as trend lines. Also, instead of drawing on the subchart, it is drawn in an area far above the current price of the main chart, so you can switch from the
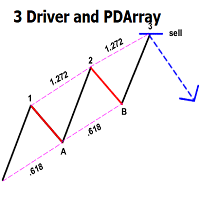
This indicator automatically identifies the SMC 3-Drive pattern and sends notifications to users when the pattern is detected. Additionally, the indicator identifies PDArray (including FVG and OB) and offers an option to combine the 3-Drive pattern with PDArray. This combination provides users with more reliable signals. What is the 3-Drive Pattern? This pattern is formed by three price pushes in one direction, providing a strong reversal signal (Figure 3). The key to identifying this pattern is

Introduction
The "Smart Money Concept" transcends the realm of mere technical trading strategies to embody a comprehensive philosophy on the dynamics of market operations. It posits that key market participants engage in price manipulation, thereby complicating the trading landscape for smaller, retail traders.
Under this doctrine, retail traders are advised to tailor their strategies in alignment with the maneuvers of "Smart Money" - essentially, the capital operated by market makers

Introducing our state-of-the-art Wave Indicator, meticulously designed for the discerning traders of the MQL5 community! At the core of this innovative tool lies an unmatched sensitivity to capture even the slightest market movements. Our Wave Indicator serves as the foundational element for constructing comprehensive trading strategies, providing you with an unwavering edge in the dynamic world of finance. Whether you're aiming to refine short-term tactics or develop long-term systems, this ind

TMA CG FAST MT4 REPLICADO PARA MT5 Cuenta con todas las caracteristicas del original con la funcion adicional de tener señal al fallo que consiste en que despues de una cantidad de velas establecida por el usuario emita una preseñal para una potencial entrada tiene alerta sonora para la posible entrada y la entrada definitiva tiene la posibilidad de repintar o no , queda a eleccion de usuario
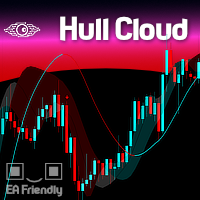
The Hull Moving Average is known for its ability to reduce lag and provide a clearer, more accurate depiction of market trends. By smoothing price data more effectively than traditional moving averages, it helps traders identify trend directions and reversals with greater precision. The Hull Cloud indicator elevates this by using four Hull Moving Averages working together like an orchestra. This combination creates a dynamic system that highlights short, medium, and long-term trends, giving trad
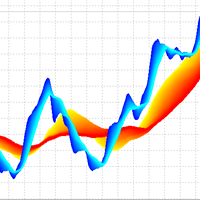
3D Trend Indicator is a non-repaint indicator using multiple moving averages with a 3D surface view. By using this indicator, you can remove uncertainties that can happen using a single and fixed moving average period. You can use a cloud area using a range of moving average periods. Also a wide range of visual settings are added to this indicator to have a better view from the cloud area. Alert and notification system added to the indicator to inform the trader about the action of candles on t
Apresentamos o Indicador de novo grafico - uma ferramenta poderosa para traders que buscam uma análise de preço suave e clara. Este indicador inovador calcula a média simples dos preços, oferecendo uma visão precisa e ajustada dos movimentos do mercado. Como Funciona : O Indicador de Média de Preços Simples (SMA) utiliza uma fórmula simples e eficaz: Ele soma o valor do último preço com o preço anterior. Em seguida, divide essa soma por 2 para obter a média. Fórmula : SMA = U ˊ ltimo Pre c ¸ o +

Unlock the power of Fibonacci with our advanced indicator!
This tool precisely plots Fibonacci levels based on the previous day's high and low, identifying the next day's key support and resistance levels. Perfect for day trading and swing trading, it has consistently generated weekly profits for me.
Elevate your trading strategy and seize profitable opportunities with ease.
NOTE: In the Input section make sure the draw labels are set to "True" so you can see each levels.

MinMax Levels MinMax Levels – önemli işlem dönemleri (gün, hafta ve ay) için maksimum, minimum ve açılış fiyat seviyelerinin göstergesidir.
Her Forex piyasası katılımcısı kendi ticaret sistemindeki seviyeleri kullanır. İşlem yapmak için ana sinyal veya analitik bir araç görevi gören ek bir sinyal olabilirler. Bu göstergede günler, haftalar ve aylar büyük piyasa katılımcılarının kilit işlem dönemleri olduğundan önemli dönemler olarak seçilmiştir. Bildiğiniz gibi fiyatlar seviyeden seviyeye

If you need an indicator that shows market entry points, then this is your indicator.
The indicator is not redrawn. Shows buy and sell points for any TF (time frame) and any currency pair. Settings are adjustable for all instruments. You can configure each parameter for any broker, for any account.
This is a PILLOW that is comfortable :)) Just check it out.....

Description of the Indicator The indicator "BullsBearsPulse" is designed for MetaTrader 5 and provides a visual representation of the Bulls Power and Bears Power indicators. These indicators are useful tools for technical analysis, particularly for the EUR/USD currency pair, to help traders identify potential trading opportunities. Functionality Bulls Power : This indicator measures the strength of the bulls (buyers) in the market. It calculates the difference between the highest price and a 20

RAR (Relative Adaptive RSI) göstergesi ile ticaret stratejilerinizi optimize edin! Bu gelişmiş teknik analiz göstergesi, Göreceli Güç Endeksi (RSI) gücünü adaptif tekniklerle birleştirerek, yaygın bir osilatörden daha hassas ve güvenilir sinyaller sağlar. RAR Göstergesi Nedir? RAR, MetaTrader 5 için tasarlanmış bir göstergedir ve RSI'yı yumuşatmak ve dinamik olarak piyasa koşullarına uyarlamak için Üssel Hareketli Ortalamalar (EMA) ve Adaptif Hareketli Ortalamalar (AMA) kullanır. Bu yenilikçi ko

PyNinjaTrader - NinjaTrader 8 için Sürükle ve Bırak Python API Bağlayıcısı
PyNinjaTrader, basit bir sürükle ve bırak stratejisi kullanarak Python komut dosyalarınızı NinjaTrader 8'e sorunsuz bir şekilde bağlar. Tamamen test edilmiş, hızlı ve etkili bu çözüm, stratejinin sunucu, Python betiğinin ise istemci görevi üstlendiği iletişim için websocket'leri kullanır.
Özellikler: - NinjaTrader 8 Terminaline Python girişi - Sürekli bağlantı için canlı tutma işlevi - NinjaTrader 8 hesap bilgilerini

MSnR Lines , bir grafikte destek ve direnç seviyelerini göstermek için tasarlanmış özel bir göstergedir. Bu seviyeler, Malezya Destek ve Direnç teorisine dayanarak, alanlar olarak değil, belirli fiyat seviyeleri olarak tanımlanan zirve ve vadilerden türetilmiştir. Özellikler: Üç tür seviye: A-Level, V-Level ve Boşluk Seviyesi. Seviyeler için tazelik göstergesi: Taze seviyeler taze olmayan seviyelerden daha önemlidir. Taze ve taze olmayan seviyeler için özelleştirilebilir renk ve stil. Yalnızca t

Индикатор тиковых объемов представляет собой инструмент технического анализа, используемый для оценки активности трейдеров на рынке. Этот индикатор отображает количество тиков (изменений цен) за определенный временной период и показывает преобладание тиков, направленных на покупку или продажу.
Основные характеристики и функции индикатора тиковых объемов: Гистограмма объемов:
Белый цвет: Означает преобладание тиков, направленных на покупку. Когда количество покупок превышает количество прода

Kill zones ICT, piyasaları daha iyi bir perspektiften görmenizi sağlayacak güçlü bir göstergedir. Bu gösterge aracı, ticaretin en önemli faktörlerinden biri olan zamanı grafik üzerinde göstermektir. Kolay arayüzü ile daha yüksek volatiliteye sahip zamanların ve daha az aktif saatlere sahip seansların hareketinin ne olduğunu kolayca görebileceksiniz. Bu göstergeyi BİT / Likidite kavramlarını takas etmek için nasıl kullanabilirim?
Kill Zones ICT ile ne yapabilirsiniz?
Piyasalarda ana otur
The Interactive RSI indicator can generate RSI divergence with the availability of user defined filters. It can generate voice alerts for RSI oversold and RSI Overbought situations. Moreover it can also generate voice alerts for RSI Divergneces as well as when price breaks above or breaks below the support and resistances created upon divergence ouccurence. The voice alerts are generated in a way that you will know which market has reached the oversold and overbought conditions as well as the r

Trend reversal identification: The K-line countdown indicator helps traders capture trend reversal signals by identifying excessive buying and selling behavior in the market. This indicator is particularly effective when the market is in extreme states. Risk management: This indicator can help traders identify potential risks in the market before the trend reverses and adjust positions in time to avoid losses. For example, you might consider reducing your long position when a bullish countdown c

Introducing Smart Gold Pro, a versatile trading indicator suitable for all experience levels. It provides precise buy and sell signals for the gold market, adaptable to any timeframe. Powered by advanced algorithms, Smart Gold Pro accurately analyzes price movements and volume dynamics. What sets Smart Gold Pro apart is its reliability—it doesn't repaint past signals, ensuring dependable insights into potential market reversals. Its user-friendly visual interface on the chart, along with audible

Price update indicator — can issue any type of alert when the price reaches certain levels set by a trader. There are three types of price levels: the first one is used when the price rises above certain level (displayed with the green line on the chart), the second one is used when the price falls below certain level (displayed with the red line on the chart), and the third one is used when the price reaches the certain level exactly (displayed with the yellow line). Three alert types include

The "Channel Craft" indicator is a classic tool from the family of channel indicators, allowing traders to react promptly to price movement beyond the established channel boundaries. This channel is formed based on the analysis of several candles, starting from the last one, which helps identify the extremes within the studied range and construct channel lines. Trading within the channel is one of the most popular strategies in the forex market, and its simplicity makes it accessible even to no

The entry points provided by the Olo May indicator should be considered as potential points of change in market direction. This indicator is based on the use of a cyclic wave relationship, which makes each entry point optimal for identifying changes in movement.
The simplest way to use this indicator is to open a position in the direction of the current trend. However, the best results are achieved when combining it with fundamental news, as it can be used as a tool to filter news events, sho

This technical analysis indicator allows you to determine with high probability whether a trend or a flat pattern prevails in the market. It can be used both for trading within a channel and for breakout trading, provided that stop losses are used to protect against false signals.
The indicator displays the channel in the form of lines located above and below the price, like other similar indicators. The upper and lower lines can also act as resistance and support levels.
It quite accuratel

Determining the current market trend is a key task for successful trading. It is for this purpose that the Book Scheme indicator was developed, which is an advanced algorithm for visually displaying a trend on a chart.
Many traders dreamed of having reliable moving averages that kept up with the market. It was this dream that I turned into reality with the help of my indicator. Book Scheme allows you to predict future values and create accurate signals for entering and exiting the market.

Descubra o poder do nosso indicador de alta precisão, projetado para identificar as regiões de alvo e exaustão de qualquer ativo. Testado e validado por mais de 3 anos nos mercados de mini dólar e mini índice, ele oferece confiabilidade e eficácia incomparáveis. Transforme sua estratégia de trading e alcance novos patamares de sucesso com nossa ferramenta inovadora.
MetaTrader platformunun uygulama mağazası olan MetaTrader Mağazadan bir ticaret robotunun nasıl satın alınacağını öğrenin.
MQL5.community ödeme sistemi, PayPal, banka kartları ve popüler ödeme sistemleri aracılığıyla yapılan işlemleri destekler. Daha iyi bir müşteri deneyimi için satın almadan önce ticaret robotunu test etmenizi şiddetle tavsiye ederiz.
Ticaret fırsatlarını kaçırıyorsunuz:
- Ücretsiz ticaret uygulamaları
- İşlem kopyalama için 8.000'den fazla sinyal
- Finansal piyasaları keşfetmek için ekonomik haberler
Kayıt
Giriş yap
Gizlilik ve Veri Koruma Politikasını ve MQL5.com Kullanım Şartlarını kabul edersiniz
Hesabınız yoksa, lütfen kaydolun
MQL5.com web sitesine giriş yapmak için çerezlerin kullanımına izin vermelisiniz.
Lütfen tarayıcınızda gerekli ayarı etkinleştirin, aksi takdirde giriş yapamazsınız.