Handelsroboter und Indikatoren für den MetaTrader 4 - 59

Displays a digital clock in the chart in realtime.
Benefits: Current time always in sight for market open/close, economic data, etc. Displays accurate time (server/broker time) Clearly visible (set color, size, font, position) Always runs/refreshes even without new price tick Hint: To display the most accurate time, use the server (broker) clock setting combined with the time (hour) offset for your time zone.
FREE

We stopped creatin small tools for MT4. Our focus are on MT5. Only very useful tools maybe we will develop to MT5. New Candle Alert is a simple indicator that notify you when a new candle is formed.
You can modify the notification message that will appear for you. The alarm sound is default by meta trader program.
MT5 version: https://www.mql5.com/pt/market/product/37986
Hope you enjoy it. Any doubt or suggestions please notify on private or by comments.
See ya.
FREE
Zeigt die aktuellen Marktinformationen mit sekündlicher Aktualisierung an. Spread-Größe; Swap-Größe: für Short- und Long-Positionen; Optional können Sie die Anzeige der aktuellen Uhrzeit aktivieren; Multifunktionswerkzeug : 66+ Funktionen, einschließlich dieses Tools | Kontaktieren Sie mich bei Fragen | MT5-Version In den Indikatoreinstellungen können Sie folgendes konfigurieren: Schriftgröße; Textfarbe; Positionierung wählen: linke/rechte Ecke des Charts; Anzeige der aktuellen Uhrzeit e
FREE

EA "GenisysX Knight" is an advanced system that exploits unique fluctuation between AUD, CAD, and NZD currencies. Historically results show that these pairs used in composition always return back first moved pair after fast movement in one direction. This observation can allow us to include a grid-martingale system where can get maximum points of these unique situations.
EA "Undefeated Triangle" uses only 3 pairs: AUDCAD, AUDNZD, and NZDCAD. Real account monitoring ; Much cheaper than si
FREE

The indicator based on (Williams` Percent Range) analyzes the signal line touches along the channel walls and forms zones for deciding on the direction of the price movement. For convenience, an alert function is built in. You can also enable and disable the desired zones. Several indicators with different settings can be used on one chart. This will help you choose the best strategy.
FREE
Version History : Date Version Changes 6/20/2022 1.00 Initial release 6/21/2022 1.10 Add global variables for Minimum (SYMBOL_volume_min) and Maximum (SYMBOL_volume_max) History Volumes Description : RedeeCash Volumes Indicator is the Volumes indicator that you have come to trust for market entry and exit with the added benefit of exposing key metrics as global variables. Including global variables in an indicator permits easier interaction with expert advisors (EA) and scripts. When attaching
FREE
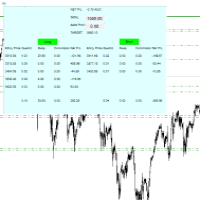
For all those traders who trade multiple positions , both long and short, in the one (or many) financial instruments, including grid trading, cost averaging, hedging, martingale, etc , by dragging it on to any chart from the navigator, this free and easy to use interactive panel utility will offer you the following benefits:
1. Live up to date visual data:
a. Shows live up to date details of all positions, both long and short, you have open in the particular financial instrument of the chart
FREE

The indicator allows you to trade binary options. The recommended time frame is М1 and the expiration time is 1,2,3 minutes. The indicator suitable for auto and manual trading. A possible signal is specified as a arrows above/under a candle. You should wait until the candle closes! Arrows are not re-painted Trade sessions: TOKYO section (Half-end) Currency pairs: USD/JPY Working time frame: M1 Expiration time: 1,2,3 minutes. The indicator also shows good results when using the martingale strateg
FREE
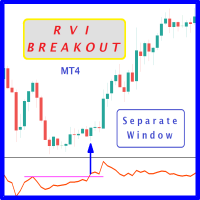
Probability emerges to record higher prices when RVi breaks out oscillator historical resistance level. It's strongly encouraged to confirm price breakout with oscillator breakout since they have comparable effects to price breaking support and resistance levels; surely, short trades will have the same perception. As advantage, a lot of times oscillator breakout precedes price breakout as early alert to upcoming event as illustrated by 6th screenshot. Furthermore, divergence is confirmed in case
FREE
Данный индикатор отмечает участки разворота тренда, в точках разворота давая сигнал на вход в рынок в виде стрелок соответствующего цвета и направления движения в виде линий, а также звукового оповещения. Основан на закономерностях рынка FOREX, точных определениях текущего экстремума и нахождения свечных моделей на вершинах/низах рынка. Универсальный алгоритм помогает определить точки разворота указывая стрелками где осуществить вход в рынок. Дополнительно Индикатор не перерисовывается. Выводит

Discover: The Quantum Forex Trading System _Mastering the Market with Advanced Algorithms & Multifaceted Strategies_ ---This system requires you to install https://www.mql5.com/en/market/product/104637 for trading signals to be generated. Redefining Forex Trading: In the vast realm of forex, where uncertainty is the only certainty, what if you had a tool that seamlessly combined the best trading strategies into one efficient system? Enter the Quantum Forex Trading System — a harmonious blend
FREE
Trender EA - автоматическая система, в основе которой заложен принцип торговли по тренду. Сначала система идентифицирует направление тренда и после этого ищет точки для входа в сделку. Уровень стоплосс определяется автоматически, а тейкпрофит на основе рассчитанного стоплосса. Советник оснащён системой сопровождения сделки "От цели к цели" - системы способной брать несколько целей с частичным прикрытием сделки. Настройки: Параметр Описание ID EA Идентификатор ордеров советника Mode trade Режи
FREE

This panel brings convenient functionality - Virtual Stop Loss and Take Profit levels .
Peculiarities This panel allows to hide the Stop Loss and Take Profi t levels of your trades. The panel stores these levels in memory . When the market price reached one of the levels, a trade is closed and terminal generates a message indicating that a virtual level was triggered. there are 4 options for setting Stop Loss: Fixed Stop Loss - fixed Stop Loss Trailing Stop Loss - c
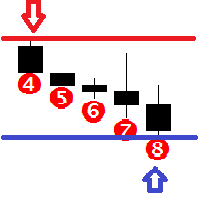
Features This indicator determines consecutive bullish and bearish bars; Determines the High and Low for the last N bars (N can be changed in the settings); It shows the Buy and Sell signals based on the values of other indicators, such as Bollinger Bands, Stochastic and MACD; It graphically displays from 4 to 12 consecutive bullish and bearish bars with an alert; It is possible to disable the alert and unnecessary graphical elements; It is also possible to adjust the number of bars in history,

What is a tool ? This indicator use for comparison of 8 major currency from 28 pairs and multiple timeframes and calculates a score of strength from 0-100. How to use Place the indicator on any pair any timeframe, And entering only the value of X Y position to be displayed in the graph. Pair : Any Timeframe : Any Input Parameter Start X Position : Value of X on chart Start Y Position : Value of Y on chart Visit my products Target Profit Magic Target Profit All The Profit Tracker Currency
FREE

BB Plus Driverは BB Plus !インジケータ をフルに活用していただくためのEAです。
すべての通貨ペア、タイムフレームで利用できます。BB Plus !インディケーターが無い場合は、ボリンジャーバンドにタッチしてからのリバウンドでエントリーするEAとして稼働します。 10年間のバックテストでは、BB Plus ! インジケータを使用しAUDCAD_M15およびGBPNZD_M5に適用した場合に最も良い結果が得られました。スクリーンショットをご覧ください EAとしての基本的な機能を装備しながら、わかりにくい設定を排除し、初心者の方でも簡単にご利用いただけます
BB Plus ! インジケータ は1分足から使える高精度のスキャルピング用逆張りサインツールです。
・すべての通貨ペア、時間足で利用でき、絶好のタイミングでのエントリー・チャンスをお知らせします ・ ボリンジャーバンドにタッチしてからの反転を 基本戦略とし、 独自のアルゴリズムを加えることで、精度の高い反転ポイントでサインを発信します ・勝敗判定機能により 直近の相場環境に対するこのインディケータの
FREE
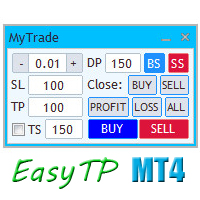
A full-featured trading panel that has minimal dimensions and makes one-click trading as informative, fast and convenient as possible.
Supported features: opening of any types of orders; breakeven; trailing-stop; virtual take profit and stop loss (not visible to the broker); showing the general trading information panel; display of previously closed orders on the chart; installation on a chart of price signal lines; sending push-notifications when price crosses price signal lines; the ability
FREE

Requirement for the EA use: the EA needs a low spread (recommended spread value is 2) and minimum slippage! Systems that operate based on Bollinger waves signals are considered to be among the most popular well performing systems. This Expert Advisor belongs to such systems. In addition to Bollinger waves, the Expert Advisor uses the following indicators: Stochastic, RSI and Moving Average. Recommended Expert Advisor operation time is from 00:05 to 08:00 (the interval between the close of the A

This expert advisor is very simple and easy to understand, it is based on the martingale strategy.
Recommended Pairs For Default Strategy: - GBPUSD - H1 Expert Advisor Inputs: - Strategy --> You have 4 options: Low Risk, Mid Risk, High Risk, Custom Strategy ( Custom Strategy is based on CrossOver Moving Average ); - Lot_Win --> Default value: (0.01) - Lot_Start --> Default value: (0.01) - Lot_Multiple --> Default value: (1), switch the value to (2 or above) if you want to use martingle stra
FREE

https://www.mql5.com/zh/signals/717987
Expert Advisor Demo: VPS
IP: 152.32.215.72
Login-Konto: Taolishen
Passwort: qq2356692354
Über den Autor
Der Handel ohne EA-Beteiligung birgt enorme Risiken. Aus Angst oder Gier werden wir unsere beste Handelsposition verlieren. Wenn der EA jedoch nicht beurteilen kann, kann dieser EA uns größeren Risiken aussetzen.
Wir brauchen einen EA mit Urteilsvermögen, um mit unserem Handel zusammenzuarbeiten.
Über EA
Taolishen ist ein EA mit mehreren Handel
FREE

Dynamic MA Trend Zone – Dynamische Gleitender-Durchschnitt-Trendzone
Die Dynamic MA Trend Zone ist ein visuell ausdrucksstarker Indikator, der die Veränderungen der Markttrends dynamisch verfolgt. Durch die Darstellung gleitender Durchschnitte auf drei unterschiedlichen Preisniveaus (Schluss-, Hoch- und Tiefkurs) entsteht eine farbkodierte Trendzone, die die Richtung und Stärke des Trends deutlich anzeigt.
Merkmale und Funktionen:
- Farbkodierung der Trendrichtung: Der Indikator passt die Fa
FREE

This trend Advisor is based on Alexander elder's multi-timeframe strategy. Automatic Advisor "Elvis79" royally strict, reliable and chic. It is optimized for the USDZAR currency pair. With the author's settings is set to the timeframe H4. At the same time, the EA trades at the level of the daily timeframe, that is, it holds the trade for several days.
The EA uses a sophisticated trading system "Giant". His whole concept is directed against the risky and irresponsible policies. Before trading on
FREE

Check the Trend Power This indicator is designed to identify the POWER of trend. This is NOT define bullish or bearish trend. It is quite easy to look at the power when the indicator line turns Green the trend are strong when the indicator line turns Red the trend are Weak strategy for trade is : Open possition only when the power go Green Exit possition when the power change to Red
FREE

A simple and convenient utility for closing orders. It can close both all orders together as well as buy, sell or pending orders separately. Has an intuitive graphical interface. MT5 version of the utility - https://www.mql5.com/en/market/product/78599 If you like this utility, take a look at my other products - https://www.mql5.com/en/users/nina_yermolenko/seller
FREE
"Visual Range - Spread Indicator". This Indicator is an Essential Tool for Manual trading. it helps to avoid "off price" and "bad" entries caused by abnormally High spreads. ...................................................................................................................... At the Market Opening and News Reports - the Size of the Spread can go temporarily widely High. The Indicator shows the current Size of the Spread visually on the chart and its distance from the current pr
FREE
This EA opens a buy sell order based on the H4 trend. When the price goes over 100 pips ea keep opening orders against the price until the profit is positive and EA will close all orders and continue the new round. Requirement - Flatform: MT4 - Symbol: XAUUSD. - Time frame: M15 - Minimum deposit: >500$ - Leverage: 1:500 and higher - ECN broker - Virtual Private Server hosting (VPS) Parameters
FREE

Определение текущей тенденции - одна из самых важных задач трейдера независимо от стиля торговли. Индикатор Speed Trend поможет с достаточно высокой вероятностью это сделать. В расчетах индикатора используется авторская методика. Speed Trend подходит для любой валютной пары, любого таймфрейма, и не меняет свои показания. Индикатор очень просто в настройке, что является хорошим преимуществом для исследований.
Параметры
Основные настройки ( Main Settings ): IndicatorPeriod - период для рас

Индикатор реализован для определения классического канала движения цены, который используется на крупных биржевых площадках. Не перерисовывается Синий уровень - это уровень поддержки Красный уровень - это уровень сопротивления Белый уровень - является Pivot-уровнем Настройки Period_SEC - ввод значения периода . Примечание: Индикатор определяет уровни только на пятизначных котировках! Метод торговли: Открытие позиций осуществляется от уровней , именно на их значениях происходит отскок цены
FREE

CVB Cumulative Volume Bands: Maximieren Sie Ihre Trades mit kumuliertem Volumen! Der CVB Cumulative Volume Bands ist ein fortschrittlicher Indikator, der für Trader entwickelt wurde, die präzise Signale auf Basis des kumulierten Volumens suchen. Durch die Nutzung von kumulierten Volumenbändern bietet dieser Indikator klare Einblicke in den Kauf- und Verkaufsdruck am Markt, um Umkehrungen und starke Kursbewegungen zu identifizieren. Cumulative Volume Bands for MT5 !
Hauptmerkmale:
FREE

Here is the provided text with line breaks:
This is the logic of a Forex EA.
This EA is very unique.
Normally, entries are made immediately based on overbought and oversold values of the RSI indicator.
However, this EA is different.
It is slightly modified.
It doesn't enter immediately once it becomes oversold.
Instead, it waits a bit after oversold conditions to see a reversal before entering.
The same theory applies to overbought conditions.
After it becomes overbought, it waits a w
FREE

Nach 7 Jahren habe ich mich entschieden, einige meiner Indikatoren und Expert Advisors (EAs) kostenlos bereitzustellen.
Wenn Sie sie nützlich finden, bitte unterstützen Sie sie mit einer 5-Sterne-Bewertung! Ihr Feedback motiviert mich, weiterhin kostenlose Tools anzubieten. Weitere kostenlose Tools finden Sie hier .
_________________________________ "RSI mit Bändern" Indikator – Bessere Handelsentscheidungen Der "RSI mit Bändern" Indikator kombiniert den klassischen RSI mit einfach
FREE

A signal indicator consisting of several well-known indicators that process data sequentially. 2 options - for schedule and basement. In the settings it is possible to enable alerts about the change of trend (alerts) sound, by e-mail and push. It is possible to change the colors and thickness of the lines, the colors and codes of the arrows, the number of calculation bars and separately configure the parameters included in the indicators.
FREE

The Visual Result Calculator Indicator is a powerful tool designed to enhance your trading experience on the MetaTrader platform. This intuitive and user-friendly indicator allows you to visualize potential profits or losses on a trading chart, helping you make better-informed decisions and manage your trades with precision. The Indicator displays a dynamic line on the trading chart, representing the potential profit or loss of a trade based on the start and end of the line. Simply click and
FREE

Description I think, almost all traders dream about non-lagging MA. I have realized that dream in my indicator. It allows forecasting future MA values! The indicator can be used in four different ways: The first one - forecast for the desired amount of bars. Thus, you are able to evaluate future price behavior. The second one - generating non-lagging "averages". That can be implemented by moving MA back by the half of the averaging period and setting the forecast the necessary amount of bars ahe
FREE

DG Equity Monitor is a useful tool that keeps track of the daily transactions made on the account. The EA automatically and instantly closes all the trades running based on two conditions: 1. If the daily profit target is hit. 2. If the maximum drawdown is reached. An alert is sent immediately one of the above conditions are met.
Parameters: Show Account Info -Choose whether or not to display the Account Info on the chart.
Show Pop Up Alert -Show alert on chart when either condition 1 or 2 are
FREE

LOOK AT THE FOLLOWING STRATEGY WITH THIS INDICATOR. Triple RSI is a tool that uses the classic Relative Strength Indicator, but in several timeframes to find market reversals. 1. ️ Idea behind the indicator and its strategy: In Trading, be it Forex or any other asset, the ideal is to keep it simple, the simpler the better . The triple RSI strategy is one of the simple strategies that seek market returns. In our experience, where there is more money to always be won, i
FREE

O EA "Surprising" é um robô inteligente que abre ordens em momentos estratégicos, sempre buscando lucro e segurança da conta. Pode ser usado em vários ativos, mas provou ser mais lucrativo em Ouro. O timeframe M5 ou M30 é muito bom para este robô. Se houver uma única ordem aberta, ele a fechará usando o trailing stop, buscando o melhor lucro. Se o preço se mover na direção oposta à ordem aberta, ele abrirá uma nova ordem do mesmo tipo na próxima zona de suporte ou resistência para compensar a o
FREE

Gleitende Durchschnitte ändern sich unterwegs. Der Indikator wählt automatisch einen Zeitraum für die Berechnung der gleitenden Durchschnitte aus. Je gerichteter die Bewegung ist, desto größer ist die Mittelungsperiode. Wenn sich der Trend verlangsamt, nimmt die Periode der gleitenden Durchschnitte ab und sie werden schneller. Dies ermöglicht eine schnellere Reaktion auf eine Trendwende.
Der Indikator funktioniert gut in einem Trend oder an einem Trendumkehrpunkt. In der Seitenwand kann der I
FREE
Description PirDpo is a mean reversion trading robot that works only LONG. It can be used on several indexes like sp500, dow jones 30, eurostoxx 50, dax 30, etc., on a daily timeframe. It basically applies this algorithm: Calculate detrended price with this formula detrend = (close - simple_moving_average(length))/simple_moving_average(length) if detrend <= min(detrend,length) the BUY SELL after timeExit days Key Features Absence of dangerous algorithms. It works just when the bar is closed. Ea
FREE

For more details, join with www.telegramtradecopier.com
TelegramTradeCopier is the world's first lifetime licensed telegram trade copier software for forex, crypto and commodity trading. Any signal format can be converted to a trading action by TTC. The system has two components Desktop app EA file You need to install and login to the desktop app with your telegram details. Then it will listen to channels configured by you and decode all messages into trading actions with proper validat
FREE

Future Price Future Price - Der Indikator zeigt die erwarteten Optionen für die zukünftige Preisbewegung basierend auf der Suche nach Übereinstimmungen in der Kurshistorie. Der Indikator arbeitet in zwei Modi, der erste - Aufzählen und Anzeigen einer bestimmten Anzahl von Optionen, der zweite - der Indikator zeigt eine eingestellte Option an.
Beschreibung der Einstellungen Statische_VARIANTEN = 0; - Stellen Sie die gewünschte Option auf die Anzeige ein, wenn = 0, funktioniert die Iteration de

Double Price Channel Preiskanalindikator für eine bestimmte Anzahl von Balken, die in den Einstellungen festgelegt sind.
Indikatorlinien repräsentieren dynamische Unterstützungs- oder Widerstandsniveaus. Die obere Grenze ist das Preismaximum für eine bestimmte Anzahl von Perioden, die untere ist das Minimum. Im Gegensatz zu gleitenden Durchschnitten, die auf Schlusskursen basieren, wird der Indikator nicht von kleinen Schwankungen „abgelenkt“. Es wird nur neu berechnet, wenn sich die Grenzen ä
FREE
The Tickerly TV Connector allows seamless integration between TradingView strategies and your MT4 terminal.
With this tool, you can automate trade execution by linking TradingView’s powerful scripting environment to your MetaTrader Terminal. Features include fast trade execution via Tickerly’s engine and easy setup using webhooks.
This EA is perfect for traders who want to deploy custom TradingView strategies on MT4, keeping their terminals in sync with real-time market conditions. Requires m
FREE

The Equity Curve indicator is a simple and helpful tool that shows the development of the equity curve in real time. For precision measurement, it should be used in a separate window with a period of M1.
Main features The indicator shows the development of the equity curve in real time. High precision on the minute chart. High-speed calculation. Available for MT4 and MT5. Please visit the Equity Curve indicator product page for the input and output parameters settings.
FREE
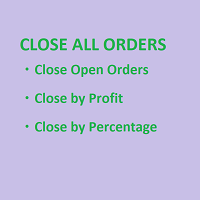
SmartClose(Close All Orders) helps you close all your trades. You can use it on any symbol. You can also set a warm value to manage the risk. With these functions: Close Open Orders : Close all open trades in the trading account. You don't need to set a value for the "value" parameter. Close by Profit : Close trades when profit reaches a specific predefined level. You need to set a value for the "value" parameter. Close by Percentage : Close trades based on a certain percentage of the balance.
FREE

The DJ_15_811543657_S_BB_CF_SQX is an algorithmic trading strategy for MetaTrader, tested on DJ using the M15 timeframe from December 7, 2017, to June 2, 2023. There is no need to set up parameters, all settings are already optimized and fine-tuned.
Recommended broker RoboForex because of EET timezone.
You can find the strategy source code for StrategyQuant at the link: https://quantmonitor.net/dow-jones-bollinger-breaker/
Key details are:
MagicNumber: 811543657
Main Chart: Current s
FREE

Alexander the Great King EA: Unleash the Power of Strategy with Alexander the Great King EA: Your Ultimate Trading Companion Hello, skilled traders! Are you ready to conquer the financial markets with precision and strategy? Introducing Alexander the Great King EA , the revolutionary Expert Advisor (EA) crafted to elevate your trading experience on MetaTrader 4 (MT4). Built with strategic brilliance and a keen understanding of market dynamics, this EA is your perfect ally in navigating the ever-

Easily access to a deep knowledge of the market movement with "M.M. Deepness Arrows"!! This indicator will give you advices on buys and sells after having analized the deepness of the market. The entrance "trigger" will be given after studying each candles' max and min avoiding, this way, the misleading data released by the opening and closure prices (given by the brokers). Thanks to the use of these arrows you'll be able to easily understand if i'ts the right time to buy or sell. If you want th
Simple and unobtrusive utility for displaying weeks, days and hours
Options to control the display of separator lines and labels allow you to customize them to your own taste Display of the separator lines either only in the main chart, or across any indicator windows Automatically reduce intensity of less relevant separator lines and labels for the chart‘s current magnification
FREE
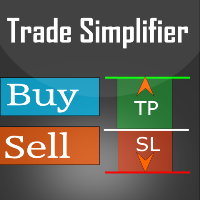
Trade simplifier is a trade panel that simplifies trade opening. It is simple and easy to understand, with key features to ease trading. Features include:
Order type selection Fixed lot entry from the chart user interface Easy Take profit entry field on the chart user interface Visual take profit selection and adjustment via the line that appears when you click the Take Profit button Easy Stop loss entry field in points on the chart user interface Visual Stop Loss selection and adjustment via
FREE

A. Dieser Pivot-Indikator zeigt die Tage des Pivot-Preises an.
B. Sie zeigt auch den Widerstand R0.5, R1, R1.5, R2, R2.5 und R3
Es zeigt auch die Unterstützung S0.5, S1, S1.5, S2, S2.5 und S3
EINGANG:
Unter Eingabe sehen Sie 3 Variablen
1.ExtFomula. Hier können Sie Ihren bevorzugten Ausgang bei einem Widerstand oder einer Unterstützung im Diagrammfenster auf höchstens 1 oder 2 oder 3 einstellen. 1 steht für einen Austritt am Widerstand oder Träger 1. 2 steht für einen Austritt am Widerstand
FREE

Superio is semiautomatic Expert Advisor. It will follow your Buy Stop or Sell stop order. First order will follow your lot on Buy Stop or Sell Stop. Superio is a combination of Martingale and Hedging strategy. After 7 wrong positions, it will change position and start hedging position. It was backtested and optimized using real ticks with high quality. The Expert Advisor has successfully passed the stress test with slippage approximate to the real market conditions. This EA can run on several in
FREE
SafeMartin_VS_lite - an automated trading system optimized for EURUSD H4, but it can work on other currency pairs and timeframes. The Expert Advisor has a minimum of settings, which allows you to immediately put it into operation, without a lengthy procedure for selecting the optimal parameters. Several Expert Advisors are allowed to work in one terminal. Works with both 4 and 5-digit quotes. Not intraday! Not scalping! Designed for long-term trading. In the new version, the number of user s
FREE

MQLTA Support Resistance Lines is an indicator that calculates the historical levels of Support and Resistance and display them as Lines on chart. It will also Alert you if the price is in a Safe or Dangerous zone to trade and show you the distance to the next level. The indicator is ideal to be used in other Expert Advisor through the iCustom function. This DEMO only works with AUDNZD, the full product can be found at https://www.mql5.com/en/market/product/26328
How does it work? The indicator
FREE

Change All Timeframe – Instantly Sync Timeframes Across All MT4 Charts Effortlessly change the timeframe of all open charts in MT4 with a single action! The Change All Timeframes script saves time by ensuring all charts update simultaneously, streamlining multi-timeframe analysis. One-Click Timeframe Sync – Instantly change the timeframe on all open charts at once.
Save Time & Effort – No need to adjust each chart manually—boost your trading efficiency.
Seamless Multi-Timeframe Analysis –
FREE

Price Predictor is an indicator that shows precise price reversals taking into account a higher time frame and a lower time frame candle patterns calculations it is great for scalping and swing trading . Buy and sell arrows are shown on the chart as for entry signals. BIG Arrows indicates the trend - SMALL Arrows signal a trade (BUY/SELL) - A Green BIG UP Arrow with a support green line indicates a Bull Market : wait for buy signal - A Green SMALL Up Arrow after a BIG green arrow is

Here is the most unpretentious indicator to use, but one of the most useful. It signals the near reversal of the growing volatility. It is volatility that gives income to the trader. The indicator is especially useful for those who do not want to wait for the right moment in front of the monitor. The indicator is installed on the charts M15 and M30. According to the observations on these timeframes, it best fixes the approach of wide price waves. Well-established on the USDZAR currency pair (Att
FREE

Divergence Reader - индикатор который поможет Вам идентифицировать на графике дивергенцию и конвергенцию.
Настройки Type - выбор типа сигнала (дивергенция, конвергенция, оба сигнала); Minimum length of divergence (Candle) - минимальная длинна сигнала (в свечах); MACD SETTINGS - настройки индикатора МАСD; Важно! Индикатор не рисует графику на истории! Для визуальной проверки индикатора рекоммендую использовать тестер.
FREE

Sinn
Der SuPrEs-Indikator zeigt den Abstand zur nächsten horizontalen Linie an, deren Namen mit dem konfigurierten Präfix (siehe Optionen) beginnt. Verwendung
Zeichne Widerstände und Unterstützungen in den Chart und lasse Dich vom Indikator warnen, sobald ein konfigurierter Abstand unterschritten wird. Nutze den Präfix, um neben Standard-Linien auch Linien anderer Indikatoren mit einer Alarmfunktion zu versehen (siehe Screenshot mit Pivot-Indikator). Anzeige des Indikators
Der Indikator zeig
FREE

PLEASE HELP REVIEW/ SUPPORT/ SHARE THIS OTHER INDICATOR HERE https://www.mql5.com/en/market/product/51637 AS YOU DOWNLOAD THIS ONE FOR FREE. THANKS.
This Indicator is based on four moving averages and the PIVOT points. The indicator provides clarity to trading, especially in ranging markets when price is very slow and tight. You can trade intensively daily, every day with this indicator. You may decide to trade with this indicator alone and get the maximum out of the market. The indicator wa
FREE

POWERFUL CANDLE USES THE TREND WAVE INDICATOR AND IT CAN IDENTIFY THE BEGINNING AND THE END OF A NEW WAVE TREND MOVEMENT.
AS AN OSCILLATOR, THE INDICATOR IDENTIFIES THE OVERBOUGHT AND OVERSOLD ZONES.
IT WORKS GREAT TO CATCH THE SHORT TERM PRICE REVERSALS AND USES A MARTINGALE STRATEGY TO CLOSE ALL TRADES IN PROFIT.
USE DEFAULT SETTINGS ON H1 OR HIGHER TIME FRAME ON ANY PAIR FOR MORE ACCURATE TRADES
WHY THIS EA :
Smart entries calculated by 4 great strategies The EA can be run on even a $30
FREE

This indicator works by plotting fractals on the chart as arrows that can be used as buy or sell signals. It is a great tool for both new and experienced traders as it provides a clear visual representation of the market and helps traders identify fractals. Although it repaints, it can be used quite effectively in conjunction with other tools to filter trading strategies.
We use this indicator in this way in our RoyalFractals II Expert Advisor, which you can purchase on the MQL5 Market: https:
FREE

Fractals ST Patterns is a modification of Bill Williams' Fractals indicator. Unlike a standard Fractals indicator, Fractals ST Patterns allows setting any number of bars to find a fractal. This simple indicator corresponds to the parameters specified in the ST Patterns Strategy ( https://stpatterns.com/ ) . Structural Target patterns are the market itself, which is consistently divided into components. For the formation of ST Patterns , no trend lines, geometric proportions of the model itself,
FREE

The Moving Average Slope (MAS) subtracts the moving average level n-periods ago from the current moving average level. This way, the trend of the moving average can be drawn on the moving average line.
Features Observe uptrends and downtrends at a glance. The indicator is non-repainting. Returns buffer values for the trend of the moving average to be used as part of an EA. (see below)
Inputs Moving Average Period : The period of the moving average (MA). Slope Period : Number of periods between
FREE

Necessary for traders: tools and indicators Waves automatically calculate indicators, channel trend trading Perfect trend-wave automatic calculation channel calculation , MT4 Perfect trend-wave automatic calculation channel calculation , MT5 Local Trading copying Easy And Fast Copy , MT4 Easy And Fast Copy , MT5 Local Trading copying For DEMO Easy And Fast Copy , MT4 DEMO Easy And Fast Copy , MT5 DEMO
Can set the cycle for other varieties of K line graph covered this window, fluctuations obser
FREE

This indicator is designed to detect the best divergences between price/MACD and price/RSI. MACD and RSI produce by far the best divergence signals therefore this indicator focus on those two divergences. This is the FREE version of the indicator: https://www.mql5.com/en/market/product/28375
Important Information How you can maximize the potential of the scanner, please read here: www.mql5.com/en/blogs/post/718074
The free version works only on EURUSD and GBPUSD! This indicator scans for you u
FREE

The Buyside & Sellside Liquidity indicator aims to detect & highlight the first and arguably most important concept within the ICT trading methodology, Liquidity levels. SETTINGS
Liquidity Levels
Detection Length: Lookback period
Margin: Sets margin/sensitivity for a liquidity level detection
Liquidity Zones
Buyside Liquidity Zones: Enables display of the buyside liquidity zones.
Margin: Sets margin/sensitivity for the liquidity zone boundaries.
Color: Color option for buysid

CandleCrusherX Scalping EA analyses the market situation on volume and strong price movement within internal Timeframe. It works on all major forex pairs and Timeframes (M5 or M15 recommend). The EA has integrated dynamic Take Profit, this means, if you reach your defined TP it gives you the chance to follow on the Trend by dynamic TP & SL and extend your profits. Also a News Filter function is integrated, to prevent miss trades on News events. Dynamic Lot calculation integrated On Request we a
FREE

The indicator rely on The Toby strategy >> The mother candle which is bigger in range than the previous six candles.
A vertical line shows the last Toby Candle with the targets shown up and down. The strategy is about the closing price out of the range of the toby candle to reach the 3 targets..The most probable to be hit is target1 so ensure reserving your profits and managing your stop lose.
FREE
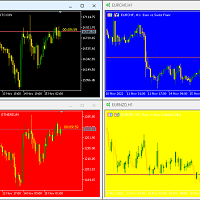
Hello again This is a free indicator that provides you with a panel at the corner of your chart to change your background. If you want to hide it, you should click on the minimize button above the buttons. Let me know what other free indicators you need! If those are easy I will make them for you ;) Many other tools are in the row. So wait and look! Hope to Enjoy it Sepehr (Faran)
FREE
Ist Ihnen bekannt, warum der MetaTrader Market die beste Plattform für den Verkauf von Handelsstrategien und technischer Indikatoren ist? Der Entwickler braucht sich nicht mit Werbung, Programmschutz und Abrechnung mit Kunden zu beschäftigen. Alles ist bereits erledigt.
Sie verpassen Handelsmöglichkeiten:
- Freie Handelsapplikationen
- Über 8.000 Signale zum Kopieren
- Wirtschaftsnachrichten für die Lage an den Finanzmärkte
Registrierung
Einloggen
Wenn Sie kein Benutzerkonto haben, registrieren Sie sich
Erlauben Sie die Verwendung von Cookies, um sich auf der Website MQL5.com anzumelden.
Bitte aktivieren Sie die notwendige Einstellung in Ihrem Browser, da Sie sich sonst nicht einloggen können.