Technische Indikatoren für den MetaTrader 4 - 132
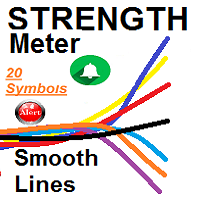
SMOOTH STRENGTH METER INDICATOR (SMOOTH LINE) it draws Currencies TREND Volatility Power / Strength lines : - Detects the 2 highly TRENDED Volatile pairs ( will be the Bold Lines ) - A very Helpful Indicator - It draws smooth lines for up to 20 currencies pairs representing Volatility strength and power - First it indicates the most powerful trended direction pairs : Strongest / Weaker - MAIN FUNCTION :it gives indication of the UP trend most Volatile Line and the

Der Sea Candles MT4-Signalhandelsindikator bestimmt die Richtung der Kursbewegung mit dem CCI-Oszillator und erzeugt Signale zur Eröffnung einer Position. Rohstoffkanalindex [CCI] - misst die Abweichung des Preises von seinem gleitenden Durchschnitt. Eine Divergenz tritt auf, wenn der Preis ein neues Hoch erreicht und der CCI nicht über die vorherigen Hochs steigen kann. Auf diese klassische Divergenz folgt normalerweise eine Preiskorrektur. Der CCI liegt normalerweise im Bereich von ±100. Wert

The GGP Wave Trend Oscillator MT4 Indicator is a volatility and momentum tool designed to help traders optimize their trading performance and providing traders find the most accurate market reversals. This indicator is MT4 conversion of the Indicator: WaveTrend Oscillator [WT] by “ LazyBear “ in Trading View website and some alert methods are added to provide real-time alerts when a trading signal is generated, in order to allow traders to act quickly and efficiently. When the oscillator is ab

Forex-Indikator Advanced Scalper MT4 ist eine Formel, die auf dem Scalping-Handel basiert, ebenso auf überverkauften und überkauften Niveaus. Der Indikator funktioniert auf allen Währungspaaren,
kryptowährungen, Aktien, Indizes. Ein universeller Indikator, der an Ihre Bedürfnisse angepasst werden kann und in jeder Handelsstrategie nie überflüssig sein wird.
INFORMATIONEN ZUM INDIKATOR Der Forex-Indikator Advanced Scalper MT4 wird als Farbbalkendiagramm dargestellt, das die Augen nicht sch

Std Channels The Std Channels Indicator is a technical indicator that uses standard deviation to create five channels around a price chart. The channels are used to identify support and resistance levels, as well as trends and reversals. The indicator is calculated by first calculating the standard deviation of the price data over a specified period of time. The channels are then created by adding and subtracting the standard deviation from the price data. The five channels are as follows: Upper

The Forex Smart System is a user-friendly and intuitive trading solution designed to empower traders in the complex world of forex trading. With a focus on simplicity and practicality, this system offers a streamlined approach that makes it accessible to traders of all experience levels. User-Friendly Interface: The Forex Smart system is designed with simplicity in mind, making it accessible to traders of all experience levels. Its intuitive interface ensures that users can focus on trading rath
Support Resistance Tracking Indicator The Support Resistance Tracking Indicator is a technical analysis tool that helps traders identify and track support and resistance levels. It is a valuable tool for traders of all levels, from beginners to experienced professionals. How it works The Support Resistance Tracking Indicator uses a variety of methods to identify support and resistance levels. These methods include: Historical price action: The indicator looks for price levels where the market

Auto Channel Trend The Auto Channel Trend Indicator is a technical analysis tool that automatically draws trend channels on any chart. It uses a simple algorithm to identify the trend direction and then draws two parallel lines that represent the support and resistance levels of the channel. Features: Automatic trend channel drawing Support and resistance levels Trend direction identification Customizable parameters How to use: Add the indicator to your chart. Adjust the parameters to your likin
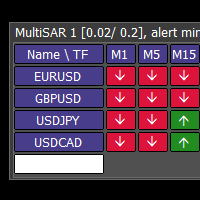
This tool monitors Parabolic SAR indicators on all time frames in the selected markets. Displays a table with signals to open a BUY trade (green) or SELL trade (red). You can easily add or delete market names / symbols. If the conditions for opening a trade on multiple time frames are met, you can be notified by e-mail or phone message (according to the settings in MT4 menu Tools - Options…) You can also set the conditions for sending notifications. The list of symbols/ markets you have entered
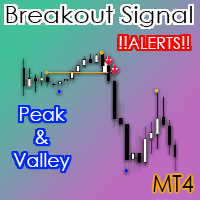
The valley and peak indicator strategy used in forex is a technical analysis approach that aims to identify potential trend reversals in the market. The strategy is based on identifying peaks and valleys in the price chart, which are points where the price reaches a high or low and then reverses direction. The valley and peak indicator is a tool that helps traders identify these patterns and generate buy and sell signals based on them. Here are the key steps involved in using the valley and pea
Welcome to the world of advanced trading with the Bollinger Bands Scanner! Maximize your trading potential with our powerful MT4 indicator designed for seamless analysis and real-time insights. Key Features: Effortless Bollinger Bands Scanning: Unlock the full potential of the Bollinger Bands Scanner by effortlessly scanning multiple assets. Receive instant alerts when specific Bollinger Bands conditions are met, ensuring you stay ahead of market movements. Comprehensive Dashboard Insights: Gai
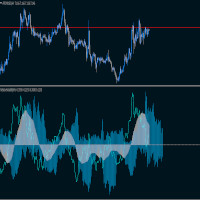
The indicator shows the deviation of the moving average relative to the volatility leading half of its period.
The red histogram shows the moving average relative to the anchor point.
The blue histogram shows volatility relative to the leading half
of the moving average.
The blue line simulates the price relative to the moving average.
The indicator is perfect for both grid trading and trend trading.
The signal does not change when the timeframe changes
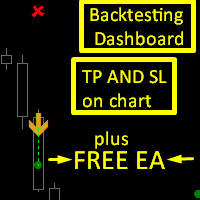
Ambitious Donchian EA can be downloaded from comment section but it need the ambitious donchian indicator to work.
Ambitious Donchian is a Donchian Channel and XO histogram based indicator that gives buy and sell signals in form of up and down arrows with tp and sl as objects on chart.
features :
1. Tp and Sl for each signal , the tp and sl can be selected as based on points or ATR value from indicator settings.
2.backtesting dashboard : the dashboard shows the following according to your i

The Flip Flop indicator tracks market trends, ignoring sharp fluctuations and market noise. The indicator can work both for entry points and as a filter.
The Flip Flop indicator displays information in a visual way. Helps in finding entry points during analysis. Suitable for trading on small time frames because it ignores sudden price spikes or corrections in price movements by reducing market noise around the average price.

Trend Channel is a Forex trend arrow indicator for identifying potential entry points. I like it, first of all, because it has a simple operating mechanism, adaptation to all time periods and trading tactics. Created based on a regression channel with filters. We display the signals of the Trend Channel indicator on the price function chart using a mathematical approach.
How it works: when the price breaks through the overbought/oversold zone (channel levels), a buy or sell signal is generate

Der MT4 Wave Wold Forex Indikator wurde entwickelt, um Wulff-Wellen zu finden und sie im aktuellen Fenster des Handelsterminals anzuzeigen. Ein ausgezeichneter Indikator für Händler, die Wulff-Wellen im Handel verwenden. Seine Anwendung in Handelsstrategien wird ihre Effizienz und Rentabilität erheblich verbessern.
INFORMATIONEN ZUM INDIKATOR Im Gegensatz zu anderen Wolfswellenindikatoren hat der MT4 Wave Wold Forex Indikator eine Reihe von Funktionen, die seine Effizienz erheblich verbessern

The "Angel Algo" indicator, designed for the TradingView platform, is a powerful technical analysis tool that assists traders in identifying dynamic support and resistance levels in real-time. It provides valuable insights into potential breakout points and market regimes.
At its core, the "Angel Algo" indicator utilizes a rolling window of price data to calculate maximum and minimum price levels. It then dynamically identifies support and resistance levels by examining specific conditions re

Trend analysis is perhaps the most important area of technical analysis and is the key to determining the overall direction of an instrument's movement. The Quest Trend indicator determines the prevailing trend. They help analyze the market on a selected time interval. Trends are based on the principle of higher highs, higher lows (for an uptrend) and lower highs, lower lows (for a downtrend). They can have different time periods and they can be related to each other like fractals. For example,

Supreme Arrow ist ein Pfeilindikator für MT4, der auf der RSI- und Demarker-Indikatorstrategie basiert.
Die Strategie eignet sich für Trendmärkte, funktioniert aber auch in Ranging-Märkten, insbesondere wenn sie zum Scalping verwendet wird
Empfohlener Zeitrahmen: beliebig
Empfohlene Add-ons: 200 SMA
Der Supreme Arrow-Indikator wird nicht neu oder rücklackiert und das Signal wird nicht verzögert

Mit diesem Tool können Sie einige nützliche Daten in einer CSV Datei erstellen.
Sie können: - Timeframe bestimmen
- die Anzahl der Kerzen, die geladen werden sollen
- Datei beliebig benennen
- Weitere Datensätze auswählen, die geladen werden sollen Folgende Daten werden in einer CSV Datei geschrieben. - Zeit, wann die Kerze erstellt wurde.
- Open Preis
- Close Preis
- High Preis
- Low Preis
Des Weiteren steht Ihnen folgende Auswahl zur Verfügung:
- Volumen
- RSI (sie können auch
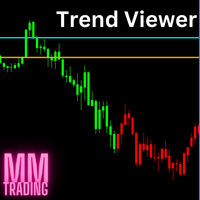
Dieser Indikator verändert die Farbe des Charts, wenn die Preise eher bullisch oder bärisch sind. Es wird empfohlen, diesen Indikator auf kleinen Zeiteinheiten zu nutzen und nur in den Haupthandelszeiten. Und vergessen Sie nicht ihre Stopps. Das ist kein Orakel und kein heiliger Gral.
In den Einstellungen können Sie die Farbe der Kerzen verändern und auch deren Sentiment. Nutzen Sie dazu die Set 1 und Set 2 Einstellungen und testen Sie etwas.
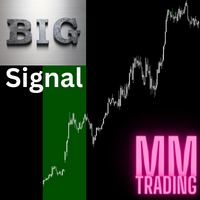
Dies ist ein Multi-Timeframe-Indikator, der Daten aus mehreren Zeitrahmen sammelt. Es versucht, den Trend zu erkennen und einen Pullback vorherzusagen. Sie müssen verstehen, dass Trends plötzlich auftauchen und sich der Pullback in einen neuen Trend verwandelt. Dies ist kein heiliger Gral. Denken Sie immer an Ihren Stop-Loss. Nutzen Sie diesen Indikator als Ergänzung zu Ihrer bestehenden Strategie.
Die im Chart angezeigten Linien können so verändert werden, dass sie nur im Indikatorfenster ang
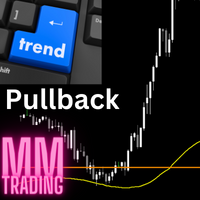
Dieser Indikator ist kein gewöhnlicher moving avarage, auch wenn er sich ähnlich verhält. Ich nutze diesen sehr gerne, um Pullbacks zu identifizieren.
Ich nutze diese Strategie nur ein mal täglich für ein Instrument, nicht öfter.
Am besten ist es, wenn der Preis schon am vormittag weiter weg von der Linie ist und wenn der Pullback erfolgt, dann kann man mithilfe von diesem Indikator ein Entry Setup erstellen.
Nutzen Sie weitere Indikatoren, oder verwenden Sie diesen als Ergänzung bei Ihrer be
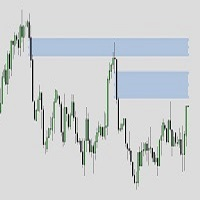
ICT Fair value gapes / Balanced price ranges it marks the fvgs i.e., bisi and sibi both filled and unfilled based on your requirements. it can work on mtf while your on any other time frame i.e., seeing on 5 min. you can watch from filled (BPRs) to unfilled (imbalances) of monthly/weekly/daily/H4/H1 to your likings It can be using multiple times using unique ID with buttons option to on and off the required TF or keeping them all.
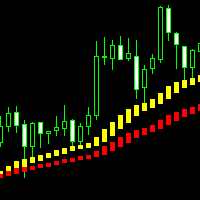
这是 一款可以直观识别波段趋势的分析指标,手工交易最佳选择,不重绘不漂移。 适应任何新手和量化交易的朋友。 参数设置(您购买指标后若不知道如何使用,请私信我): 快线: g_period_88 20
慢线: g_period_88 40
===========交易信号 ===========
快线:黄/蓝线;慢线:红/绿线 多头方向:快线上穿慢线,快线在慢线上方 空头方向:快线下穿慢线,快线在慢线下方
做多信号: 当快线上穿慢线形成一轮多头方向时,首轮多单进场条件为出现两根以上连续阴线,第3根以上K线出现一根阳线,且收盘价格在慢线上方,慢线为红线,即可成交第一单多单,同时如果满足价格回踩触碰到快线,出现一条阳线,且收盘价格在慢线上方,慢线为红线时,也可成交第一单多单;当第一轮多单结束后,此轮多头方向的多单只能满足价格回踩触碰到快线后,出现一条阳线收盘价格在慢线上方,慢线为红线时,才可继续做多进场,即不管快线是黄线或蓝线,只要阳线收盘价格在慢线上方,慢线为红线时就可以做多进场;当快线在慢线上方,阳线收盘价格在慢线上方,但慢线为绿线时,则不进场
做空信号: 当快线下穿

The indicator is the advanced form of the MetaTrader 4 standard Fibonacci tool. It is unique and very reasonable for serious Fibonacci traders.
Key Features
Drawing of Fibonacci retracement and expansion levels in a few seconds by using hotkeys. Auto adjusting of retracement levels once the market makes new highs/lows. Ability to edit/remove any retracement & expansion levels on chart. Auto snap to exact high and low of bars while plotting on chart. Getting very clear charts even though man
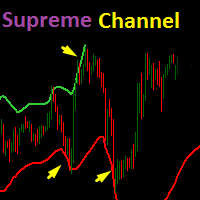
Basierend auf dem TV-ATR-Kanalindikator ist der Supreme-Channel-Indikator ein dynamisches Unterstützungs- und Widerstandsband, das dem Händler einen Hinweis auf eine mögliche Umkehr des aktuellen Trends gibt.
Empfohlener Zeitrahmen: 15 Mio. und mehr
Empfohlene Einstellungen: Standard, aber der Händler kann bei Bedarf Änderungen vornehmen.
Parameter:
1. Kanallänge
2. Bandbreite (der Abstand zwischen den beiden Kanalleitungen)
3.Multiplikator (ATR-Wertmultiplikator)
4. Kanal anzeige
Supreme Diamond ist ein Multi-Time-Frame-Indikator, der auf Umkehr- und Trendhandelsstrategien basiert. Der Indikator wird nicht neu oder zurückgemalt und die Signale werden nicht verzögert. Der Indikator gibt Kauf- und Verkaufssignale mit Warnung aus.
Der Indikator verfügt über zwei Signalmodi, aus denen ausgewählt werden kann (bester Eintrag als Rauten verwenden). Wenn er auf „True“ eingestellt ist, filtert der Indikator die Signale im Normalmodus und gibt das bestmögliche als Rautensignal a
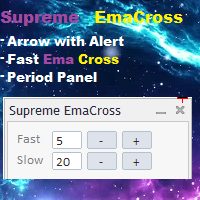
Supreme EmaCross ist ein Indikator, der auf dem Kreuzen zweier exponentieller gleitender Durchschnitte basiert. Er generiert Kauf- und Verkaufspfeile auf der Grundlage des Kreuzens von EMA und gibt beim Erscheinen eines Signals eine Warnung aus Ema-Zeitraum-Änderungspanel, in dem der Händler die Ema-Werte ändern kann, ohne zu den Indikatoreinstellungen zu gehen. Das Panel ist beweglich.
=============================================== ====
Parameter:
schnelle Perioden: schnelle EMA-Periode
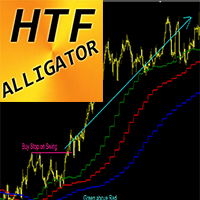
Forex Indicator Alligator H igher Time Frame for MT4 Alligator indicator is one of the most powerful trend indicators. H TF means - H igher Time Frame This indicator is excellent for Trend Traders as well as combination with Price Action entries. HTF Alligator Indicator allows you to attach Alligator from Higher time frame to your current chart. Consider Buy entries only when Green line is above Red one & Red is above Blue - arrange Buy Stop pending order on maximum of latest
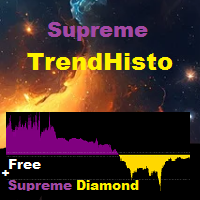
Supreme TrendHisto ist ein Trendindikator, der Abwärts- und Aufwärtstrendsignale liefert. Der Indikator fungiert als Histogramm, der Indikator wird nicht neu gezeichnet/gemalt/verzögert.
Strategie
Kaufhandel: Histogramm kreuzt über 0,65, wir eröffnen Kaufhandel, was den Ausstieg betrifft, können Sie entweder aussteigen, wenn das Histogramm den Wert von 0,70 erreicht, oder bei gutem Ausstieg.
Verkaufshandel: Histogramm kreuzt unter -0,65, wir eröffnen Kaufhandel, was den Ausstieg betrifft,
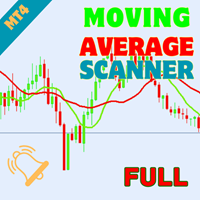
Welcome to the world of advanced trading with the Moving Average Crossover Multicurrency Scanner! Elevate your trading experience with our powerful MT4 indicator designed for seamless analysis and real-time insights. Key Features: Effortless Moving Average Crossover Scanning: Unlock the full potential of the Moving Average Crossover Multicurrency Scanner by effortlessly scanning multiple currency pairs. Receive instant alerts when specific Moving Average Crossover conditions are met, ensuring y
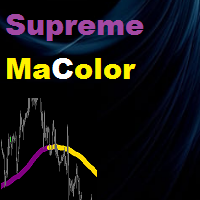
Supreme MaColor is an indicator based on moving average indicator , it gives up and down trend colors and it has different moving averages types and has multi time frame function , this indicator does not repaint/back-paint/delay signal. =================================================================================== Parameters : Timeframe (what time frame to use to draw Supreme Ma) Ma Period Ma Type Ma Price (close/open...etc) Average Shift (Ma shift) Multi Time frame on/off ===============
The presented indicator is based on a fast digital filter (RFTL) with the help of which a short-term trend is predicted. This product marks trend reversal points and support/resistance lines. The indicator has six calculation options: 1. Identifies the closing price leaving the channel; 2. Identifies the exit/entry of the closing price outside the channel; 3. Identifies the closing price leaving the channel and sideways price movement; 4. Identifies the average price going beyond the channel; 5.
The presented indicator is based on a slow digital filter (RSTL) with the help of which a long-term trend is predicted. This product marks trend reversal points and support/resistance lines. The indicator has six calculation options: 1. Identifies the closing price leaving the channel; 2. Identifies the exit/entry of the closing price outside the channel; 3. Identifies the closing price leaving the channel and sideways price movement; 4. Identifies the average price going beyond the channel; 5.
Supreme MaChannel is an indicator based on moving averages , the indicator gives dynamic support and resistance in bands format. Recommended for reversal traders , add it to your reversal strategy. Parameters : Supreme MA Period : ma periods Supreme MA Price : close/open/high/low..etc Supreme MA Type : Simple/Exponential/Smoothed/Linear Weighted Deviation : bands deviation the distance between the two band lines
Supreme Entry is an arrow signal based indicator that give buy and sell signals , the indicator gives buy/sell signals with alert on candle open/close (depends what you set it to be from inputs) . this indicator does not repaint/back-paint and signal is not delayed. Strategy : Open buy same moment buy arrow appear and open sell same moment a sell arrow appear , close on well or on opposite signal . Recommended Time frame : 15 and above this arrow is good as ? : addon to your existing strategy ,

The Datasource AC indicator is a technical analysis tool developed by the author based on the Accelerator Oscillator. Everyone knows the general principles of working with the AC indicator. Therefore, I will not describe them separately. I will focus on differences.
Differences are a purely technical implementation and expanded indicator. An important feature is that the indicator does not change its values even when using the closing price, since the indicator uses the safe calculation a
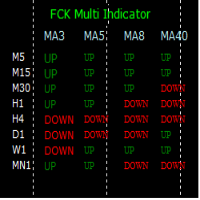
The FCK Multi Indicator for MT4 displays trend direction of multiple indicators on multiple time frames for a pair. So, forex traders can see the trend direction at a snap and trade with confluence of multiple indicators. Furthermore, it helps traders to see the trend in multiple time frames and trade in the direction of the overall market trend. Additionally, it shows the stop loss, pips to stop, pips in profit of any open position. The indicator display is very neat and is very helpful for bot
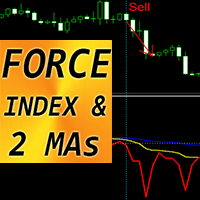
Forex Indicator "FORCE index and 2 Moving Averages" for MT4 This indicator is excellent for Momentum trading into the trend direction. " FORCE index and 2 Moving Averages" Indicator allows you to see Fast and Slow Moving Averages of Force index Force index is one of the top indicators that combines price and volume data into a single value Force index itself is powerful oscillator - that measures the amount of power used to move the price Indicator gives opportunities to see the t
STOCH ARROW is a long short arrow signal type indicator that is based on standard stochastic oscillator this indicator has 3 methods of giving long and short signal that are as follow : 1.whenever stochastic lines cross 2.when a cross happens in overbought and oversold zones (short arrow on overbought zone cross , long arrow on oversold zone cross) 3.when stochastic lines leave overbought and oversold zones (short arrow on leave from overbought zone , long arrow leave on oversold zone) this ind
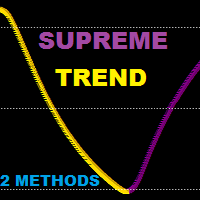
Supreme Trend is a reversal/continuation type Oscillator type indicator that is based on Moving average and stochastic indicators this indicator can be used in two methods : Reversal Method : short when golden arrow appear after arrows were above upper level (e.g 70) Reversal Method : long when Purple arrow appear after arrows were below lower level (e.g 30) Trend Method : long when arrows cross above 50 level line , short when arrows cross below 50 level line. use higher ma and stochastic peri
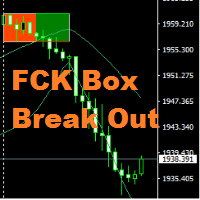
Hi All, " FCK Box Break Out " indicator is very simple indicator for new users. You can choose which indicators and timeframes you want to calculate. "FCK Box Break Out" provides the day's trend for buy/sell trades. Opposite side you the stop loss or hedging trade. NON-REPAINT Buy/Sell signals Recommendations Timeframes: Recommended - H 1 (Still, EA technically works on any Time frames ) Spread : up to 20 Recommended pairs: works on any metal, indices and currency pair

ICT Kill zone and Macros Indicator mark and display the following zone times on the chart: Kill zones Kill zone Forex Asian
London Open New York Open London Close Central Bank Dealing range
Kill zone Indices Asian London Open New York AM New York Lunch New York PM Power Hour
Macros London 1 London 2 New York Am 1 New York AM 2 New York Lunch New York PM 1 New York PM 2
Silver bullet London Open New York AM New York PM
Sessions Asian London New York
Chart The display of Kill zone ,

"Daotradingfx - Der perfekte Schlüssel für Wellenhandel mit 7 Jahren Erfahrung"
Der Devisenhandel ist niemals einfach, aber mit dem Daotradingfx-Indikator habe ich einen zuverlässigen Partner gefunden, der die Tür zum Erfolg im Wellenhandel öffnet. Dieser Indikator wurde auf der Grundlage meiner 7-jährigen Handelserfahrung entwickelt und ist nicht nur ein Werkzeug, sondern eine umfassende Darstellung des Marktverständnisses und der Benutzerfreundlichkeit beim Handeln.
Daotradingfx sticht d
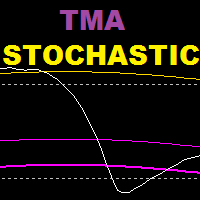
TMA Stochastic ist ein Indikator, der auf einem stochastischen Oszillator und einem TMA-Band-Indikator basiert. Dieser Indikator basiert auf einer Umkehrstrategie.
Empfohlener Zeitrahmen: 15 und älter
Empfohlene Einstellungen: niedrigere Werte für Scalping, höhere Werte für Swing Trading
=============================================== =====================
Parameter:
TMA-Verlauf: Wie viele Balken zurück, um TMA-Bänder auf der Stochastik anzuzeigen
K-Periode (Stochastik)
D-Periode

Das Ziel des "Black Horse"-Indikators besteht darin, Abweichungen zwischen der Preisentwicklung und dem VWAP-Indikator zu identifizieren. Er verwendet Filter, um potenziell falsche Abweichungen herauszufiltern und hochwertige, genaue Warnungen zu generieren.
Bearish-Abweichungen werden durch rote Punkte über der Kerze dargestellt, während Bullish-Abweichungen durch grüne Punkte unter der Kerze repräsentiert werden.
Der Hauptfilter für Abweichungen basiert auf dem ATR (Durchschnittliche Wahr
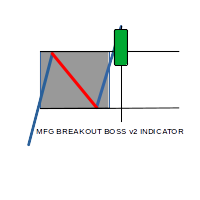
MFG breakout boss indicator is a Semi Autom ated Asian session range breakout System which seeks to identify the High and low of the asian session when the Market is ranging with no major movement, With the help of sofisticated Algorithm within the system, a breakout in either direction coupled with momentum the system gives High Accurate entries, with predefined Stop loss and 3 Take profit levels.
Elevate your trading with the JagzFX Market Regime Filter—adapt, optimize, succeed in navigating through smooth or volatile price movements. Gain a deeper understanding of market dynamics to refine your strategy and make informed decisions. KEY FEATURES Price Action Analysis: Distinguishes between smooth and volatile price movements. Trend Identification: Pinpoints bullish or bearish trends with precision. Strength Assessment : Evaluates the strength of identified trends—whether strong or weak M
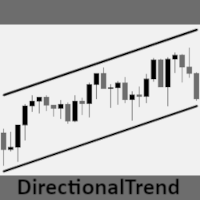
Der DirectionalTrend-Handelsindikator ist ein innovatives Instrument, das einen klaren und genauen Überblick über die Entwicklung des Finanzmarktes bietet. Auf der Grundlage historischer Marktdaten identifiziert und zeigt dieser Indikator die allgemeine Richtung an, in die sich der Markt über einen bestimmten Zeitraum bewegt. Sein Hauptziel ist es, Händlern zu helfen, fundierte Entscheidungen zu treffen, indem er klare Signale über den vorherrschenden Trend auf dem Markt liefert. Dank seiner in

Доброго времени суток уважаемые трейдеры и инвесторы.
Вашему вниманию предлагается индикатор, определяющий за любой промежуток времени : Максимальную цену. Минимальную цену. 50 % от от максимума до минимума. Цену закрытия периода. Кроме того, в зависимости от настроек - индикатор может добавлять 10 процентных уровней как вниз, так и вверх, эти уровни указываются, но по стандарту начинаются от 50% с шагом 50% до 500%. В обе стороны. Индикатор реализован максимально удобно, при смене тайм-фрейма

The Waddah Attar Explosion (WAE) indicator is a potent tool in Forex trading, offering buy, sell, exit buy, and exit sell signals. It assesses trends as trend power and momentum as explosion power.
Trend Direction: - Green bars indicate a bullish trend. - Red bars indicate a bearish trend.
Signal Line: - A line serves as a threshold for momentum.
Buy Trade Setup: **Entry:** Go long when a green bar crosses above the threshold. Place a stop loss below the entry candle. **Exit:** Close the

In MetaTrader, TP & SL values aren't visible when hovering over corresponding lines. Our indicator fixes this by showing values on-screen. It displays defined SL and TP values in your account currency, facilitating easy tracking of positions. Note : The indicator estimates values, excluding commissions, and allows customization of colors and distance from SL/TP lines.
SURE REVERSAL is a histogram overbought/oversold type indicator that gives key reversal points that indicates a bull or bear market movment this indicator is fusion between moving average and the rsi indicator ,this indicator is non repainter , and is not delayed . Parameters : Ma period Ma Method Ma Price Sure Period (Rsi) Sure Price (Rsi) ==============

„Trend Reversal ml4“ ist ein einzigartiger Indikator, der die Momente der Preisumkehr in Echtzeit bestimmen soll. Dies ist ein fertiges Handelssystem für Metatrader4. Der Indikator zeichnet seine Werte nicht neu! Basierend auf fortschrittlichen Algorithmen und technischer Analyse liefert Ihnen dieser Indikator klare Signale über mögliche Markteintritts- und -austrittspunkte und hilft Ihnen, fundierte Entscheidungen zu treffen.
Vorteile des Indikators: hohe Signalgenauigkeit. Der Indikator sel

SX Currency Strength indicator allows users to analyze currency strength through a selected period, with results resetting periodically and accumulating thereafter. It displays the historical relative strength of eight major currencies (USD, EUR, GBP, JPY, AUD, CHF, CAD and NZD) across a selected timeframe. Assessing a currency's relative strength aids in evaluating its performance against a basket of other currencies. Users can select to visualize relative strength of the currencies in the shap

Der Preis wird um 30 US-Dollar steigen, nachdem jeweils 5 Exemplare verkauft wurden. Der Hauptindikator zielt darauf ab, den allgemeinen Markttrend zu bestimmen. Das Farbsystem mit hellen und dunklen Farben soll starke und schwache Marktbedingungen identifizieren.
Meiner Meinung nach ist dieser Indikator unübertroffen; er funktioniert besonders gut, wenn sich der Markt zu bewegen beginnt.
Wenn Sie den Indikator für einen längeren Zeitrahmen verwenden möchten, beispielsweise 1 Stunde, 4 Stun

TREND HARMONY MT4 – Multi Timeframe Trend and Phase and Pullback Level Visualizer indicator for Metatrader4 The TREND HARMONY indicator automates deep trend analysis and generates visualizations for you. Take control of your trades by eliminating uncertainty! Revolutionize your trading experience with precision and insight through the TREND HARMONY Multi Timeframe Trend Indicator – your ultimate MT4 trend visualization indicator. Are you tired of missing trading opportunities or consistently e

Pivot, support and resistance levels are one of the main indicators on the charts of any professional trader. The PivotPointsMT4 indicator will help you determine the current entry points on any currency pair and any timeframe. It is convenient because it shows historical pivot, support and resistance levels on all timeframes, and you always see what worked in the recent past. Taking into account the news context, most often it is not so difficult to determine the current level and right entry

This trend reversal arrow indicator has an alert signal that is a valuable tool for forex traders, providing several advantages that contribute to making more informed trading decisions and potentially increasing profits. Here are some advantages: Early Identification of Reversals: The primary advantage is the early identification of potential trend reversals. This arrow indicator can visually signal when a trend may be losing momentum or about to reverse, allowing traders to be proactive rather
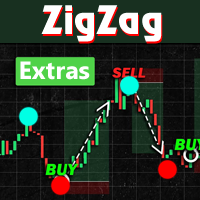
Introducing ZigZag Extras MT4, a Forex indicator that simplifies market analysis:
- Visualizes highest highs and lowest lows over a specified "Depth" period. - Highlights potential reversal points with filled blue and red dots. - Optional display of BreakOut points, indicating probable peaks and bottoms. - Helps avoid common pitfalls of mistaking repainted points for market tops or bottoms. - Designed to enhance understanding and serve as signals for various trading strategies.
Instructions
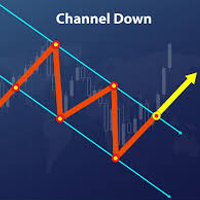
Trend channels are vital tools in technical analysis for identifying optimal buy or sell points. - Upper Line: Marks resistance. - Lower Line: Marks support. - Tops and bottoms of channels indicate potential support or resistance zones. - Bearish Channels: Negative slope (down). - Bullish Channels: Positive slope (up). Creating Channels: - Up Channel: Draw a parallel line matching the uptrend angle, touching the latest peak. - Down Channel: Draw a parallel line ma

ASR (Accurate Support Resistance) Indicator Uniqe formula behind this indicator makes it one the world's best support resistance indicator. watch the tutorial video
It is user-friendly and here are some key features : -- different calculations for swing traders and scalpers. -- the lower the accuracy number the further the lines distance is. --easily applicable on all charts. ( try to find the best accuracy number ) recommended accuracy number for Gold is 5or 6, for eurusd 6 or 7. other instru

Exclusive Arrival: Presenting for the First Time . This is your secret weapon for predicting which way the wind will blow with the next market shift. It assists you in developing your trading strategy by predicting the direction of the next candle. Compatible with forex, stocks, and cryptocurrencies on all timeframes, but higher timeframes are recommended. MT5 Version - https://www.mql5.com/en/market/product/108937/ How does it work ? It's pretty neat. The algorithm separates green and red can

What are Heiken Ashi Candles?
Heiken Ashi, derived from the Japanese term 'Heikin Ashi,' translates to average price bars. It's an indicator depicting price bars on a chart.
Formula for Heiken Ashi candles:
- Heiken Ashi opening price: (previous candle's opening + closing price) / 2 - Closing price Heiken Ashi: (opening + high + low + closing) / 4 - Heiken Ashi peak: Max of high, opening, or closing price - Heiken Ashi bottom price: Min of low, opening, or closing price
How to Read Heik

The MT4 Channel Standard Deviation Indicator automatically plots support and resistance channels on the price chart using price standard deviation. It indicates BULLISH and BEARISH market conditions and is suitable for both new and advanced forex traders.
This indicator offers support, resistance, entry, and exit levels, along with stop-loss and take-profit points. It accurately identifies BULLISH and BEARISH market trends, making it effective for both intraday and long-term trading across va
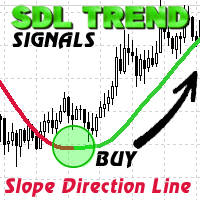
SDL Trend Signals is a custom MQL4 indicator named "Slope Direction Line" for MetaTrader 4. It employs weighted and simple moving averages to create customizable trend lines on charts.
Using two trend line buffers (Uptrend and Downtrend) and one for indicator values (ExtMapBuffer), the indicator calculates trend lines. Bullish slopes appear in BLUE, signaling an upward trend, while Bearish slopes are in RED, indicating a downward trend.
In a Bullish trend, traders can enter a BUY position w
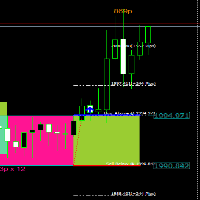
Hi All, " FCK Support Resistance BreakOut " indicator is very simple indicator for new users. You can choose which indicators and timeframes you want to calculate. " FCK Support Resistance BreakOut" that gives NON-REPAINT Buy/Sell signals "FCK Support Resistance BreakOut" provides the trend for buy/sell trades. Opposite side you the stop loss or hedging trade. * - Draws Dynamic S/R Boxes based on consolidation areas; * - consolidation areas are defined by a minimum period of time during whi

This indicator cuts right through the price, in a straight line
100% non repaint, you get a new value at the opening of each new bar
It is perfect for mean reversal strategies : open far from the line and close when the price touches the line It works really well for mean reverting pairs specially (CHF, NZD).
It has absolutely no lag when there is a sudden move up or down and follows trend exactly !
This indicator should be a must have tool in the toolbox of every trader
Der Indikator für Forex und Binäre Optionen basiert auf 2 Standardindikatoren in MT4: ADX und RVI.
Die Signale werden bei gleichzeitigen Schnittpunkten der Linien beider Indikatoren empfangen. Aber auch die Umkehrung der Signale ist in den Codes vorgeschrieben. Dies ist, wenn die Signale in die entgegengesetzte Richtung umgewandelt werden. Sie können auch die einzelnen Indikatoren ein- und ausschalten. Und auch im RVI können 2 Arten von Signalen verwendet werden: 1) Einfach wenn eine Linie hö
MetaTrader Market - der einzige Shop, in dem man Handelsroboter als Demoversion herunterladen und testen sowie anhand historischer Daten optimieren kann.
Lesen Sie die Beschreibung und Bewertungen anderer Kunden über das gewünschte Produkt, laden Sie es direkt ins Terminal herunter und erfahren Sie, wie man einen Handelsroboter vor dem Kauf testet. Nur bei uns können Sie ein Programm testen, ohne dafür zu bezahlen.
Sie verpassen Handelsmöglichkeiten:
- Freie Handelsapplikationen
- Über 8.000 Signale zum Kopieren
- Wirtschaftsnachrichten für die Lage an den Finanzmärkte
Registrierung
Einloggen
Wenn Sie kein Benutzerkonto haben, registrieren Sie sich
Erlauben Sie die Verwendung von Cookies, um sich auf der Website MQL5.com anzumelden.
Bitte aktivieren Sie die notwendige Einstellung in Ihrem Browser, da Sie sich sonst nicht einloggen können.