适用于MetaTrader 5的新EA交易和指标 - 169
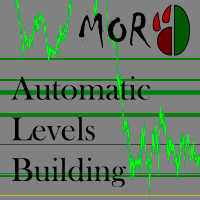
This indicator is designed to automatically build support/resistance levels. The indicator calculates the density of the price distribution in the specified time range and creates a table of volumes for each price. Levels are constructed from the minimum to the maximum volumes specified by the user. Some input parameters can be changed using hot keys without opening the settings window.
Inputs StartPoint - start bar number Range - length of the level in bars (time range) VolumeMin - minimum vo
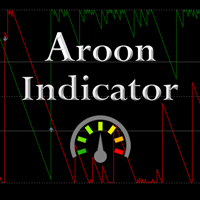
The Aroon Indicator is a technical indicator showing whether a price is trending, the strength of the trend, and whether any reversal of trend or range-trading is likely. The indicator consists of two lines, the Aroon Bullish Line and the Aroon Bearish Line. The Bullish Line is calculated as (bars in period - bars since highest high in period)/bars in period, expressed as a percentage. The bearish line is calculated similarly since the lowest low. Both are plotted on the same chart. Thus, both l

The TickDelta indicator shows the difference in the number of oscillations of the best prices per unit of time. In this case, the unit of time is the specified timeframe (M1, M2, M5, M15, etc.). This value indirectly shows the market "sentiment". Due to the "tick-wise" nature, the indicator is more appropriate for use in scalping strategies. When applied in conjunction with real volumes and monitoring of various instrument charts, it is possible to identify certain reversal setups. In some cases

Hamster Scalping 是一个完全自动化的交易顾问,不使用鞅。夜间剥头皮策略。 RSI 指标和 ATR 过滤器用作输入。顾问需要对冲账户类型。
可以在此处找到对实际工作以及我的其他发展的监控: https://www.mql5.com/en/users/mechanic/seller
一般建议
最低入金 100 美元,使用点差最小的 ECN 账户,默认设置为 eurusd M5 gmt + 3。
输入参数
EA 适用于四位数和五位数报价。在输入参数中,我们以点为单位表示5个字符的值,它会自动按4个字符重新计算所有内容。
NewCycle - 模式开启时,顾问工作不停止,模式关闭时,完成一系列交易后,顾问不会开新订单; 周期指标1 - 第一个指标的周期; Up level - 第一个指标的上限,顾问将在其上方打开卖出; Down Level - 第一个指标的较低水平,低于该水平 EA 将开始买入; Period indicator2 - 第二个指标的周期; From - 第二个指标值范围的下限,EA 允许在该范围内建仓; To - 第二个指标值范围的上

相对强弱指数 (RSI) 指标的多货币和多时间框架修改。 您可以在参数中指定任何所需的货币和时间范围。 此外,该面板还可以在跨越超买和超卖水平时发送通知。 通过单击带有句点的单元格,将打开该符号和句点。 这是 MTF 扫描仪。
默认情况下,从图表中隐藏仪表板的键是“D”。
与货币强度计类似,仪表板可以自动选择包含指定货币的货币对,或以该货币为基础货币的货币对。该指标在“货币对集合”中指定的所有货币对中搜索货币;其他货币对将被忽略。并根据这些货币对计算该货币的总 RSI。您可以看到该货币的强弱程度。
参数 RSI Period — 平均周期。 RSI Applied price — 价格类型。 Clear the chart at startup — 启动时清除图表。 Set of Pairs — 符号集 — Market Watch — 来自“市场观察”的配对。 — Specified manually — 在参数“Pairs”中手动指定对。 — Current pair — 仅显示当前对。 Pairs (separated by a space or semic

随机振荡器的多货币和多时间框架修改。 您可以在参数中指定任何所需的货币和时间范围。 该面板显示当前值和线的交点 - 信号线和主线(随机交叉)。 此外,该指标还可以在跨越超买和超卖水平时发送通知。 通过单击带有句点的单元格,将打开该符号和句点。 这是 MTF 扫描仪。 与货币强度计类似,仪表板可以自动选择包含指定货币的货币对,或以该货币为基础货币的货币对。该指标在“货币对集合”中指定的所有货币对中搜索货币;其他货币对将被忽略。并根据这些货币对计算该货币的总随机指标。您可以看到该货币的强弱程度。
默认情况下,从图表中隐藏仪表板的键是“D”。
参数 %K Period — K 线的周期。 %D Period — D 线的周期。 Slowing — 放慢; Method — 平均法; Price field — 价格类型。 Line of indicator — 线索引。 Clear the chart at startup — 启动时清除图表。 Set of Pairs — 符号集: — Market Watch — 来自“市场观察”的配对。 — Specified man

The VR Orders History script is designed to upload a trade report to a csv file. This format is intended for additional analysis of trading history in programs such as EXCEL, Openoffice, and Libreoffice. Thanks to the script, it is now much easier for a trader to analyze their trading history. The program facilitates the analysis of the trading history for the MetaTrader 5 terminal. The trader sees structured trading. The entire report is based on the following principle: Position > Order on the
FREE

The USDJPY Trader EA is an automated trend following system that is always in the market and trades using sell stop and buy stop orders with trailing stop losses to capture large movements in the market. It also includes a money management feature which calculates lot size based on account size and risk with an option to set a maximum draw down at which the EA will stop trading. This is a long term strategy combined with money management and will work on any pair but works best on USDJPY M15. Vi
FREE
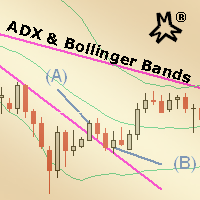
MMM ADX & Bollinger Bands & MA strategy: This EA's strategy combines two built-in indicators to enhance its signals and decide to open a new order at the right time. There is an ADX indicator and you may choose its signal's strength and Bollinger Bands indicator confirms the trends and MA to check if the prices are deviating from its pattern. By joining both indicators' data and the moving average, it is possible to calculate quality signals, avoiding sudden market movements against your tradin

This tool allows you to better analyze your chart. With "Crosshair Percent", you can calculate distances in the chart in a percentage way (in a very simple way, when the pointer is attached in the form of a crosshair: CRTL + F). The utility allows to measure and/or calculate the movements of the price NOT only in points, use a measure in professional terms as it is the percentage. The result is shown in two parts of the screen, one of them, next to the position of the pointer and the other in a

The Complex Chaos EA is an automated system that uses a pair of exponential moving averages to detect the market direction and opens trades on candle open. If the market moves against a trade it will at a set distance open another trade in the same direction to move the take profit of the group of open positions closer to the current price and make the group of trades winners overall once the price reverses. If a change in direction is detected then all trades are closed and it starts trading in
FREE

The Bollinger R (Bollinger Reversals) is designed to recognize short term high profitable counter trend patterns from the chart. This system combines both Bollinger Bands and mean reversion to define positions where the market could potentially reverse direction. This is the MT5 version of Bollinger R Description Bollinger Bands are well known in the trading community. I have added the concepts mean reversion and "distance between Price and a Moving Average" to help confirm and trade the “bounce

The ATR (Average True Range) Trailing Stop indicator gives a suggested trailing stop level for exiting trades. Designed to help you stay in a position for as long as possible, without getting stopped out too early by intra-bar volatility. Based on average true ranges over the last few bars, plus current price action, the indicators gives a steadily increasing line below the current price for rising markets and a steadily decreasing line above the price for falling markets. These levels are the s

Breakthrough Solution For Trend Trading And Filtering With All Important Features Built Inside One Tool! Trend PRO's smart algorithm detects the trend, filters out market noise and gives entry signals with exit levels. The new features with enhanced rules for statistical calculation improved the overall performance of this indicator.
Important Information Revealed Maximize the potential of Trend Pro, please visit www.mql5.com/en/blogs/post/713938
The Powerful Expert Advisor Version
Automa

Hull Moving Average (HMA) is well-deservedly popular among traders because of the effective averaging of market noise and a relatively small delay. The current MetaTrader 5 version changes its color when the movement direction changes. Sound and text signals are available. It also supports sending email and push messages. It is possible to trigger a signal on the current incomplete bar, although such a signal may be canceled before completion if conditions are no longer appropriate. One of the p
FREE

The FXTT Trendline EA for MT5 is a robot that helps you trade using the trendlines drawn on your chart. It basically allows you to set pending orders using trend lines . Something that Metatrader does not allow you to do by default. Easy to set up Choose default Lot size , Stop Loss and Take Profit Allows action on Touch, Pullback, Breakout or False Breakout of trendline The usage and configuration of the Expert Advisor is as follows: Load the EA Draw your trendlines on the chart Add Buy or Sell
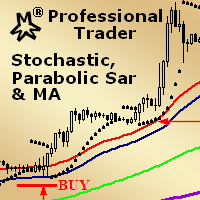
MMM Stochastic, PSAR & MA: This EA's strategy is a combination of two indicators types (Oscillator and Trend) and a Moving Average which helps to enhance the price trends signals and decide to open a new order at the right time. There is an Stochastic (Oscillator) indicator, a Parabolic SAR (Trend) indicator and a Moving Average that you may tune by using the strategy tester optimization to help you to find the best input values that will give you the best results ; It is highly recommended for

This trend Expert Advisor is based on an original interpretation of the Bollinger Bands indicator. This signal generation method allows entering the market at the very beginning of the trend with a tight stop loss. The EA contains 6 options for position closure signals, which allows selecting the best one depending on the instrument, as well as market conditions. All positions are protected by virtual and fail-safe stop loss. The virtual stop loss triggers only after a bar closes beyond its leve

所有的交易者都面临一个严肃的问题: 如何实时评估交易策略的表现,并控制风险?
尽管在策略测试中使用了回溯和优化,但不幸的是,交易者需要谨慎考虑曲线拟合的潜在危害,因为优化结果只是针对特定的历史数据集进行了测试。
本指标从历史数据中还原成交信息,然后实时绘制账户的余额和净值曲线,并计算回撤。
它有助于交易者直观分析交易策略,并深入挖掘其优势/漏洞。 特别是动态监测资金使用状况,并控制风险。
支持两种保证金计算模式:净持,对冲。 支持多品种混合和单一品种计算。
输入参数指南 ShowCurrentSymbolOnly - 仅计算并绘制图表品种的曲线 DataAbsentRetry - 如果历史数据缺失或损坏,重试加载次数 操作说明 确保任何成交品种的所有历史数据都完整准确,否则会导致曲线失真。 打开任何品种的图表 加载指标 由于点差和点值是浮动的,因此净值数额与实际的净值数额略有差异。 图表描述 蓝色曲线 - 余额 绿线曲线 - 粗线为当前净值,上方虚线为最大值,下方虚线为最小值 最大回撤百分比 - 最大回撤百分比,绝对回撤和相对回撤的最大值 绝对回撤百分比 - 绝对回

In today’s market, an objective counter trend technique might be a trader’s most valuable asset. Most of the traders in the financial market must be familiar with the name "TD Sequential" and "Range Exhaustion". The Sequential R is a Counter-Trend Trading with Simple Range Exhaustion System. Sequential R is useful to identify trend exhaustion points and keep you one step ahead of the trend-following crowd. The "Sequential R" is designed to recognize profitable counter trend patterns from your ch

ScalpingProMt5 is a new indicator for professional traders. The indicator is a ready-made scalping strategy. The algorithm calculates a micro trend, then searches for price roll-backs and forms a short-term trading signal according to the market price. The indicator consists of a data window and a graphical signal on the chart in the form of an up or down arrow. The data window displays the current trading symbol, spread and appropriate trader's actions: WAIT, SELL and BUY .
Advantages the ind

This long-term trading system works on 9 pairs and timeframe. The Expert Advisor uses various trading systems, such as trend trading, counter-trend trading and others. The EA has the built-in smart adaptive profit taking filter. The robot has been optimized for each currency and timeframe simultaneously. EA uses economic news. No martingale, grid and other risky strategies. EA uses timeframes:
MetaTrader 4 MetaTrader 5 M5, M15, M30, H1 M2, M3, M4, M5, M6, M10, M12 , M15, M20, M

The BuySellArrows is an indicator without any input parameters. This makes it an easy-to-use trend trading indicator for beginners, advanced and professional traders. The main purpose of this indicator is to detect and mark (with arrows) a local trend, which is one of the most important problem for a trader regardless of their trading style. The main coding algorithm inside the indicator is calculating the speed and direction of the price change. This indicator will show Buy (color Aqua) or Sell

Monitoring : https://www.mql5.com/en/signals/author/yarkan
Features no use of any indicators Uses averaging with an increased lot Open prices only (an EA that explicitly controls bar opening) Trades Buy and Sell independently. In the EA parameters, you can set Buy, Sell or BuySell (for Hedge accounts) Displays the trade information in the top left corner of the chart
Recommendations Timeframe: M1 Leverage 1:500 Rebate to refund part of spread or commission
Parameters Pairs - setting the pa

Fibonacci decorator is a unique product that decorates Fibonacci objects. This indicator can change the specific level line of a Fibonacci object. This tool caters to both beginners and advanced traders using Fibonacci objects.
Advantages Supports three Fibonacci objects: Fibonacci Retracement Fibonacci expansion Fibonacci time zones Just add the mark of your choice to the description of a Fibonacci object's level Easy setting This indicator does not work well with Strategy Tester. Please down

DAR Portfolio Modeller Expert Advisor forms an investment share portfolio. Its model is based on two key indicators of any financial instrument - profitability and risk that are both quantified. According to the model, the profitability is a mathematical expectation of profit, while risk is defined as a profitability distribution near the mathematical expectation and calculated using the standard deviation. Unlike other similar programs, you do not have to manually download history and insert it
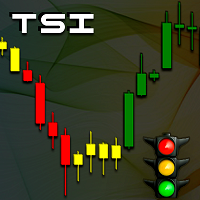
TSI - Trend Semaphore Indicator
Work tool developed to display the force of movement. This tool was developed for Trend Following strategies. Recommended for all types of traders. Can be used in any instrument and market. Can be used in any period of time. Trend indication using multicolored candles.
New trend A new trend is signaled by the changing colors on the chart's candles. The indicator indicates the upward trend with the green color, the downward trend by the red color and weak moveme
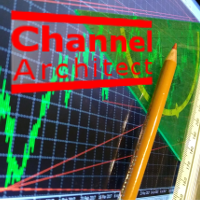
This indicator calculates and draws lines over the chart. There are two types of channels: Channel A: the mainline is drawn using local lows for uptrends and local highs for downtrends Channel B: the mainline is drawn using local highs for uptrends and local lows for downtrends The parallel lines of both types are built using the max. fractal between the base points of the mainline. There are a few conditions, which have to be fullfilled and can be changed by the parameters (see also picture 4):
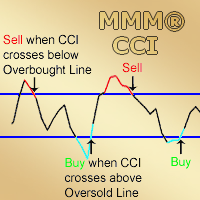
MMM Commodity Channel Index Strategy: The robot uses its two built-in improved and tested CCI indicators to determine the prices trends and calculates the signal for buying or selling. It sends an order, closes or moves the Trailing Stop loss position as the indicator works. Perfect for scalping. It will not send an order unless the calculations determine a good trend of profit. Like all MMM products, it is also programmed to minimize your losses and protect your money from the hostile market. W

Displays multiple indicators, across multiple timeframes and symbols to give a comprehensive overview of the market. Uniquely, the indicators are configurable and can include custom indicators, even those where you just have the ex4 file or those purchased from Market. Standard indicators can also be selected, the default being ADX, CCI, market price above/below Moving Average (MA), Moving Average Cross (MAX), MACD, Momentum (MOM), OsMA, RSI, Parabolic SAR, William's Percentage Range (WPR). Use

Maintaining a trading log allows you to save all your market entries and exits. Perhaps, your terminal can do this for you. Order Viewer displays trades from your trading log on the chart at any moment. You can share this log with your friends to show your trading and see how others trade. The entries format in your trading log should be as follows: YEAR-MM-DD HH:MM:00.000 TICKER SIZE PRICE Below is the sample log in the Excel table ( saved as a csv file ): Date and time
Symbol Position
Price

When using CCI (Commodity Channel Index) oscillator, the waiting time till the next signal can be long enough depending on a timeframe. CCI Alerts indicator prevents you from missing the indicator signals. It is a good alternative for the standard CCI indicator. Once there appears a CCI signal on the required level, the indicator will notify you with a sound or push, so you will never miss an entry. This is especially significant if you follow the indicator in different timeframes and currency p

EvoNightEA MT5 v.10.3 Presets: Download >>> EvoNightEA MT5 v.10.3 Live Results: Here >>> EvoNightEA is a fully automated Expert Advisor based at midnight scalping during the low market volatility. EvoNightEA is based on the principles of channel trading and Price Action. The system analyzes the price movement in the daily range and, based on the data obtained, trades in the low-volatility market in rollover. Most of the parameters are dynamic, thus reducing the chance of overfitti


Renko Expert Advisor based on Renko bar simulation. The EA has two options for building Renko bars. Classic and ATR. In the classic version, renko bars are marked with areas on the main chart; in the ATR version, renko bars are modeled and drawn in the indicator window. Modeling renko bars inside the EA allows you to optimize the robot better than drawing renko bars offline.
Telegramm channel Set file Our second robot RENKOTREND Does not use martingale! Trades opened by the robot co
FREE

Salva EA is an advanced and fully automated system. The basis of this strategy is the price chart itself, the trade is conducted from the price movement range.
Benefits This is not martingale, not arbitration Ready for operation without PreSetting Always use a stop loss and take profit to save your investments Easy to use (does not have complex settings) The results of the tester converge with the results on a real account High speed testing (can be optimized for 1 minute OHLC) Salva EA works

ReviewCandleChart is a unique product that can verify past price fluctuations using candlestick charts. This indicator accurately reproduces market price fluctuations in the past and can make trading decisions (entries, profits, loss cut) many times so that you can learn the trading faster. ReviewCandleCahrt is the best indicator to improve trading skills. ReviewCandleCahrt caters to both beginners and advanced traders.
Advantages of the indicator This Indicator for verifying price fluctuation

Operation principles For the Expert Advisor operation, it is necessary to configure three parameters in accordance with recommendations. The EA works on any timeframe and symbol. The EA analyzes the movement of price beyond a set formed price range, the movement speed and the trend. A position is opened when necessary conditions occur.
Parameters Сurrency pair . Recommended values for symbols: five-digit EURUSD in the format 1.00001 – 1, four-digit EURUSD in the format 1.0001 – 2; five-digit G

RCCMA is a general moving average indicator that works with ReviewCandleChart. Original is "Custom Moving Average" provided by MetaQuotes Software Corp. Based on that source code, I corresponded to ReviewCandleChart .
Advantages When ReviewCandleChart is ON, no line will be displayed on the right side from the vertical reference line. When ReviewCandleChart is ON and you press a key such as "Z" or "X" Following that, the MA is drawn. When ReviewCandleChart is OFF, the same drawing as the origi
FREE

The EA waits for a spike according to a specific logic and opens a position in spike direction setting stop loss and take profit. When positions are in profit they are managed with smart trailing mechanism based also on elapsed time from opened position. It works with 5-digit and 4-digit broker. Must be used M1 chart. It does not use : Martingale. Grid. Hedge.
Parameters spikeFilter - value to decide opening positions takeProfit - take profit in points stopLoss - stop loss in points firstTrail
The EA is recommended for trading USDJPY M5. It is based on the strategy of "waiting out", the market entry (and exit) points are determined on the basis of correlation of a number of indicators. The trading volume for opening a position depends on results of previous trades. It is possible to limit the amount of risk (the AutoMM parameter). It is also possible to set the maximum spread, above which the EA will automatically suspend trading (the MaxSpread parameter). It also has advanced feature
The EA is recommended for trading AUDUSD timeframe M5 or M15. It is based on the strategy of "waiting out", the market entry (and exit) points are determined on the basis of correlation of a number of indicators. The trading volume for opening a position depends on results of previous trades. It is possible to limit the amount of risk (the AutoMM parameter). It is also possible to set the maximum spread, above which the EA will automatically suspend trading (the MaxSpread parameter). It also hav

This Expert Advisor is designed for use on all currency pairs on any timeframes. Candlestick analysis from different timeframes is used for opening positions. Positions are closed using the automated trailing system or by an opposite signal. The EA does not have input parameters affecting the trading algorithm. Timeframe: any (candlesticks from M15 to H4 are used) Currency pair: any (it is recommended to simultaneously use at least 4 major currency pairs).
Parameters LotSize - lot value parame

Simba EA is a medium-term EA for MT5 ( and MT4 ). It embeds a basic but effective price breakthrough strategy based on S/R levels. The EA is meant to be used with EURUSD, GBPUSD & USDJPY, whatever the timeframe it'll always perform calculation using M15.
Settings Take profit (in points) : 0 to disable it Trailing stop (in points) : 0 to disable it Stop loss (in points) : 0 to disable it Maximum spread : Simba won't open positions if the spread is higher than ... Time filtering : all time perio
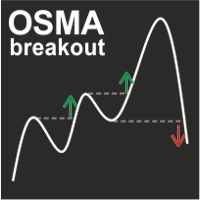
The OSMA Breakout indicator displays the signals that are generated when the previous OSMA extremum is overpassed, while simultaneously creating an extremum point on the price chart. If the extremum of the previous wave was punched, but the price remained in the flat (in the narrow range), then the signal will not be displayed. This approach allows you to reduce the number of false signals in the event of a prolonged trend and the divergence of the indicator. The indicator works on any trading i

The Expert Advisor has been created for trading on accounts with the deposit of more than $1,000. Uses M1 timeframe. Simultaneously on the recommended pairs: EURUSD, USDJPY, GBPUSD, USDCHF, AUDUSD, USDCAD, NZDUSD, EURAUD, CHFJPY, EURGBP, EURJPY, GBPJPY. Check if your broker supports hedging, since the EA uses hedging based on MACD and RSI. The Expert Advisor enters a position based on MACD and RSI signals. If the price goes in the opposite direction, the EA will open a hedging order and will clo

The indicator shows the trend of 3 timeframes: higher timeframe; medium timeframe; smaller (current) timeframe, where the indicator is running. The indicator should be launched on a chart with a timeframe smaller than the higher and medium ones. The idea is to use the trend strength when opening positions. Combination of 3 timeframes (smaller, medium, higher) allows the trend to be followed at all levels of the instrument. The higher timeframes are used for calculations. Therefore, sudden change
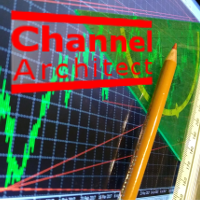
This utility calculates and draws lines over the chart. There are two types of channels: Channel A: the mainline is drawn using local lows for uptrends and local highs for downtrends Channel B: the mainline is drawn using local highs for uptrends and local lows for downtrends The parallel lines of both types are built using the max. fractal between the base points of the mainline. There are a few conditions, which have to be fullfilled and can be changed by the parameters (see also picture 3):

The indicator displays the key support and resistance levels on the chart. The significance of these levels lies in that the price may reverse or strengthen the movement when passing such levels, since they are formed as a consequence of the natural reaction of market participants to the price movement, depending on which positions they occupied or did not have time to occupy. The psychology of the level occurrence: there always those who bought, sold, hesitated to enter or exited early. If the

This indicator is a multitimeframe trading strategy. It has the levels for stop loss, take profit and entry point. The order level can also be set manually. The indicator uses the regularity of the market, which manifests itself on all instruments, and does not require adjustment of the parameters. The strategy uses a proprietary approach to determining: trend, volatility, hierarchy of timeframe significance, the size of the history period (the number of candles), which is important for making a

A comprehensive tool for determining the levels of support, resistance, reversals in relation to trading sessions. The indicator's thesis can be expressed as follows: "Support and resistance levels are undoubtedly formed by the psychological barriers of market participants, and influence the further behavior of the price. But these barriers are different for different groups of traders ( One man's meat is another man's poison ) and can be grouped by territory or by the trading time ". Follo
FREE
The Moving Average Slope (MAS) is calculated by detecting the moving average level n-periods ago and comparing it with the current moving average level. This way, the trend of the moving average can be drawn on the moving average line. This indicator allows to compare the slopes of two moving averages (fast and slow) to cancel out noise and provide better quality entry and exit signals SCANNER is included . Now with Scanner you can find trading opportunities and setups easily and faster.
Featu

The indicator measures the frequency of incoming ticks to analyze the market activity. Bullish and bearish ticks are analyzed separately, informing about the currently predominant market sentiment. According to observations, an increase in the frequency of ticks (panic) indicates the beginning of strong price changes, and an increase in the frequency of ticks in a particular direction not only accompanies a price change in this direction, but also often anticipates it. The indicator is indispens

实用程序旨在更改当前、所有或选定图表的交易工具、时间范围更改以及历史记录中的同步移动(自动或单击)所有图表。交易品种列表是从“市场概览”中读取的。您可以更改按钮的颜色、大小和位置。当您单击同步按钮或在自动模式下移动鼠标/键盘时,图表同步发生在活动图表中的第一个可见条时。可以使用光标键更改 TF:向左/向右,以及交易符号 - 向上/向下。 8 种主要货币的按钮允许您从货币对列表(取自市场概览或用户字符串)中打开图表。可以在“新图表的模板名称”参数中指定新图表的模板。更改货币时,会保存当前图表的模板,并在指标打开的图表上替换货币对的货币。当您再次选择货币时,会加载相应的模板。
复制模式允许您一次将对象复制到当前工具的所有图表。
全局十字准线允许您查看所选图表上指定柱线的价格走势。 参数说明及说明 。 主要功能列表(该实用程序不断改进,所有新功能和更新都可在“新增功能”选项卡中找到): 为当前/选定/所有图表切换交易工具。 使用向上/向下光标键切换交易工具。 在主图表上更改时为所有/选定图表切换交易工具(主图表是安装了实用程序的图表)。 使用鼠标按钮突出显示交易工具的按钮。 预设交易工

Indicator of Stowell's Three-Bar Net Line. In this indicator, the number of bars used for determining the lines can be defined in the settings. With the default settings, the indicator draws arrows in the areas of the line breakout. The lines are not displayed on the chart by default. but can be enabled.
Parameters Alerts - enable alerts when arrows appear. Arrows appear on a forming bar and can disappear during bar formation. Therefore, it is recommended to wait for the bar with the arrow to
FREE

HeatMap MT5 allows traders to see inside the charts. This indicator plots congestion zones over a certain period of time, known as "Lookback", by analyzing thousand of variables simultaneously. These spots act like strong supports and resistances and now are easy to see. HeatMap MT5 works with all timeframes and all instruments.
Settings Computations - define whether the algorithm works continuously or only at the opening of each candle (default: New Candle). Lookback in Bars - define the peri

The SmartTrendMt5 trend indicator generates signals based on the principle of combined analysis of calculated reference points within the Keltner channel. The indicator plots the Keltner channel in a separate window (by default, red lines and a blue line - the middle of the channel), and also draws the histogram of calculated reference points for each candle (by default, the histogram bars are yellow). The should be attached to a chart of any timeframe and any trading symbol in the usual way.

Reversal Expert is a fully automatic Forex Expert Advisor. For several years, the robot enters on reversal signals to make quick profits. When the target is not reached, the position is slowly increased until it becomes profitable (see screenshots below). Best results are observed on GBPUSD, USDCAD, EURGBP and AUDUSD on the M15 timeframe.
Advantages Tunable risk. Can work on several Forex pairs in the same account. Large user base since 2013. Lot size automatically adapted to your balance. Rea

The indicator trades during horizontal channel breakthroughs. It searches for prices exceeding extreme points or bouncing back and defines targets using customizable Fibo levels with a sound alert, which can be disabled if necessary. The indicator allows you to create a horizontal channel between the necessary extreme points in visual mode quickly and easily. It automatically applies your selected Fibo levels to these extreme points (if the appropriate option is enabled in the settings). Besides

ScalperMultiMT5 is a multicurrency indicator for professional traders. The indicator shows the complete market situation for the trader. The main advantage of this indicator is that it simultaneously analyzes six major currency pairs on all timeframes from M1 to MN. The indicator analyzes the trend strength. The indicator generates color-coded signals to visualize the market situation: Green - ascending trend. Red - descending trend. Yellow - trend is not defined. The indicator is excellent for

该实用程序允许您在策略测试器中手动测试您的策略。在可视化图表上一键交易。
策略测试器现在也提供了方便且完整的测试交易技能的功能。 复盘大师 Pad 是一款用于策略测试的交易模拟器。使用指标进行交易。 我们实用程序的主要功能 MT4版本
详细描述 +DEMO +PDF 如何购买
如何安装
如何获取日志文件 如何测试和优化 Expforex 的所有产品 适用于 MetaTrader 策略测试程序 4 和 5; 交易、头寸和订单管理; 可以使用任何指标; 止损、止盈、追踪止损、订单网格; EAPAD PRO 图表友好的仪表板; 一键单击即可控制速度、暂停和图表控制。等等。 警告:此面板供策略测试人员使用! 对于实时图表上的一键交易,您可以下载我们的实用程序 VirtualTradePad for MetaTrader 4 和 VirtualTradePad for MetaTrader 5 。 结合我们 EA 通用面板 EAPADPRO 的优点和 VirtualTradePad交易实用程序的强大功能, 我们创建了产品 Exp - Tester PAD
FREE
MMM Heiken Ashi strategy: The robot uses its built-in Heiken Ashi improved and tested indicator all the time and does a calculation to determine the prices trends. It sends an order, closes or moves the Trailing Stop loss position as the indicator works. Perfect for Scalping; It will not send an order unless the calculations determine a good trend of profit; Like all MMM products, it is also programmed to minimize your losses and protect your money from the hostile market. We have protections li

If you would like to trade reversals and retracements, this indicator is for you. The huge advantage is that the indicator does not have input parameters. So, you will not waste your time and will not struggle to change them for different timeframes and symbols. This indicator is universal. The green triangle represents a possibility to go long. The red triangle represents a possibility to go short. The yellow dash represents a "no-trading" situation. This indicator could be used on M1, M2, M3,

The indicator measures the frequency of incoming ticks to analyze the market activity. Bullish and bearish ticks are analyzed separately, informing about the currently predominant market sentiment. According to observations, an increase in the frequency of ticks (panic) indicates the beginning of strong price changes, and an increase in the frequency of ticks in a particular direction not only accompanies a price change in this direction, but also often anticipates it. The indicator is indispens
FREE
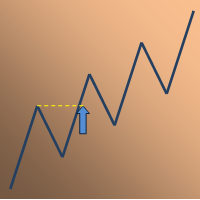
This is a functional extension of the ZigZagLW indicator. It detects the beginning of a new trend signaling of a new indicator line shoulder of a specified level. This is a stand-alone indicator, which means you do not need the activated ZigZagLW indicator for correct operation.
Algorithm logic To understand the logic of the indicator, let's take a look at the screenshots consistently displaying the conditions for the signals formation. The chart has ZigZagLW indicator with the Short_term and

A must-have tool for any strategy based on divergence detection. 10 different oscillators can be used to detect divergences and can be combined with Double Top/Bottom patterns to confirm reversal signals. SCANNER is included . Now with Scanner you can find trading opportunities and setups easily and faster.
Features Easily detect strong reversal signals. 10 different oscillators are available for divergence detection. Divergence & Top/Bottom detection can operate independently or combined. Get

This script will show you information about the execution speed of market orders. Instruction 1. Press " File/Open Data Folder " 2. Open the " Logs " folder. 3. Copy the log-files to " MQL5\Files " 4. Run the CheckExec script on EURUSD chart, for example 5. Select parameters: AllOrders - check execution time of all market orders for EURUSD, OpenOrders - check execution time of market orders which where used to open positions on EURUSD, CloseOrders - check execution time of market orders which wh

A comprehensive tool for determining the levels of support, resistance, reversals in relation to trading sessions. The indicator's thesis can be expressed as follows: "Support and resistance levels are undoubtedly formed by the psychological barriers of market participants, and influence the further behavior of the price. But these barriers are different for different groups of traders ( One man's meat is another man's poison ) and can be grouped by territory or by the trading time ". Follo

Purpose DG DayInfo is a free indicator that shows information about: Day's maximum prices; Day's minimum prices; Day's percentual variations; Daily candle direction (Up, Down or Flat); Candle timer; This way, DG DayInfo helps you to see day's maximum and minimum, check day's percentual variation and time left to close candle.
Key features Designed to be simple to use, with a few parameters Works in ALL pairs Works within ALL time frames*
Main Indicator Parameters Days - Set to how many days
FREE

This is an ordinary MACD indicator displayed in the main window according to the selected chart style, i.e. Bars, Candlesticks or Line. When you switch the chart type, the indicator display also changes. Unfortunately I could not improve the chart type switching speed. After switching, there are delays before the arrival of a new tick.
The indicator parameters Fast EMA period Slow EMA period Signal SMA period Applied price
FREE
您知道为什么MetaTrader市场是出售交易策略和技术指标的最佳场所吗?不需要广告或软件保护,没有支付的麻烦。一切都在MetaTrader市场提供。
您错过了交易机会:
- 免费交易应用程序
- 8,000+信号可供复制
- 探索金融市场的经济新闻
注册
登录