适用于MetaTrader 5的新EA交易和指标 - 172

This indicator displays buy or sell signals according to Bill Williams' definition of the Trading Zone. [ Installation Guide | Update Guide | Troubleshooting | FAQ | All Products ] Easy to use and understand Avoid trading flat markets Deterministic indicator with clear rules The indicator is non-repainting It implements alerts of all kinds It has straightforward trading implications. A blue arrow is a buy signal A red arrow is a sell signal According to Bill Williams trading in the zone helps t

Binance Full Trader is developed for connection to your Binance account and get data, draw price charts and trade easily with any strategy by an indicator. A user-friendly interface has developed for it and has tried to give access to the necessary information such as open orders and wallet balances. · There are two sample indicators (one for trade signal and another for price) that you can download it from these links: https://drive.google.com/file/d/1w2CGuu3rArWKMhS9LkepT9zhVkGR1AO7/vie

This utility is the demo version of the Binance Full Trader. This version is provided so the customers can test performance and options of the main version. · This version has these restrictions: 1. Only BTCUSDT is available for price chart and Test Mode. 2. The Real Mode is not accessible. 3. The LIMIT and STOPLOSSLIMIT are not accessible. 4. The Indicator mode is not accessible. · The full version and the instruction of use can be downloadable from t
FREE

ONLY 3 COPIES OUT OF 10 LEFT AT $50! After that, the price will be raised to $200. EA with the idea of using the "High Risk - High Reward" strategy. You should use the EA with the same capital as my trading signal, withdraw profits regularly and only use lot size 0.01 no matter the capital. The strategy was Back-tested Stable from 2016 to 2021 using every tick based on real ticks in MT5 using Dukascopy Real Ticks 100% tick quality. Live trading is going well on many different brokers - REAL S
RSI EA ΜΤ5 是一种独特的全自动智能交易系统,用于交易众所周知且极其高效的相对强度指标,能够同时控制您的交易账户在篮子级别的利润和/或亏损,对于您所有未平仓头寸的组合. RSI EA MT5 有 4 种不同的交易相对强度指标的策略,在实时柱线的 RSI 极端值上开仓交易,在闭合蜡烛上的 RSI 极端值开仓交易和 RSI 水平交叉上的开仓交易。最后一种策略是相对强度指标的一种独特方法,因为它是一种趋势跟踪策略,而不是逆转策略。此 EA 附带为许多符号提供的设置文件,专门针对 ECN Raw Spread ICMarkets 帐户(基于纽约的 GMT+3 时区服务器)进行了优化。可能会使用其他经纪商或账户类型,但您可能需要进行任何必要的时间调整以适应您的经纪商/账户。 建议: 我的 EA 都不是能够预测市场的神奇产品。 相反,他们是诚实的、编码良好的专家顾问,旨在赢得更多而不是失去。 他们不采用鞅或网格策略,这意味着他们的结果不会始终显示出向上的利润曲线; 可能会有起伏。 他们的成功需要耐心和纪律。 我的一般建议是在策略测试器中测试所有提供的设置文件。 如果您发现任何有

币安是全球知名的加密数字货币交易所!为方便对加密数字货币行情进行实时数据分析,程序可自动将币安实时成交数据导入到MT5进行分析,主要功能有:
1、支持币安全部现货交易对自动创建,也可以单独设置盈利货币和基础货币。如盈利货币ProfitCurrency为空表示全部交易区,可选:USDT、BTC、DAI等币安支持的交易区(合约交易暂不支持),基础货币BaseCurrency为空表示所有货币,也可以单独设置BNB、ETC等任何币安支持的加密货币。 2、同步币安各货币的价格精度、交易量精度以及最大交易量等。
3、通过WebSocket链接币安,每一笔成交即可推送到Mt5更新行情。
4、支持所有现货品种同时更新,为提高实时数据效率,可自定义最大更新组(需要打开对应窗口更新),工具默认最大组数为4组,需要打开4个图表窗口,运行时分别设置RangNO为0,1,2,3(小于最大窗口数),以此类推。如果仅需要更新当前窗口的实时行情,可将RangNO设置为-1。
5、实时行情更新请使用代理地址,因此,必须将代理地址 trade.ctabot.com 添加到:MT5——工具——选项——EA——We

币安是全球知名的加密数字货币交易所!为方便对加密数字货币行情进行更精确的分析,程序可自动将币安的期货K线数据导入到MT5进行分析,主要功能有:
1、支持币安USD-M全部期货交易对自动创建,也可以单独设置基础货币。如基础货币BaseCurrency为空表示所有货币,也可以单独设置BNB、BTC等任何币安USD-M期货支持的加密货币。
2、同步币安各期货货币的价格精度、交易量精度以及最大交易量等。
3、自动更新列表中所有币安支持的列表期货行情数据,便于技术分析。
4、支持7*24小时的期货行情数据,第一次导入时默认从币安第一笔交易同步,以后则从最新的K线自动同步数据。
5、支持代理(代理默认为 http://trade. ctabot.com:9441),也可以用币安接口地址 https://fapi.binance.com直接访问 (如果可以直接打开币安),注意此地址必须填写到:mt5——工具——设定——EA交易的WebRequest列表中,否则所有数据无法同步。
6、同步间隔不低于5秒,否则EA无法启动。 7、为避免跟现货符号冲突,当前期货行情导入工具可自定义期货前缀,

币安是全球知名的加密数字货币交易所!为方便对加密数字货币行情进行实时数据分析,程序可自动将币安期货实时成交数据导入到MT5进行分析,主要功能有:
1、支持币安全部USD-M期货交易对自动创建,也可以单独设置基础货币。基础货币BaseCurrency为空表示所有货币,也可以单独设置BNB、ETC等任何币安支持的加密货币。 2、同步币安各货币的价格精度、交易量精度以及最大交易量等。
3、通过WebSocket链接币安,每一笔期货成交即可推送到Mt5更新行情。
4、支持所有期货品种同时更新,为提高实时数据效率,可自定义最大更新组(需要打开对应窗口更新),工具默认最大组数为4组,需要打开4个图表窗口,运行时分别设置RangNO为0,1,2,3(小于最大窗口数),以此类推。如果仅需要更新当前窗口的实时行情,可将RangNO设置为-1。
5、实时行情更新请使用代理地址,因此,必须将代理地址 trade.ctabot.com 添加到:MT5——工具——选项——EA——WebRequest列表中。
6、行情更新时,图表窗口的计数器会不断变化,如果因为网络原因或币安接口异常导致停止,请重新运

使用 The Strat 进行交易时,关注多个时间范围很重要。 该指标将显示每个时间范围内当前蜡烛的每日、每周、每月和每季度状态。 圆圈图标表示该时间范围内的蜡烛目前是内部蜡烛,或 TheStrat 术语中的类型 1。 Inside Day 蜡烛正在巩固价格走势,我们正在寻找该范围的突破。 指向上或下的三角形图标是趋势蜡烛,或 TheStrat 术语中的类型 2。趋势蜡烛可以是看涨或看跌,表明它已经突破了之前的蜡烛范围,现在正朝着一个方向发展。 方形图标是外部蜡烛,或 Strat 术语中的类型 3。这表明两件事,一是价格在该时间范围内的方向未定,可能相当波动,二是在较短的时间范围内,可能有很好的交易空头反转机会。该正方形将是看涨或看跌的颜色,以显示当前获胜的一方。 每个图标使用的颜色都可以根据您的喜好进行配置,文本和图标的大小也是可配置的。 设置
时间范围选择 每小时显示 当为 True 时,显示每小时蜡烛状态。 每日秀 当为 True 时,显示每日蜡烛状态。
每周秀 当为 True 时,显示每周蜡烛状态。 每月显示 当为 True 时,显示每月蜡烛状态。 季刊 当为 True 时,显
夹线机2.0MT5
Version for MT4: https://www.mql5.com/en/market/product/67566
实时监控专家在真实账户上的工作:
1. 2020年5月推出的真实账户,起始余额为5,000美元: https://www.mql5.com/en/signals/773977
2. 真实账户,起始余额$10,000,于2022年4月推出:
顾问工作背后的想法: 每个人都知道,价格永远不会无休止地朝着一个方向前进,没有修正。 技术分析的规则告诉我们,历史总是重演。 这意味着价格将在一段时间后重复低点和高点。 此外,观察各种金融工具的价格行为图表,我们发现大约90%的时间市场处于具有一定价格范围的横盘走势,只有10%的时间市场出现下行或上行趋势。 基于这种理解,我们开发了一种算法,可以打开和记录具有潜在利润的交易操作。
自2012年以来,EA设置已经过历史数据测试
要从我们的交易账户接收设置文件,请通过电报与我联系: https://t.me/fanaty

Dark Inversion is an Indicator for intraday trading. This Indicator is based on Counter Trend strategy but use also Volatility. We can enter in good price with this Indicator, in order to follow the inversions on the current instrument. Hey, I made an Expert Advisor based on this indicator, if you are interested: Dark Titan MT5
Key benefits
Easily visible Inversion Lines Intuitive directional arrows Automated adjustment for each timeframe and instrument Easy to use even for beginners Never r
FREE

Hello Seasonal Traders! The seasonality trading strategy works because the smart money is doing the same thing every single year more often than not. The month of the year or the day of the week and the time of the day can call the shots in any market. The seasonal cycle is another useful tool in your trading arsenal. I'm not saying to trade solely off of seasonality and forget anything else. I'm only giving you another trading tool that you can incorporate into your own trading strategy to ga

It's a DYNAMIC PERIOD indicator which identifies best ENTRY PRICE in the direction of main trend. It's completely non-repaint indicator and very simple to use.
Each arrow has a specific impact value from 1 to 10. Basically there is no important difference between impact numbers. The main point is: A higher impact value means that signal is generated from a bigger swing.
When it draws a Buy arrow on a bottom, It means that we had a Trend, A correction, And now this bottom is a reliable trigger fo

Entry and exit signals from the Double 7's Strategy by Larry Connors in his book "Short Term Trading Strategies That Work".
Larry claims this strategy predicted the market's direction over 80% of the time since 1995. Picking up the gains and being exposed in the market less than 25% of the time. Good for swing trading on Daily charts of SPY, Nasdaq, China's FXI, Brazil's EWZ and the majority of the equity ETFs and World Indices.
How does it work? The indicator activates the buy signal when we

Session Control session indicator. Depending on from which continent the trading activity takes place in a certain period, the entire daily routine is divided into several trading sessions.
Due to the fact that at each separate time interval exchange and banking platforms from different parts of the world are connected to the trading process, and the Forex market operates around the clock.
There are 4 main trading sessions:
Pacific. European. American. Asian.
This indicator allows you to se

Indicator of trend deviation with a static level. The deviation coefficient is set for the trend histogram. Signals are the intersection of the level trend histogram in the direction of the trend or during a trend reversal - the option is selected in the indicator settings by the "Revers" parameter. There are all the necessary settings for the design of the indication and sending messages to mail or a mobile terminal. All input parameters have an intuitive name. Analog for MT4: https://www.mql5.
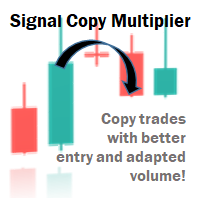
Signal Copy Multiplier automatically copies trades on the same account, for example, to get a better entry and adjusted volume on a subscribed signal. MT4-Version: https://www.mql5.com/de/market/product/67412 MT5-Version: https://www.mql5.com/de/market/product/67415 You have found a good signal, but the volume of the provider's trades is too small? With Signal Copy Multiplier you have the possibility to copy trades from any source (Expert Advisor, Signal, manual trades) and change the volume

Sense Pro - a highly customizable Expert Advisor for MetaTrader terminals that uses a grid trading algorithm. It works simultaneously in 2 directions: along the trend and against the trend. Trading in the direction of the trend works on the principle of closing profitable positions using Take Profit or Trailing Stop (configurable in the settings). Trading in the direction against the trend works by opening averaging orders to close losing positions at a profit. The EA has a wide range of se

Automatice sus estrategias comerciales con nuestra sencilla herramienta de creación de estrategias "similar a un rompecabezas". Cree fácilmente estrategias que operen por usted en modo de piloto automático. También puede cargar estrategias creadas por otras personas, como la clásica Estrategia Martingala, para usarla como muestra para su propia estrategia.
Características clave Cree su estrategia a través de funciones simples de arrastrar y soltar, sin necesidad de conocimientos de pro

Simple Schaff Trend Cycle System. Configurable number of trades openened on trigger. Choose to include a trade which has no Take Profit but closes with trailing candles high/lows. Trades are always opened above/below the prev. closing candle (see pending pips) RSI and EMA as a bias/confirmation. Use the strategy tester to get your own setup per market. Use of fixed fibnumbers won't let you over-optimize. Best to be used 1H / 4H depending on market. It will mark any trade with a vertical red/gre

This indicator displays the spread Simple and easy to use and fully customisable: View as Pips or Pipettes Chart symbol can be hidden Text display can be changed Change color and text styles Add or hide a decimal point Spacing options between inputs Default screen positions Screen position inputs
How to use 1. Simply use the default settings; or 2. Choose to show pips or pipettes; 3. Choose to display symbol, text or decimal; 4. Choose where to place it on the screen; 5. Save settings or save
FREE

MA Price Crossing EA by Capitarc CAPITARC`s MA Price Crusader for MT5 MA Price Cross -is a professional expert advisor used by our investment firm it is based on moving averages and the crossing of the candlesticks. This product looks at all the pairs, the candles closing above and possible trend continuation formations of the ever changing markets, while the usual experts are based on one or two indicators, this expert trades with naked price in addition to Moving Averages!! THIS IS A TR

Strategy Overview
The Ignition EA tries to take advantage of sudden momentum when the Ignition pattern is detected. The final bar in the ignition pattern has a small opening wick, a very little or no closing wick, is large in comparison to recent bars and must start from the lower end of the current range (for a bullish ignition)
Quick Testing
Use Symbol EURUSD, Timeframe M2, and remove the GBPUSD symbol from the "Symbols" input (stratergy 1 and stratergy 2)
Settings The below settings appe

DESCRIPTION The ‘No Open Trades’ Expert Advisor is a dream come true to any mindful trader that knows that controlling risk is extremely vital to any successful trading plan. The ‘No Open Trades’ Expert Advisor closes all open trades in the account once the percentage loss you set is met. For example, if your account balance is $5,000 and you set the percentage loss to 5. This information has been passed to the Expert Advisor and it will close all open orders once the loss made is -$250 (which

Serepok MT5 is a trending following EA. This EA uses a custom indicators to detect entry signal. The fixed stop loss and take profit are always set for each trade. This EA has smart money management. Users only need to determine the accepted loss for each trade, EA will calculate the lot size for each trade according to stop loss price. Therefore, this EA is very safe. This EA is very easy to use and can apply for many currency pairs. Recommended time frame is H1. Note:
1. Please do back testi

DYJ TradePanelMT5 allows you to perform trading operations ,opening market positions, placing pending orders, removing pending orders, and closing all positions When you use the "DYJ TradePanelMT5" to make a mistake in the direction of manual trading, you can cooperate with our remote order rescue service to turn the order back into profit. Parameters
Volume = 0.01 - - default volume; InpTP = 1200 -- default takeprofit POINTS; InpSL = 600 -- default stop loss POINTS; InpStep = 200 --
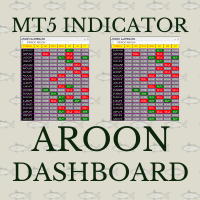
Aroon crossover Dashboard uses the value of Aroon indicator. The Aroon period can be adjusted via the Edit box of this dashboard. The monitoring pairs will be selected by adding to the Market Watch (no need to set prefixes or suffixes) , you can monitor many pairs as you like. This dashboard will check almost popular time frame (M1,M5,M15,M30,H1,H4 and D1). The colors can be customized. The Aroon indicator has been included in to this Dashboard, you do not need purchasing it. Crossover signal c

ENJOY THE LAUNCH PROMOTION WITH SUPER DISCOUNT For a complete description of all parameters and EA, check out the article I created: Make Your Own EA - Main Description : https://www.mql5.com/en/blogs/post/732582 Sets : https://www.mql5.com/en/market/product/67727#!tab=comments&page=1&comment=22585237 Monitoring signal: https://www.mql5.com/en/signals/984624 The idea of this EA is to allow the user to develop their own strategy , since few people understand programming. The oper

Simple Ichimoku Cloud break system. Configurable number of trades openened on trigger. Choose to include a trade which has no Take Profit but closes with trailing candles high/lows. Trades are always opened above/below the prev. closing candle (see pending pips) RSI and EMA as a bias/confirmation. Use the strategy tester to get your own setup per market. Use of fixed fibnumbers won't let you over-optimize. Best to be used 1H / 4H depending on market. It will mark any trade with a vertical red/g
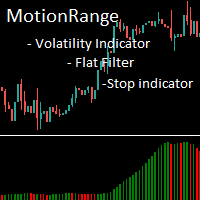
MotionRange - индикатор волатильности цены.
Индикатор не показывает направление движения цены и предназначен для наглядной демонстрации наличия трендового движения, силы тренда, ускорения и замедления трендового движения. Индикатор можно использовать для: - фильтрации флэтового состояния рынка, - открытия позиций в момент начала тренда, - закрытия позиций в момент замедления или остановки тренда.
У индикатора один входной параметр - Calculation Period. Это количество сравниваемых свечей для

Rice Martingale is an EA, which uses the Martingale algorithm with a low DD rate (not for XAUUSD, not TimeFrame M1) Rice Martingale can open two sides: buy and sell at the same time. We can set the maximum number of orders, the number of Martingale, and the number of the first orders. Especially, if the number of orders reach the point that users want to start the risk parameters, Rice Martingale can manage risks. It will cut loss at the point of the nearest average price which users set befor
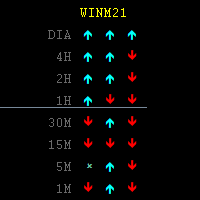
Indicador visual que mostra a direção de um ativo em diferentes times frames. Acompanhe em tempo real a variação de direção dos preços nos últimos 3 candles. É possível escolher o ativo a ser mostrado e quais times frames deseja acompanhar. Excelente para operações Day Trade. Facilita a visualização de vários times frames auxiliando assim na tomada de decisão rápida. Parâmetros de fácil configuração.

FTFC 指的是 Rob Smith 的 The Strat 定义的全时间框架连续性。 该指标在图表上绘制两条线,一条是季度、每月、每周、每日或每小时开盘水平的最高水平,第二条是这些值中最低的水平。这为您提供了一个高于或低于该通道的交易更有可能在一个方向上非常强劲。言外之意,价格走势将更加波动,您可以使用更宽的止损。 还绘制了第三条虚线以显示高点和低点之间的中点。当市场试图将价格推向某个方向时,这通常是寻找支撑或阻力的好地方。如果您通过将颜色设置为无来选择,则可以关闭此行。
设置
包括季度级别 允许您选择在计算中包括季度开盘价,因为有些人喜欢忽略它。 IncludeCurrentTimeframe打开 为真时,如果当前显示的时间范围是 H1、D1、W1 或 MN1,指标将在其计算中包括开放的时段。这是最新版本指标中的新设置。以前,计算不包括当前打开的时间段,这与 TheStrat 不一致。 该设置默认为 false,因此现有用户不受影响,除非他们选择打开它。 MaxMilliSecondsToCalculate 对于加载了大量历史记录(超过 10,000 条柱)的图表,这将限制指标必

Dark Dione is a fully automatic Expert Advisor for Medium term Trading. This Expert Advisor needs attention, in fact presents highly customizable. Dark Dione is based on Dark Breakout MT5 indicator, these trades can be manage with some strategies. (Write a review at market to receive my best settings for free!) Optimization experience is required to Download the robot. My tests are indicative, for best results it is necessary to study the user manual and create your settings. All the s
FREE
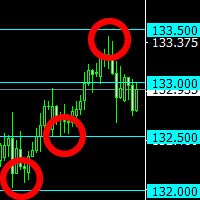
The indicator plots "round" levels, the step of which is specified in the settings. Perfect as an addition to any trading systems.
Very low price - only $30! Round levels often become price support or resistance. MT4 version: https://www.mql5.com/en/market/product/67245
This allows you to either fix a profit, or open a position after a breakdown of the level, work towards a rebound in price. The indicator will be an excellent tool in a trader's arsenal!

Funcionamento: O Painel Netting Panel RSJ funciona com qualquer ativo e em qualquer tempo gráfico . Ele funciona em contas do tipo " Netting " e " Hedge ", mas gerencia apenas uma posição por ativo, por isso o nome Netting. Se ele for executado em contas do tipo " Hedge ", ele fará o gerenciamento e proteção apenas da posição mais antiga , ou seja, da primeira posição que foi aberta por ele. Em contas " Netting " quando os botões " SELL " ou " BUY " forem pressionados, ocorrerá
FREE

Blended Candle Strength (BCS)
Any trading strategy, whether it is a continuation, trend reversal or breakout requires, in addition to analyzing the context of the price movement, confirmation signals for both trading entry and exit. And for that, it is necessary to analyze the formats of the candlesticks and fit them in known patterns to assist decision making. In addition to the context and format, two other important information to determine the strength of candlesticks are the size of the bar
FREE
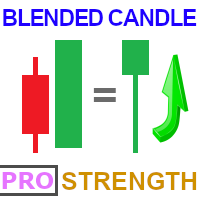
Blended Candle Strength PRO (BCS)
Any trading strategy, whether it is a continuation, trend reversal or breakout requires, in addition to analyzing the context of the price movement, confirmation signals for both trading entry and exit. And for that, it is necessary to analyze the formats of the candlesticks and fit them in known patterns to assist decision making. In addition to the context and format, two other important information to determine the strength of candlesticks are the size of the

ScriptBot é um robô multi estratégia desenvolvido para ser prático e robusto, com o ScriptBot você é capaz de criar diferentes estratégias próprias, instale até 51 indicadores do seu gosto e monte o seu próprio gatilho utilizando uma expressões lógica simples.
WARN: Este Expert esta desatualizado , um novo ScriptBot esta sendo reescrito do zero. Abaixo contaremos um pouco sobre a estrutura: Indicadores: ScriptBot não possui indicadores na sua codificação, isso significa que você tem total co
FREE

This indicator will draw a label above or below each candle based on Rob Smith's The Strat as they develop over time on your chart.
As price evolves, a candle can switch between three states. When the candle first opens, if it sits completely within the previous candles high and low, then it will start as a Type 1. As time moves on, if it breaks either the high or low of the previous candle, it will be come a type 2, and should the price action be volatile and directionless, it may then

The indicator - "ATR Line" determines the current trend and gives signals to buy (green arrow to the top) or sell (red arrow to the bottom). The indicator calculation is based on the deviation of the average price of the instrument from its average true range - ATR. The moving average of prices is used to reduce "market noise". If the main line of the indicator - "ATR Line" is lower the instrument price chart, then the market is in a "bullish" trend. If the main line of the indicator is higher t

The main application of the Security indicator is to generate buy and sell signals. Determining the market trend is an important task for traders. The Security indicator implements an advanced algorithm for visualizing the market trend. The main purpose of the indicator is to assess the market. Probably, almost every trader has dreamed of non-lagging MAs at least once. I have embodied this dream in my indicator. With this indicator, you can predict future values. The indicator is designed to det

The channel calculation algorithm uses the upper and lower boundaries that are separated from the price at a certain different distance. The setting is as simple as possible, apply to certain construction prices.
The indicator works best during periods of stable asset volatility, giving reliable signals on bounces and breakouts of borders and the middle line. Forex statistics show that 90-95% of the time the price moves within the range, so pullbacks are preferable to breakouts. Also, if techn

The Rocket Trend indicator is trending. The indicator draws two-color points connected by lines along the chart. This is a trend indicator, it is an algorithmic indicator. It is easy to work and understand when a blue circle appears, you need to buy, when a red one appears, sell. The indicator is used for scalping and pipsing, and has proven itself well. Rocket Trend is available for analyzing the direction of the trend for a specific period of time. Ideal for novice traders learning the laws o

Weighted average price indicator or VWAP. The well-known standard VWAP with the beginning of the day is added with the function of selecting the periodization. It can be calculated both every day and on other periods. Also the indicator allows to exclude the volume from the calculation, which will allow using it on the cryptocurrencies and forex. There is an alert for a VWAP price crossing. There are 1 and 2 standard deviation. Settings: Volume: turning volume on and off in the calculation mecha

This indicator creates the perfect RENKO for you to work with timeless types of Candles! Due to RENKO characteristics of timeless, the indicator adjusts trading arrows (otherwise they would be lost) and leaves them exactly where the negotiation occurred in Renko Candles! In addition, this indicator shows exactly the division between days, in order to make it clear to user where each trading session started and ended!
Important details: The automatically generated RENKO has an accuracy of up to

Midas is the acronym for Market Interpretation / Data Analysis System is a trade approach started in 1995 by technical analyst Paul Levine and later developed by Andrew Coles, PhD and David Hawkins. Learn more in the book MIDAS Technical Analysis: A VWAP Approach to Trading and Investing in Today's Markets , (I saw that it is possible buy via Amazon). The positive points in relation to the Midas-based indicators are the prediction of movement reversal points, the negative point is the subjectivi

The Vwap Bands Auto indicator seeks to automatically map the maximum market frequency ( automatic update of the outermost band ) and has two intermediate bands that also adjust to daily volatility.
Another tool from White Trader that combines price and volume, in addition to mapping the daily amplitude.
The external band is updated automatically when the daily maximum or minimum breaks the current frequency, and can be an input signal, seeking a return to the daily vwap.
Thus, in addition t

This indicator draws the prior Highs and Lows for multiple timeframes, and can display potential Take Profit and Stop Loss levels. In Rob Smith's # The Strat terms, these are potential entry points, or alternatively potential targets for open positions. I like to use them in both ways. On a lower timeframe, say 5 minutes to get a good entry on a daily or weekly level, and then as a potential target. Very small stops required giving an excellent risk/reward ratio. Key Features
- Levels from Hou

This indicator will draw patterns based on Rob Smith's The Strat as they emerge in real time on your chart.
As price evolves, TheStrat offers 18 distinct price action patterns that can help you get good entries in the market. Each pattern involves two or three candles, and this indicator will draw a bounding box around the candles and name the pattern. The indicator also shows when a potential setup is forming, known by stratters as an Actionable signal.
Candles
Each candle is defin

Do you already know the Start Midas indicator?
What about the Vwap Standard Deviation indicator?
And I need to speak again in the book MIDAS Technical Analysis ...
The Start Midas SD Channel indicator combines the two in one, bringing the practicality and efficiency of Midas with the statistical calculation of the standard deviation.
All of this with the practicality of the White Trader Start indicators, where you can plot the indicator and move them on the screen using keyboard shortcuts

Here we have the Start Midas Fibo Bands , I confess that it is an indicator that excited me enough to operate because I was able to find more defined rules. Well, the indicator has the functions of the other indicators of the Start line , which is a possibility to plot several Midas on the screen, you can move the anchor point using keyboard shortcuts and use the legend to differentiate one anchor from another. The rules that I have analyzed for my possible setup are recommended to the entry, st
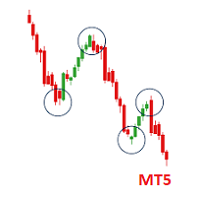
Powerful Price Action Engulfing Doji Robot MT5 version Package Contains: (Price includes both versions) SET files in Comment section. 1. Powerful Price Action EA Advanced Version with NomadTrader Money Management System: --Full EA with all adjustable settings and parameters to tweak or optimize. --It uses the NomadTrader Money Management system with Dynamic exit strategy based on Price %(percent) based Stop loss, Take Profit and Adjustable Time Filter to 1 minute preciseness, all parameters ar

Currency Chart is a MT5 overlay indicator for 8 major currencies including AUD, CAD, CHF, EUR, GBP, JPY, NZD and USD. The chart represents one currency average prices relative to the others. The currency chart makes us easy in evaluate direction, trend, strength, support and resistant levels or even a reversal level of the currency. Good for medium-term and long-term trading styles. Chart type: Candlestick chart, bar chart or line chart. Chart timeframe: Same as MT5 timeframe. Built-in indicator

The Fight Knight bot works on both Netting and Hedging account types. The Expert Advisor can be launched on any hourly period, on any currency pair and on the server of any broker. It is recommended to work on liquid Forex pairs, with a low spread, and use VPS. Fight Knight is high frequency trading. You can start using it with $ 100 and 0.01 lot. The expert system traverses the entire history and all currency pairs with a single setting.
During testing, the spread can be adjusted. The lower t

CAPITARC`s NAKED TRADER Expert Advisor for MT5 Naked Trader -is a professional expert advisor used by our investment firm it is based on pure price action. This product is looks at all the price action patterns, candles and possible trend reversal formations of the ever changing markets, while the usual experts are based on one or two indicators, this expert trades naked! Literally! Pun Indented! FOREXSIGNALS uses a similar robot for their INTRADAY trades. This allows the expert to adapt to

One time offer: Only the first 10 copies of this EA will be sold at the current price. Next price: $150
HunterFX is a 100% automatic trading robot with REAL account results! Watch signals here https://www.mql5.com/en/signals/968946?source=Site+Search
Unfortunately, is the world of trading there are many scams and manipulation, fake back testing and more,
Therefore, make sure you only BUY a ROBOT who's been CONFIRMED by signals in MT5: Back test of over 9 years! https://yout

Помощник для торговой системы SystZ . Чертит трендовые линии по соседним экстремумам зигзага. Условие для линии сопротивления - правый должен быть ниже левого. Для линии поддержки - правый выше левого. Не допускается, чтобы между экстремумами, по которым проводится трендовая линии были другие. Экстремумы, удовлетворяющие этим условиям, отмечены символом фрактала. Закрытие свечи за линией - сигнал для открытия позиции.
FREE

Trading has never been easier. Simplify makes trading effordless. Your only work here is to buy it, attach to the EURUSD on H1 , set your risk and wait for results. Strategy was developed by genetic algorithms and of course tested by advanced robustness tests and delivered to you. It is great addon to your portfolio or as standalone strategy.
Benefits for you Amazing Plug & Play system - studying configuration and finding the best optimization is history. This work is included in the pric

CAPITARC`s RSAS Expert Advisor for MT5 RSAS MT5 -is a professional expert advisor used by our investment firm it is based on price action and Relative Strength Index (RSI) indicator. This product is with dynamic overbought and oversold levels that automatically adapts to the ever changing markets, while the standard MT5 RSI maintains levels static levels and do not change. This allows the expert to adapt to the ever-changing market without the need to constantly optimize, just make sure yo
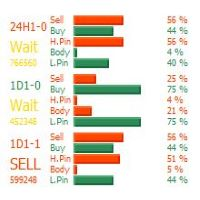
Bar Direction, This indicator is created for MetaTrader 5, It will show you strength of bar directions which you can add more options of bar as adjustable requirement such as Bar Timeframe, Bar Shift, Bar Period and also you can set true or false for Signal Alert to your Popup, Email or Push Notice and more of more you can set to show guideline for entry point according to your adjustable options also Ask-Bid and Spread Showing. It will be your assistance for reading bar strength direction easil

目前全额购买折扣 中 ! 任何交易者的最佳伙伴! 该指标具有独有的支撑阻力计算方案, 是独一无二的交易系统 。 指标特性 想象一下,如果您能提前精确的判断出重要的交易支撑阻力区域以及点位, 您的交易将如何改善?基于独特的计算方式,我们可以看到波段走势中清晰的支撑和阻力。将过去重要的支撑阻力区域经过独特的计算,将关键位置在图表中显示. 本指标支持周期设置,可以设置其他周期. 大周期重要支撑阻力,以及小周期辅助判断可以在同一图表中完成.
基本显示 显示支撑阻力的价格标签。 显示实时的支撑和阻力。 显示历史的支撑和阻力.
基本设置 设置支撑阻力计算的周期 。
警报设置 接近报警 碰触报警 报警弹窗 报警邮件发送 发送推送警报 颜色设定 可以设置不用的实时支撑阻力颜色 可以设置不用的历史支撑阻力颜色 可以设置价格标签颜色 可以点击价格标签或者点击显示区域改变区域填充方式 任何问题,相互交流

Baze Zone is a configurable combination of tools/levels (MT4 version also available at MT4 section): - Fib levels, 14, 23,50 - Fib Extension 27,61 - Pivot Points - Adds boxes to indicate range 'breakout' - ATR Range - Prev Daily Candle Range - Shortcut keys to hide/show the lines (configurable) In short, use this tool to add some extra zones to you fib tool. And use the extra's in combination with the shortcut keys to keep your chart clean. You can drag the lines for the Fib Levels.
The name o

TRADING STRATEGY
Keep It Simple and Smart (KISS principle) and not stupid! This automatic expert advisor enters a trade in the DOW JONES exactly at 9 a.m. EST i.e. 30 minutes before US market open to make 10 points in profit for a continuous income stream. This is a professional trading strategy and not a get-quick-rich scheme. The trade direction (long or short) is determined by a simple algorithm based on every day market observation and thorough backtesting. For all trades to win (since 1/

FX Adjutant Based on Price Action Signals Can be attached to any Timeframe Trades frequently (depending on Timeframe) makes profit every month Adjusts position Size accordingly to the risk you want to take Recommended Account Type: ECN or Raw Spread (Brokers: ICMarkets Raw Spread or Roboforex ECN) Recommended Leaverage: 500:1 Recommended Account Size: 2000 €/$ (min. Account Size: 1000 €/$)

Average Cost Price helps you keep track of your open positions on the chart. In doing so, it provides lines and explanations on the chart. This line is the average price value of the Bid or Ask.
If you wish, you can see the average cost price by adding SWAP and COMMISSION to the average price value.
*** You can add commission manually per lot.
The legend below the Average Cost Price line gives you: * Average Buy or Sell price line, * Swap Amount, * Commission Amount, * Total Profit or Loss a
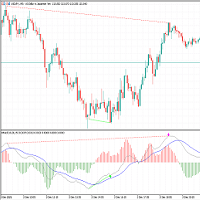
The Macd Signal with DIF line, DEA line and colored Macd Histogram. The Moving Average Convergence Divergence Indicator (MACD) is both a trend–seeking and momentum indicator which uses several exponential moving averages set to closing prices to generate trading signals. The Gray Line is the DIF line. The Blue Line is the DEA line. Version 2.0: New features are added: The indicator can show Classical bearish divergence, Classical bullish divergence, Reverse bearish divergence and Reverse bullish
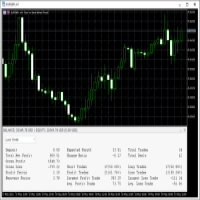
This Trading Statistics Indicator gives you an overview of your trade statistics for a selected period. You can set different periodsand filter for Symbols and magics to analyse your trading success. You can also create charts for Balance/Equity, MFE and MAE Periods: Total Time Today Yesterday This Week Last Week This Month Last Month This Year Last Year This Trading Statistics Indicator is still work in progress. In the next versions I will add telegram and email notifications and some more

Dark Support Resistance is an Indicator for intraday trading. This Indicator is programmed to identify Support and Resistance Lines , providing a high level of accuracy and reliability.
Key benefits
Easily visible lines Only the most important levels will be displayed Automated adjustment for each timeframe and instrument Easy to use even for beginners Never repaints, never backpaints, Not Lag 100% compatible with Expert Advisor development All types of alerts available: Pop-up, Email, Push

Hyper DM, Moving Distance from Moving Averages is an indicator that allows you to define the distance in points of the upper and lower bands in relation to the moving average in the middle.
Its operation is simple, it has configuration parameters of the moving average of the middle and based on it and the defined distance parameters of the upper and lower bands, it is plotted in the graph.
FREE
MetaTrader市场是独有的自动交易和技术指标商店。
阅读MQL5.community用户备忘更多地了解我们提供给交易者的独特的服务:复制交易信号,自由职业者开发的自定义应用程序,通过支付系统完成的自动付款和MQL5云网络。
您错过了交易机会:
- 免费交易应用程序
- 8,000+信号可供复制
- 探索金融市场的经济新闻
注册
登录