适用于MetaTrader 5的新EA交易和指标 - 171

Indicator works with two moving average, when this moving averages cross, then change of colors. You can change the color both moving average and chage all setup if you want, like a native moving average . If you want to put this indicator, all buffers are disponible and their are work fine. In case of doubt or any question don't exitate to write me, I'll read and aswer all the question.

Эксперт торгует по сигналам индикатора SystZ Trend Lines . Входные параметры: Take in atr, 0 - do not use a take profit - размер тейк профита по ATR (50) , рассчитанному на текущем таймфрейме. Если значение параметра равно 0, то не используется; Stop in atr, 0 - do not use a stop - размер стоп лосса. Если значение равно 0, то не используется; Risk factor, volume eq Equty*Risk factor/1000 - используется для расчета размера рабочего лота, который вычисляется как Эквити*Risk factor/1000. Нап
FREE

Sends price alerts conveniently to your Android/IOS device. Make sure push notifications are enabled in Metatrader settings and the PC/VPS is online 24/7. Price levels are updated automatically, but you can modify them in global variables, if needed. Suitable for any market instrument, but if notifications are too frequent, increase point value of the indicator parameter.
FREE

With my custom built formula, you can visualize the market similar to displaying a heat map; with color showing at a glance the strength of the current trend, and the bar length showing the intensity of current movement. In more detail: Length of the histogram bar shows the average bar size of the last period, and color (from red to blue) shows the strength of upward or downward movement. Purple zones can indicate a change into a new trend. Bar period is adjustable so as to measure larger or sm

All words I spent time to describe this EA trading system does not worth a download that you can do to test this expert advisor.
MC Datrix EA is a trading system that combines trend filter, trigger points with specific conditions, smart takeprofit and stoploss calculations, a break orders system based on smart reversal trend.
Trend filter was developed with TRIX indicator and also can be enabled or not.
Trigger points were specially projected with MACD indicators values and signals. Trigger

" A successful trading means being able to master the art of timing, the art of execution and the art of protecting your capital in a very simple and faster way ". HermanGhost Manager is the most powerful tool that's actually designed to help you win in terms of executing different operations BUY,BUY STOP, BUY LIMIT, SELL,SELL STOP, SELL LIMIT, STOP LOSS, TAKE PROFIT, BREAKEVEN, TRAILING STOPS, all can be executed in seconds.
features : The intuitive interface One time configuration One click
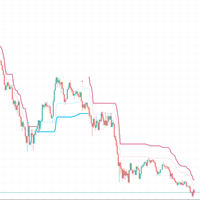
Using ATR to judge the trend, the dotted line is a short-term trend, and the solid line is a stable trend
Set different parameters according to different products. In most cases, please use the default parameters
Time cycle 5 minutes 15 minutes 1 hour
This indicator performs well in monetary products and gold
Index without future function
The entity part of the K line exceeds the entity trend part, which represents the trend conversion. Please wait for the K line to finish
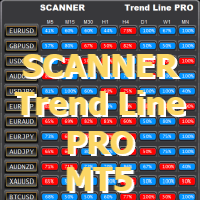
使用趋势线PRO指标并设置由优化器实用程序创建的文件 您可以下载其他程序:这里
扫描仪设计用于接收从M5到MN1的所有对和时间帧上的趋势线PRO指标的新信号
为了使扫描仪工作,您必须有一个指示器。 扫描仪趋势线专业的主要优点是能够使用一个单独的设置文件为每对和时间帧。 您可以在附加扫描仪窗口中自动调整、更改和保存每对的设置。 您还可以使用由特殊趋势线优化器实用程序开发和优化的现成设置文件。 扫描仪允许您仅使用所需的设置,从而加快其工作速度。 扫描仪是手动交易和测试新策略所必需的。 只需在您的计算机或VPS上的任何图表上安装Trend Line PRO SCANNER,它就会通知您一个新的信号,并向您的手机上的移动版Meta Trader发出警告或短信,无论您身在何处。
如何使用扫描仪: https://www.mql5.com/en/blogs/post/749265
1. 在使用之前,加载所需字符的历史记录(按 Ctrl+U) 2. 使用优化器实用程序为您要交易的每对和时间帧优化和保存参数 3. 首先,在图表上安装趋势线PRO指标 4. 之后,将扫描仪添加到相同的图形
FREE

市场真的很喜欢整数,它们通常在下跌的市场中充当支撑,或在价格上涨时充当阻力。 该指标旨在以整数值绘制价格水平。它会自动执行此操作,但您也可以选择覆盖它并确定您希望看到的级别。 一轮水平可以像 10 步一样简单,例如 10、20、30 等,或者如果您从事外汇交易,您可能希望看到 0.1 或 0.01 的变化。 该指标绘制两类线,Major 和 Minor,每类都有不同的格式。这使您可以同时查看两个不同电平变化之间的变化。 警报
该指标包括当价格在可配置距离内时在主要、次要或两个价格水平发出警报的能力。 自动设置 默认情况下,该指标将为主要价格和次要价格确定适当的水平。它使用可配置的 DensityIndex 设置来做到这一点,该设置控制您希望随时在屏幕上看到多少行。 如果您设置自己的缩放比例,使用 MajorGap 和 MinorGap 设置,您仍然可以通过使用 ReduceAtScale 设置来获得限制在屏幕上绘制的线数的指标。 请查看屏幕截图以更清楚地了解此功能。
设置 基本配置 重大差距 当设置为 0.0 时,指标会自动计算出合适的刻度 小间隙 当设置为 0.0 时,指标会自动计

Aggression Wave PRO 是一个指标,用于监测买卖谈判的侵略量的分歧、强度和连续性。 Agrression Wave PRO 具有允许您查看超过当天累积增量的功能。
注意:该指标不适用于没有攻击类型(买入或卖出)的经纪商和/或市场。加密货币和外汇不提供此类信息,也就是说,它不能与它一起使用。
手术
可以设置音量类型: 真实交易量(在此模式下,每笔资产交易的交易量都会被计算在内) Ticks Volume(在此模式下,将统计资产的交易数量。)
可以定义计算的开始时间: 当前日期 最后一天 LAST_TWODAYS LAST_FOURDAYS 上个星期 上个月 LAST_6MONTHS 去年 LAST_2YEARS ALL_AVAILABLE_DAYS
可以配置信号线: 方法:SMA / EMA / SMMA / LWMA

This scalper helper helps you manage your trader by placing AUTOMATIC stops and takes. When you enter a position and the market quickly turns against you, it's pretty boring isn't it? but with this helper your StopsLoss and TakeProfit will be AUTOMATIC, just configure how many pips you want and that's it. Besides, the helper has AUTOMATIC BreakEven, you just choose the amount of pips you want to place, and finally it contains a stop protector, whenever a candle closes in profit in your favor, it

The Donchian Channel Channels are among the most popular tools of technical analysis, as they visually convey to the analyst the limits within which most price movement tends to occur. Channel users know that valuable information can be obtained at any time, whether prices are in the central region of a band or close to one of the border lines.
One of the best known techniques to explore these concepts is Bollinger Bands. However, John Bollinger was not the only one to research the application
FREE

Two Factor Customizer is an fully custimizable Expert Advisor. You can choose multiple parameters that act as a trigger to execute a buy or sell order. Additionally you can choose a previous step (Two Factor), where you can also combine multiple parameters previous to those configured for the buy and sell orders. The parameters available to configure to your liking are: lots, stop loss, take profit, dynamic lots, order type,timeframe. Indicator combinations for triggering orders and for precondi

You can easily draw horizontal ray line for the open, high, low and close price levels of any candle with this indicator. Parameters Mode Key + click - you should press o, h, l or c keys on the keyboard first, then click on any candle. Mouse hover + click - just move your mouse and point to any candle, then press o, h, l or c keys on the keyboard. Note: in both modes, you should point the horizontal center of the candle for accurate selection. The vertical position of the pointer is irrelevant.

The indicator draws the daily open line. Parameters
GMT shift (minutes) The time zone could be shifted. The value is given in minutes. Draw closest regular bar's open price This parameter could fine-tune the open price line when using GMT shift. Yes - Draw the open line based on the current chart period's closest regular bar No - Draw the open line based on the M1 chart's closest bar. Let's assume that your shift is 10 minutes, and you are using H1 chart and the first candle in every day is 0
FREE

Simple indicator used in technical strategies to analyze tops, bottoms and reversal or continuation points. Developer information:
Line values and colors:
Buffer 0 : ZigZag line value;
Buffer 1 : ZigZag color value;
Buffer 2 : Median line value;
Buffer 3 : Median color value; Buffer to get the values of each top and bottom. Buffer 4 : Top value;
Buffer 5 : Bottoms value;
Buffer that returns the type of the last direction.
Buffer 9: 0 = Not updated, 1 = High, -1 = Low;
This indic
FREE

This indicator uses support and resistance, volume and some special formula to calculate the volume to filter the candles. If the volume reaches a specific value, And at the same time, Candle breaks the support/resistance line, There would be a signal and we can enter the market. Signals appear when the current candle closes. then you can enter the trade when a new candle appears. Please don't forget to follow your money management plan.
MT4 Version Support/Resistance Breakout MT4 : https:/

Trendy Stock is a price following indicator that uses Stochastic to show when the price is out of the oversold or overbought areas. The algorithm allows you to stay longer in a trend where the bulls or bears are in control. The indicator changes color immediately the price exits oversold/overbought state. In short, the downtrend [red] bars start to paint when the buying pressure decreases while the uptrend [green] bars form as the buy pressure kicks in. For MT4 version, follow :: https://www
FREE

Ilon Clustering is an improved Ilon Classic robot, you need to read the description for the Ilon Classic bot and all statements will be true for this expert as well. This description provides general provisions and differences from the previous design.
General Provisions. The main goal of the bot is to save your deposit! A deposit of $ 10,000 is recommended for the bot to work and the work will be carried out with drawdowns of no more than a few percent. When working into the future, it can gr

Hello!
Tired of constantly subscribing to other people's signals and earning pennies?
Want to manage your own trading?
Then you are on the right page!
It's very simple ==> buy my indicator ==> put it on the chart ==> blue arrow - buy ==> red arrow - sell. Even an infant can do it!
A handy histogram to trace the market direction.
Are you still here? Then read the parameter descriptions and take a look at the screenshots: Stoch K period - period for calculating the% K oscillator line. Stoch

"Super Wave MT5" is an adaptive expert advisor based on band trend. It has a built-in unique price tracking algorithm , created specifically for trading EURUSD.
Pending orders for each price retracement. Every transaction will analyze the current price trends and fluctuations.
Sold at 60% the original price , $239 USD only 2 weeks ! the original price is $399 USD . After purchasing, please leave me a comment or message, I will send the private telegram group to you. Important informat

This indicator creates the perfect RENKO for you to work with timeless types of Candles! Due to RENKO characteristics of timeless, the indicator adjusts trading arrows (otherwise they would be lost) and leaves them exactly where the negotiation occurred in Renko Candles! In addition, this indicator shows exactly the division between days, in order to make it clear to user where each trading session started and ended! Furthermore, the following indicators were added, giving you bigger analysis p

Delta Aggression Volume PRO is an indicator developed to monitor the strength and continuity of the aggression volume of sell and buy negotiations. Note: This indicator DOES NOT WORK for Brokers and/or Markets WITHOUT the type of aggression (BUY or SELL). Cryptocurrencies and Forex do not provide this type of data, that is, it does not work with them.
O Delta Agrression Volume PRO has features that allow you to view beyond the delta volume of the day.
Operation
Multi symbols (those who provid

Tom DeMark developed TD Sequential by hand, through a process of trial and error, in the 1970s. It never ceases to amaze me how something originally created to analyze daily price data can be applied so effectively, more than thirty years later, to any time frame—from one minute to one year—and to any market. The indicator has two components: TD Setup, which relies on momentum to define price ranges, and TD Countdown, which is trend based, and looks for low-risk opportunities to fade establishe

Put to work now Two brother EJ12 this incredible EA was carefully made and tested for the EUR / JPY market exclusively in the 5m time frame, the purpose of this EA is to keep your capital safely behind this incredible EA and your account never reaches to $ 0.
This EA can be used with little capital $ 100, I have tested it with $ 50 and it works perfectly but it is advisable to start with a minimum of $ 100, I recommend using a VPS. You can also work a higher capital, you just have to raise the

Put to work now Two brother AU11 this incredible EA was carefully made and tested for the AUD / USD market exclusively in the 5m time frame, the purpose of this EA is to keep your capital safely behind this incredible EA and your account never reaches to $ 0.
This EA can be used with little capital $ 100, I have tested it with $ 50 and it works perfectly but it is advisable to start with a minimum of $ 100, I recommend using a VPS. You can also work a higher capital, you just have to raise the
MAs Crossover Dashboard Pro uses the value of Moving Average indicator. The periods of 2 MAs can be adjusted via the Edit boxes of this dashboard. The monitoring pairs will be selected by adding to the Market Watch (no need to set prefixes or suffixes) , you can monitor many pairs as you like. This dashboard will check almost popular time frame (M1,M5,M15,M30,H1,H4 and D1). The colors can be customized. The parameter of MAs can be set at the input. Crossover signal can be sent to you screen, yo

A ‘Supertrend’ indicator is one, which can give you precise buy or sell signal in a trending market. As the name suggests, ‘Supertrend’ is a trend-following indicator just like moving averages and MACD (moving average convergence divergence). It is plotted on prices and their placement indicates the current trend. The Supertrend indicator is a trend following overlay on your trading chart, much like a moving average, that shows you the current trend direction. The indicator works well in a tren

Find My Rules It is an fully custimizable Expert Advisor. You can choose multiple parameters that act as a trigger to execute a buy or sell order. The parameters available to configure to your liking are: lots, stop loss, take profit, dynamic lots, order type,timeframe. Indicator combinations for triggering orders and for preconditions (two factors) are: RSI, EMA1, EMA2, EMA3, EMA4,MACD. INPUTS PARAMETERS: OPERATION OPTIONS magic number = number for identification lots = lots for operati

*** NOVIDADE: Takeprofit e Stoploss com valores fixos em pontos ***
*** Comece a negociar na bolsa brasileira de forma automática ***
O Ichimoku Ninja EA é um robô de negociação para Mini-Índice (WIN) e Mini-Dólar (WDO) , negociados na bolsa brasileira Bovespa. O robô opera conforme tendência, com base no indicador Ichimoku Kinko Hyo , de acordo com sua dinâmica. Ainda, os alvos de Takeprofit e Stoploss podem ser configurados conforme valores fixos ou a Banda de Bollinger , de acordo com o pe
Any MA
Any Moving Average draws a moving average of * any indicator in a sub-window. Many Indicators included with MT5 are supported by default. You can add custom indicators as well. Settings Name Description Timeframe Select timeframe for calculation Source Indicator Select Indicator Custom Indicator Name Enter Custom Indicator Name ( when Source Indicator is set to Custom) Indicator Settings Source Indicator parameters ( separated by comma ) Moving Average Settings Moving Average para

*** Comece a negociar AÇÕES na bolsa brasileira de forma automática ***
O Samurai Canarinho EA é um robô de negociação para Ações na B3 - bolsa brasileira Bovespa. O robô opera conforme tendência, com base no indicador Ichimoku Kinko Hyo , de acordo com sua dinâmica. Os alvos de Takeprofit e Stoploss podem ser configurados conforme a Banda de Bollinger . É possível configurar também um sistema de trail, conforme a dinâmica da Banda de Bollinger. Um percentual configurável pode ser estab

使用此EA可以通过币安交易所的API连接到MT5交易端,利用MT5强大的量化功能实现交易策略的回测。 操作方法: 1、首先 必须 把( http://api2.0.mt5.vip 、 https://fapi.binance.com )这两个 地址 填写到:mt5——工具——选项——EA交易下的WebRequest列表中,否则所有数据无法同步。 2、在导航栏找到EA,双击之后添加币安的API KEY ,保存后KEY自动保存; 3、KEY保存后会出现交易面板,通过MT5下的订单可以实时展现在面板,同事也可以监控币安交易所是否有同样的订单; 4、交易面板只展示订单的总持仓,请仔细核对,以防止漏单; 5、API KEY会自动保存在本地,第二次打开后无需重复输入; 6、目前只能支持BTCUSDT、ETHUSDT、LTCUSDT合约产品 7、最小交易量以币安的最小交易量为准; 8、币安KEY是存储在本地,不会上传到任何第三方,请放心使用; 9、如果想更换KEY ,请直接在EA内修改即可。
FREE
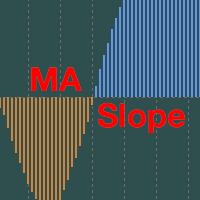
Moving Average Slope for MT5 is an indicator which displays the Slope of a Moving Average . Finding the Slope of a Moving Average is a great way to determine trends and ranges of the market. Moving Average Slope can be used for manual trading or built into an Expert Adviser for automated trading. It is presented as a histogram which you may change the colors for positive and negative results. Positive results indicate an upward trend of the market.
Negative results indicate a downward trend of

The Official Automated Version of the Powerful Indicator PipFinite Trend PRO EA Trend PRO trades the signal of PipFinite Trend PRO and manages the trade depending on the user's preference.
The EA includes many customizable features that can further enhance the Trend PRO trading strategy.
Features like Entry and Exit Filters, Higher Timeframe Filter, Stoploss, Takeprofit, Breakeven, Trailing Stop, News Filter and MORE!
The Innovative Solution
EA Trend PRO was created to make your trading more

MACD 日內趨勢 PRO 是通過改編自 Gerald Appel 在 1960 年代創建的原始 MACD 而開發的指標。
通過多年的交易,觀察到通過使用斐波那契比例更改 MACD 的參數,我們可以更好地呈現趨勢運動的連續性,從而可以更有效地檢測價格趨勢的開始和結束。
由於其檢測價格趨勢的效率,還可以非常清楚地識別頂部和底部的背離,從而更好地利用交易機會。
特徵 MACD 日內趨勢 PRO 指標適用於任何貨幣對、任何時間範圍以及 Renko 圖表。 可以通過選擇 6 種模式來設置趨勢檢測速度: 最快的 快速地 普通的 減緩 最慢
資源 它有 6 個可配置的警報: MACD回調信號線 MACD穿越信號線 MACD穿過零水平 信號線過零電平 MACD 變化趨勢顏色 信號線變化趨勢顏色 對於每個警報,可以配置: 彈出 聲音(有 13 種聲音可用。) 智能手機通知 彈出窗口和聲音 彈出窗口和智能手機通知 聲音和智能手機通知 彈出窗口、聲音和智能手機通知
與智能交易系統或其他指標集成 有 8 個緩衝區可用於訪問和與專家顧問或其他指標集成,即使關閉警報,它們也會被填滿,它們是: 緩衝

介绍 这是一个夜间交易的EA,在21:00-22:00之间交易 长期实盘是盈利的 每次只交易一单,不会造成大的亏损 每一单都设置止损和止盈,不使用网格、马丁,也不使用其它高风险的资金管理 可同时用于多个币种 默认自动设置时区
特性 交易图表:M15 可交易的货币: EURUSD,GBPSUD,USDCAD,USDCHF,AUDCHF,EURGBP,EURCHF,USDJPY,EURCAD,EURAUD,GBPAUD,AUDJPY,EURJPY,GBPJPY,AUDUSD 最小入金:100USD 推荐经纪商:IC Markets,Peperstone,Darwinex,EXNESS等低点差的平台 信号 MQL5 Live : https://www.mql5.com/zh/signals/1021524
参数
MagicNumber 魔法数 UseMM 是否使用资金管理 LotFix UseMM == False时,固定手数 PercentageMM UseMM == True时,按比例
StartHour

枢轴水平是每个市场都认可的完善的技术水平。 该指标将在图表上为任何符号绘制当前的季度、月度、周度、日度和四小时支点。您还可以显示每个时期的支撑和阻力水平,并选择从水平 1 到 4 显示哪个水平。 从以下选项中选择枢轴类型: 标准 卡马里拉 丹麦 伍迪 斐波那契数列 请注意,根据原始规格,DeMark 枢轴具有单一的支撑位和阻力位。 如果线已被价格触及,指标墙会改变绘制线的方式。这可能非常有帮助,一旦触及,支撑线或阻力线的强度就会大大降低。 您可以选择显示每个时间段的预测枢轴水平。这将使用与正常枢轴相同的计算,但将适用于当前不完整的时间范围。因此,最好在那个时期结束时使用它,此时价格已经涵盖了其范围的大部分。
设置
所有设置的详细信息都在单独的博客文章中,可在此处获取: https://www.mql5.com/en/blogs/post/746511
这是一个高度可配置的指标,因此您可以按照自己的喜好让它工作。

外汇交易成功的关键 是纪律、耐心和明确的优势,正如我们独特的真实交易量分析。 这就是我们10年来的外汇交易经验,所有这些关键因素都在斯坦因投资专家顾问(SIEA)系列中得到了总结。
SIEA ZEN 提供了一个非常平衡的风险回报率,并在所有的市场情况下轻松存活--即使是最关键的情况,如科罗纳、英国脱欧等。 该系统的稳健性除了提供令人敬畏的性能,还为其用户提供了更重要的 "安心"。这就是为什么我们叫它ZEN。
获取更多信息,如常见问题、回测报告和正确的夏令时/GMT设置提示,请参见我们公开的 SIEA常见问题 .
交易风格
SIEA ZEN 以8种主要货币美元、加元、欧元、瑞士法郎、英镑、澳元、新西兰元和日元为基础,交易所有28个交易对。 我们独特的交易量分析决定了市场的不平衡和它们的激烈程度,以发现反向进入的机会。
SIEA ZEN 在每个月末关闭所有的头寸,并在下个月月初开始新的周期。 通过这种方式,我们将实现令人敬畏的低回撤,同时利润仍旧突出。平均交易时间仅为4天。
新闻处理
SIEA ZEN 有一个内置的新闻过滤器,可以在央行新闻事件前后停止新的交易头寸。 所有
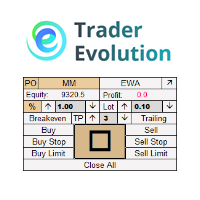
" Trader Evolution " - A utility designed for traders who use wave and technical analysis in their work. One tab of the utility is capable of money management and opening orders, and the other can help in making Elliott wave and technical analysis.
Manual (Be sure to read before purchasing) | Version for MT4
Advantages
1. Trading in a few clicks. Immediate and pending orders are available in the panel
2. Money management. The program automatically selects the appropriate lot size
3. Simplifies

The Volume Weighted Moving Average (VWMA) is calculated based on Prices and their related Volumes giving importance to those candles with more Volume. During periods of almost equal volume distributed along the observed period (commonly, in low volume periods) the VWMA will be graphically similar to a Simple Moving Average. Used along other moving averages a VWMA could be used as an alert, filter or whatever your imagination could think of...
HOW TO "READ" THIS INDICATOR As any Moving Average.
FREE

The main goal of the bot is to save your deposit! A deposit of $ 10,000 is recommended for the bot to work and the work will be carried out with drawdowns of no more than a few percent. When working into the future, it can grow several times and amount to several percent. Of course, you can reduce the deposit and thus get the bot more risky, but this is not recommended. Normal rates for a bot are 3-5 percent per year with a drawdown of 0.5%. There is a way to increase the annual percentage! To

The ease of observing the market anytime, anywhere
Exchange chart is the software for the professional trader to follow what happens in the financial market in real time. Developed by those in the market, it keeps up with the latest research on successful traders who show that the best, the ones who get consistent results use few types of chart configurations, in several different symbols.
All market watch passing through your chart
Exchange chart makes all the symbols configured by you in th
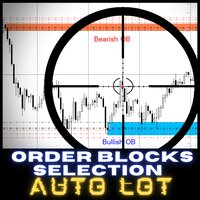
ONLY 4 COPIES FROM 10 TO $60 NEXT PRICE $95 Order Block Selection AUTOLOT is a great tool for all those traders who like to have control in their hands and especially to operate with high precision, thanks to our new control panel you will be able to select the candle where you want to choose the Bullicsh OB zone o Bearish OB
The objective of this Expert Advisor is that you can select Bullish Order Blocks (shopping area) or Bearish Order Block (sales areas) at any time, it will have 3 input pa

//////////////////////////////////////////////// //////////////////////////////////
An improved version of the standard Bulls Power and Bears Power indicators.
Now it's two in one.
The setup is simple - you just need to specify the period. It is also very easy to understand the readings of this indicator, a signal above zero is a buy, and below it is a sell.
//////////////////////////////////////////////// ///////////////////////////////////
I hope this indicator will be very useful to you
FREE

RSI Entry Points is the upgrade of the standard RSI indicator to avoid lagging. Indicator draws the clouds and the arrows to have clear picture where price is and what to wait for. Why standard RSI is lagging? because mostly we do not use it correctly and it is with very weak visual flexibility, less informativity. With my current upgrade I tried to Fix both problems same time and I got much better results and more exact entries than standard RSI has. To make yourself sure check out the screens

ScriptBot is a multi-strategy robot developed to be practical and robust, with ScriptBot you are able to create different strategies of your own, install up to 51 indicators of your liking and build your own trigger using simple logic expressions.
AVISO: This Expert Advisor is outdated , a new ScriptBot is being rewritten from scratch. Below we will tell you a little about the structure: Indicators: ScriptBot does not have indicators in its coding, this means that you have full control of
FREE

An improved version of the standard Standard Deviation indicator.
It is now a responsive and smoothed line.
The setup is not straightforward - but I hope you can do it.
It is very easy to understand the readings of this indicator, the meaning is the same as that of the usual Standard Deviation.
//////////////////////////////////////////////// ///////////////////////////////////
I hope this indicator will be very useful to you in successful trading.
Good luck.
FREE

//////////////////////////////////////////////// //////////////////////////////////
An improved version of the standard Average True Range indicator.
It is now a responsive and smoothed line.
The setup is not straightforward - but I hope you can do it. It is very easy to understand the readings of this indicator, the meaning is the same as that of the standard Average True Range.
//////////////////////////////////////////////// ///////////////////////////////////
I hope this indicator will
FREE
"Crazy Break MT5" is an adaptive expert advisor based on price breakthrough strategy. It has a built-in unique price tracking algorithm.
Every transaction will analyze the b reakthrough space and trading position. Buyer and seller two-way pending orders.
For the last month,just $2 99 dollars ! The next price increase is $399 !!!
Important information Mainly operate with EURUSD/GBPUSD within the H1 time frame. If you want to perform verification and evaluation, it is recommended that

This indicator shows on the current day some lines of interest, such as maximum, minimum and closing of the previous day, as well as the opening, maximum and minimum price of the current day.
It can also show the GAP (closing of the previous day and opening of the current day) and projections of the amplitude of the previous day, according to the value you choose in the multiplier.
Oh, I was going to forget. It is also possible to determine the time frame, which is daily by default.
If this i
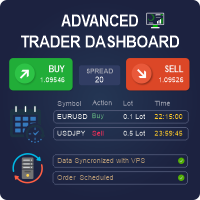
Powerful and beautiful trading panel helps you in scheduling or placing multiple trades based on your presets in a single click. It is designed to execute orders immediately or schedule trades in advance to be executed at certain time using multiple filters to avoid non favorable market conditions (wide spread, reduced leverage etc.). Additional functionality developed to sycnhronize two instances of the expert over the internet (Master - Slave Mode), which means trader can open the panel in loc

该指标具有独有的支撑阻力计算方案 , 是独一无二的交易系统 。 指标特性 想象一下,如果您能提前精确的判断出重要的交易支撑阻力区域以及点位,您的交易将如何改善 ? 基于独特的计算方式,指标通过对趋势进行分析,通过对当前的支撑阻力进行分析后,得出现在重要的支撑阻力以及做单方向,计算得到的止盈和止损建议,以及关键的进场点位建议. 在交易策略中,进场点位和趋势方向同样非常关键,前者点位不同所面临的风险是不同的,止损的点数也是成倍放大. 本指标分析了当趋势进行后,暂时进入调整时间,分析了此时的重要进场支撑阻力并计算风险控制一定的止损,和止盈,合理的盈亏比.
本指标支持周期设置,可以设置其他周期. 大周期重要支撑阻力,以及小周期辅助判断可以在同一图表中完成.
基本显示 显示历史支撑阻力的价格标签。 显示历史进场位置大概建议范围,以及止盈和止损建议,目标预测. 显示当前方向的判断,以及进场点位,以及止盈止损建议 . 基本设置 设置计算的周期。
警报设置 接近报警 碰触报警 报警弹窗 报警邮件发送 发送推送警报 颜色设定 可以设置不用的实时支撑阻力颜色 可以设置不用的历史支撑阻

Please, if you like this AE, I would appreciate it if you could rate it with 5 stars ️ ️ ️ ️ ️ THANK YOU!!
Expert Advisor based on the signal generated by two MACDs (Moving Average Convergence Divergence), which can trade on different time frames (M1, M5, M15, H1, H4, etc.) The Expert has the following variables: >>>>>>>>>>>>>>>>>>> Magic number Slippage >>>>>>>>>>>>>>>>>>> Stop Loss (pips) Take Profit (pips) Trailing Stop (pips) Trailing Step (pips) Money management: Lot or

This expert is best when running on GBPUSD M30 and is designed to give consistent mid/long term revenues. It doesn't use any dangerous strategies as martingale or grid trading. All orders are protected by a stoploss and the money management feature allows to protect the account balance. This expert also includes a sophisticated time management system to target best times to trade. This EA is not a scalper and will be less affected by slippages and spreads from brokers. It will trade less than a

Scalp using the behavior of a short moving average, the indicator gives the slope and identifies the "hyper" moments.
Operational advice:
Use M1 chart. Period 20 : open buy after two rising lows; sell after two max downhill; avoid countertrend openings; when the line goes flat put a stop at the opening price. Avoid actions in low volatility timeslots. When the curve that draws the min / max is very flat, it is better to postpone at least 15'.
Period 50 : matches the trend, when it is at
FREE

エントリー前に確認できるチェックリストを作成しました。 以下のコードを参照してMT5用に作成しました。
Strategy Checklist - indicator for MetaTrader 4 https://www.mql5.com/en/code/18877
機能: チェックリスト20個まで入力できます。 表示位置 (左上 、 右上 、 左下 、 右下) の 指定 が可能 になります。 フォントサイズ の 変更が可能 になります。 チェックリストの幅を変更できます。 ドラッグ&ドロップでチェックリストを移動できます。
インストール方法: ファイル->データフォルダーを開く->MQL5フォルダー->Indicatorsフォルダー 配下にex5ファイルを置いてMT5を再起動してください。 チェックリストはマニュアルで入力が必要になります。入力後 保存しておいてください。 テンプレートで保存しておくと容易にチャートに適用できます。
FREE

I find the lot calculation tedious so I just use this script and tell it the dollar amount to use. It then does the rest. This works for any currency.
How-To: Open a buy position using the desired dollar amount instead of lots. To use, just drop it onto a chart and set inputs as needed. The script will then do the necessary lot calculation and open the trade.
Inputs: FIXED_DEAL_AMOUNT: Fixed amount to use per trade e.g 100 to open a R100 deal USE_SL_ON_BUY: If true then a suitable stoploss wil
FREE

I find the lot calculation tedious so I just use this script and tell it the dollar amount to use. It then does the rest. This works for any currency.
How-To: Open a sell position using the desired dollar amount instead of lots. To use, just drop it onto a chart and set inputs as needed. The script will then do the necessary lot calculation and open the trade.
Inputs: FIXED_DEAL_AMOUNT: Fixed amount to use per trade e.g 100 to open a R100 deal USE_SL_ON_BUY: If true then a suitable stoploss wi
FREE


This indicator displays buy or sell signals according to Bill Williams' definition of the Trading Zone. [ Installation Guide | Update Guide | Troubleshooting | FAQ | All Products ] Easy to use and understand Avoid trading flat markets Deterministic indicator with clear rules The indicator is non-repainting It implements alerts of all kinds It has straightforward trading implications. A blue arrow is a buy signal A red arrow is a sell signal According to Bill Williams trading in the zone helps t

Binance Full Trader is developed for connection to your Binance account and get data, draw price charts and trade easily with any strategy by an indicator. A user-friendly interface has developed for it and has tried to give access to the necessary information such as open orders and wallet balances. · There are two sample indicators (one for trade signal and another for price) that you can download it from these links: https://drive.google.com/file/d/1w2CGuu3rArWKMhS9LkepT9zhVkGR1AO7/vie

This utility is the demo version of the Binance Full Trader. This version is provided so the customers can test performance and options of the main version. · This version has these restrictions: 1. Only BTCUSDT is available for price chart and Test Mode. 2. The Real Mode is not accessible. 3. The LIMIT and STOPLOSSLIMIT are not accessible. 4. The Indicator mode is not accessible. · The full version and the instruction of use can be downloadable from t
FREE

ONLY 3 COPIES OUT OF 10 LEFT AT $50! After that, the price will be raised to $200. EA with the idea of using the "High Risk - High Reward" strategy. You should use the EA with the same capital as my trading signal, withdraw profits regularly and only use lot size 0.01 no matter the capital. The strategy was Back-tested Stable from 2016 to 2021 using every tick based on real ticks in MT5 using Dukascopy Real Ticks 100% tick quality. Live trading is going well on many different brokers - REAL S
RSI EA ΜΤ5 是一种独特的全自动智能交易系统,用于交易众所周知且极其高效的相对强度指标,能够同时控制您的交易账户在篮子级别的利润和/或亏损,对于您所有未平仓头寸的组合. RSI EA MT5 有 4 种不同的交易相对强度指标的策略,在实时柱线的 RSI 极端值上开仓交易,在闭合蜡烛上的 RSI 极端值开仓交易和 RSI 水平交叉上的开仓交易。最后一种策略是相对强度指标的一种独特方法,因为它是一种趋势跟踪策略,而不是逆转策略。此 EA 附带为许多符号提供的设置文件,专门针对 ECN Raw Spread ICMarkets 帐户(基于纽约的 GMT+3 时区服务器)进行了优化。可能会使用其他经纪商或账户类型,但您可能需要进行任何必要的时间调整以适应您的经纪商/账户。 建议: 我的 EA 都不是能够预测市场的神奇产品。 相反,他们是诚实的、编码良好的专家顾问,旨在赢得更多而不是失去。 他们不采用鞅或网格策略,这意味着他们的结果不会始终显示出向上的利润曲线; 可能会有起伏。 他们的成功需要耐心和纪律。 我的一般建议是在策略测试器中测试所有提供的设置文件。 如果您发现任何有

币安是全球知名的加密数字货币交易所!为方便对加密数字货币行情进行实时数据分析,程序可自动将币安实时成交数据导入到MT5进行分析,主要功能有:
1、支持币安全部现货交易对自动创建,也可以单独设置盈利货币和基础货币。如盈利货币ProfitCurrency为空表示全部交易区,可选:USDT、BTC、DAI等币安支持的交易区(合约交易暂不支持),基础货币BaseCurrency为空表示所有货币,也可以单独设置BNB、ETC等任何币安支持的加密货币。 2、同步币安各货币的价格精度、交易量精度以及最大交易量等。
3、通过WebSocket链接币安,每一笔成交即可推送到Mt5更新行情。
4、支持所有现货品种同时更新,为提高实时数据效率,可自定义最大更新组(需要打开对应窗口更新),工具默认最大组数为4组,需要打开4个图表窗口,运行时分别设置RangNO为0,1,2,3(小于最大窗口数),以此类推。如果仅需要更新当前窗口的实时行情,可将RangNO设置为-1。
5、实时行情更新请使用代理地址,因此,必须将代理地址 trade.ctabot.com 添加到:MT5——工具——选项——EA——We

币安是全球知名的加密数字货币交易所!为方便对加密数字货币行情进行更精确的分析,程序可自动将币安的期货K线数据导入到MT5进行分析,主要功能有:
1、支持币安USD-M全部期货交易对自动创建,也可以单独设置基础货币。如基础货币BaseCurrency为空表示所有货币,也可以单独设置BNB、BTC等任何币安USD-M期货支持的加密货币。
2、同步币安各期货货币的价格精度、交易量精度以及最大交易量等。
3、自动更新列表中所有币安支持的列表期货行情数据,便于技术分析。
4、支持7*24小时的期货行情数据,第一次导入时默认从币安第一笔交易同步,以后则从最新的K线自动同步数据。
5、支持代理(代理默认为 http://trade. ctabot.com:9441),也可以用币安接口地址 https://fapi.binance.com直接访问 (如果可以直接打开币安),注意此地址必须填写到:mt5——工具——设定——EA交易的WebRequest列表中,否则所有数据无法同步。
6、同步间隔不低于5秒,否则EA无法启动。 7、为避免跟现货符号冲突,当前期货行情导入工具可自定义期货前缀,

币安是全球知名的加密数字货币交易所!为方便对加密数字货币行情进行实时数据分析,程序可自动将币安期货实时成交数据导入到MT5进行分析,主要功能有:
1、支持币安全部USD-M期货交易对自动创建,也可以单独设置基础货币。基础货币BaseCurrency为空表示所有货币,也可以单独设置BNB、ETC等任何币安支持的加密货币。 2、同步币安各货币的价格精度、交易量精度以及最大交易量等。
3、通过WebSocket链接币安,每一笔期货成交即可推送到Mt5更新行情。
4、支持所有期货品种同时更新,为提高实时数据效率,可自定义最大更新组(需要打开对应窗口更新),工具默认最大组数为4组,需要打开4个图表窗口,运行时分别设置RangNO为0,1,2,3(小于最大窗口数),以此类推。如果仅需要更新当前窗口的实时行情,可将RangNO设置为-1。
5、实时行情更新请使用代理地址,因此,必须将代理地址 trade.ctabot.com 添加到:MT5——工具——选项——EA——WebRequest列表中。
6、行情更新时,图表窗口的计数器会不断变化,如果因为网络原因或币安接口异常导致停止,请重新运

使用 The Strat 进行交易时,关注多个时间范围很重要。 该指标将显示每个时间范围内当前蜡烛的每日、每周、每月和每季度状态。 圆圈图标表示该时间范围内的蜡烛目前是内部蜡烛,或 TheStrat 术语中的类型 1。 Inside Day 蜡烛正在巩固价格走势,我们正在寻找该范围的突破。 指向上或下的三角形图标是趋势蜡烛,或 TheStrat 术语中的类型 2。趋势蜡烛可以是看涨或看跌,表明它已经突破了之前的蜡烛范围,现在正朝着一个方向发展。 方形图标是外部蜡烛,或 Strat 术语中的类型 3。这表明两件事,一是价格在该时间范围内的方向未定,可能相当波动,二是在较短的时间范围内,可能有很好的交易空头反转机会。该正方形将是看涨或看跌的颜色,以显示当前获胜的一方。 每个图标使用的颜色都可以根据您的喜好进行配置,文本和图标的大小也是可配置的。 设置
时间范围选择 每小时显示 当为 True 时,显示每小时蜡烛状态。 每日秀 当为 True 时,显示每日蜡烛状态。
每周秀 当为 True 时,显示每周蜡烛状态。 每月显示 当为 True 时,显示每月蜡烛状态。 季刊 当为 True 时,显
夹线机2.0MT5
Version for MT4: https://www.mql5.com/en/market/product/67566
实时监控专家在真实账户上的工作:
1. 2020年5月推出的真实账户,起始余额为5,000美元: https://www.mql5.com/en/signals/773977
2. 真实账户,起始余额$10,000,于2022年4月推出:
顾问工作背后的想法: 每个人都知道,价格永远不会无休止地朝着一个方向前进,没有修正。 技术分析的规则告诉我们,历史总是重演。 这意味着价格将在一段时间后重复低点和高点。 此外,观察各种金融工具的价格行为图表,我们发现大约90%的时间市场处于具有一定价格范围的横盘走势,只有10%的时间市场出现下行或上行趋势。 基于这种理解,我们开发了一种算法,可以打开和记录具有潜在利润的交易操作。
自2012年以来,EA设置已经过历史数据测试
要从我们的交易账户接收设置文件,请通过电报与我联系: https://t.me/fanaty
MetaTrader市场提供了一个方便,安全的购买MetaTrader平台应用程序的场所。直接从您的程序端免费下载EA交易和指标的试用版在测试策略中进行测试。
在不同模式下测试应用程序来监视性能和为您想要使用MQL5.community支付系统的产品进行付款。
您错过了交易机会:
- 免费交易应用程序
- 8,000+信号可供复制
- 探索金融市场的经济新闻
注册
登录