适用于MetaTrader 4的付费EA交易和指标 - 23

---- Brand New Strategy. Three Month Rent is $30. ONE YEAR RENT ONLY $50. FREE EURUSD VERSION AVAILABLE UNDER << Forecast System Gift >>. NO NEED FOR BACKTEST! Link to the FREE version --> https://www.mql5.com/en/market/product/110085?source=Site --- This is a simple strategy based on BREAKOUT and FIBONACCI levels. After a breakout, either, the market: - continues the move directly to the 161, 261 and 423 levels, or - retraces to the 50% level (also called a correction) and thereafter continues

Currency Heat Wave Ultimate 技术指标是一种有价值的工具,可为交易者提供对主要货币强度的实时洞察。通过对 28 种货币对的分析,它直接在图表上提供了货币强度的综合概览,使用起来非常方便。通过动态改变颜色,它使交易者能够快速识别货币的头寸并做出明智的决定。 Currency Heat Wave 的显着特点之一是它的快速活动,确保交易者及时收到最新信息。该指标的彩色仪表通过显示与买入和卖出信号对应的鲜艳颜色来增强视觉体验。这种视觉表示增加了清晰度,并帮助交易者一目了然地掌握货币的相对强度。 Currency Heat Wave 的用户友好设置进一步增强了它的吸引力。交易者可以根据自己的喜好轻松自定义指标,使其适应自己的交易策略。图形参数允许为买卖信号选择合适的颜色,确保个性化和视觉吸引力的显示。 X 和 Y 距离也可以调整,使交易者能够方便地在图表上定位指标。 请务必注意,真实货币强度功能在测试模式(策略测试器)期间不可用。然而,在实时交易场景中使用时,Currency Heat Wave 可提供有关货币强度的准确且有价值的见解,帮助交易者做出明智的交易决策。
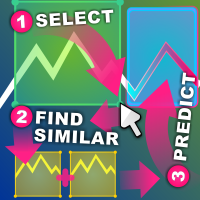
相似价格行为指标 相似价格行为将查找与您选择的图表区域尽可能相似的过去烛台图案序列。
该指标将从您选择的价格行为区域的第一个烛台之前开始搜索,直到图表的第一个最旧条。
评估两个序列之间的相似性有几个标准: 序列的长度必须相同,如果您选择的区域是 20 个烛台宽,那么任何匹配的结果也必须是 20 个烛台宽。您可以选择任意数量的蜡烛。 将根据序列的高低大小进行视觉比较 将根据序列的开盘价和收盘价大小和方向进行视觉比较。如果蜡烛图对一个序列来说是看涨的,而对另一个序列来说是看跌的,则得分设置为 0.0 序列有一组快速和慢速移动平均线,它们根据其增量进行比较。增量可以在该区域内相对比较,也可以在整个资产范围内绝对比较(相对和绝对模式) 序列有一组快速和慢速 ATR,用于比较其波动性。同样,比较可以是相对的,也可以是绝对的。 序列有一组快速和慢速 RSI,用于比较其局部强度。 以上所有内容混合在一起以获得最终评级,其中每个组件都由一个系数加权。指标的输入中提供了系数和比较方法。 指标的搜索引擎 simipac 将扫描过去所有可能的蜡烛图序列,而不会破坏蜡烛的顺序。
这些序列中的最佳序列将

KT Higher High Lower Low 标记以下摆动点及其对应的支撑/阻力水平,帮助交易者更好地识别市场趋势: Higher High: 价格创出的新高点,比之前的高点更高,通常表示市场处于上升趋势,买方力量强劲。 Lower High: 价格创出的高点比之前的高点低,说明市场可能正在进入调整阶段,或趋势反转的可能性增加。 Lower Low: 价格创出的新低点,比之前的低点更低,通常意味着市场处于下降趋势,卖方力量占主导地位。 Higher Low: 价格创出的低点比之前的低点更高,这可能表明市场正在走强,多头趋势可能正在形成或延续。
特点 可以通过调整左右柱的数量来控制摆动点的强度,使交易者能够根据市场情况灵活调整分析策略。 在新的 HH、LH、LL 和 HL 出现时提供警报,以便交易者可以及时把握市场变化,不错过任何重要机会。 当价格触及关键的支撑或阻力水平时,系统会自动提供警报,有助于交易者更好地管理交易,制定更精准的进出场计划。

该指标通过计算 RSI 超买/超卖区域上方和下方移动的柱数来显示市场的多头/空头趋势。绿色柱状图表示多头力量,而红色柱状图表示空头力量。
功能特点
可用于开启新交易,或验证来自其他策略或指标的交易信号。 配备多时间框架扫描仪,可扫描所有时间框架内的多头/空头力量。 是验证交易信号的完美工具,可增强新手交易者的信心。 包含所有 MetaTrader 4/5 预警功能。
输入参数 周期: 用于确定超买/超卖水平的 RSI 周期。 柱周期: 计算 RSI 超买/超卖区域上方/下方的柱数。 超卖水平: 用于确定 RSI 超卖水平的参数。 超买水平: 用于确定 RSI 超买水平的参数。 MTF 扫描仪: 多时间框架扫描仪,可从所有可用时间框架中获取信号。 预警设置
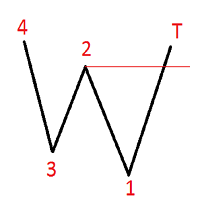
ZigZag Alert 该指标基于标准之字折线。
显示在图表上并表示某种形态的出现。
根据用户的选择,指示信号显示在终端中,或发送电子邮件至该地址,
或向移动终端发送通知。 向上运动信号的形态条件:
第 4 点的价格必须高于第 2 点的价格,T 点的价格必须高于第 2 点的价格。
向下移动时,相反,向上移动。
指标设置说明: InpDepth - 之字折线深度指标的设置 InpDeviation - 设置之字折线偏差指标 InpBackstep - 设置 ZigZag Backstep 指标 _Alert - 在终端中启用或禁用通知 _SendMail - 启用或禁用电子邮件通知 _SendNotification - 在移动端启用或禁用通知 主题 - 电子邮件标题 TextDown - 向下移动信号文本 TextUp - 向上运动信号的文本

The KT Trade Manager is a powerful tool to enhance trade execution and position management. With its user-friendly interface, traders can easily oversee and control their trades. This comprehensive solution encompasses various aspects of trading, including risk management and position management. Integrating these crucial elements enables traders to navigate the financial markets more effectively, making informed decisions and optimizing their trading strategies. As global markets evolve, effic
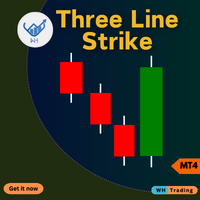
三线打击指标 适用于 MetaTrader 4 (MT4)。此高级工具旨在帮助您轻松精准地识别市场中的潜在逆转。
无论您是初学者还是经验丰富的交易者,该指标都可以增强您的交易决策并最大化您的利润。 Contact me after purchase for guidance 主要特征: 准确的反转信号 :根据三线打击模式(技术分析中经过验证的蜡烛图形态)检测潜在的趋势反转。 可自定义的设置 :使用可调节的参数(例如,执行模式、时间范围和视觉偏好)来定制适合您的交易风格的指标。 实时警报 :当三线打击模式形成时立即收到通知,这样您就不会错过重要的市场机会。 用户友好界面 :直观的设计可以轻松解释信号并将其集成到您的交易策略中。 兼容性 :与您现有的 MT4 设置无缝集成,获得流畅、高效的交易体验。 为何选择三线走势指标? 提高您的交易绩效 :通过可靠、及时的反转信号增强您的决策能力。 节省时间和精力 :自动化您的分析并专注于执行有利可图的交易。 适合所有交易者 :无论您是日内交易者、波段交易者还是长期投资者,该指标都适合您的交易风格。 立即试用三线走势指标,让您的交易更上一层楼。体
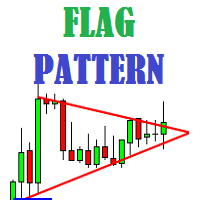
Flag Pattern indicator is an indicator designed to find flag patterns. Bullish and bear find flag patterns. It finds these patterns by its own algorithm. The display is easy to use and simple.
Features Bullish and bear find flag patterns. Draw patterns on the graphic screen. invalid flag patterns. alert the user with the alert feature. Flag patterns have the ability to change colors. Parameters MinSplashHeight - Min. height of splash setting MaxBarsDuration - Max bars before crossing setting

该指标建立了趋势线的扇形(在单击某个蜡烛之后),类似于经典的江恩角。该指标的特点是它不仅在固定比例上构建角度,而且还使用一定数量柱线的平均价格(可选)。
有两种方法可以计算指标中角度的平均价格(可选):
1) 计算从高到低的平均价格变动(对于一定数量的柱);
2) 计算从开盘到收盘的平均价格变动;
选项:
1.Method——构造角的方法;
2. FixedScale - 固定比例(如果在Method中选择了Fixed_Scale);
3. SecondaryAngles - 控制绘制次角的权限;
4. RayRight - 为趋势线设置射线;
5. DrawBackground - 画线作为背景;
6. AnglesQuantity——角度数;
7. Bars_To_Process - 周期,柱的数量,在此基础上确定平均价格,角度的“速度”。如果为零或更低,则根据所有历史数据计算;
8. RisingMainAnglesClr、RisingSecondaryAnglesClr、FallingMainAnglesClr、FallingSecondaryAngl

真正的供需指标 - 将允许您快速确定所有时间范围内的阻力位和支撑位。 该指标对那些在交易中使用技术分析的人很有用。 该指标易于使用,只需在图表上拖放,该指标就会向您显示最可能的支撑位和阻力位。 切换时间范围时,您将看到新选择的时间范围的水平。
推荐机器人黄牛 - 测试 。
输入参数 使用价格标签 - 开启/离开在水平附近显示价格图标 价格水平颜色 - 选择价格图标的颜色 价格 Lebel 大小 - 价格图标大小 支持/抵抗级别颜色 - 选择级别的颜色 订阅我的 page ,我还有很多其他有用的产品。 如果您喜欢这个指标 ,请留下评论,它将进一步激励我免费分享有用的产品。 感谢您选择本产品。 我将努力继续以有用和高质量的产品取悦您。 如果您有任何问题,请随时与我们联系!
使用愉快!
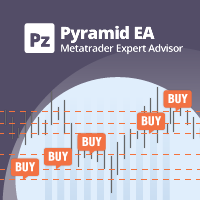
金字塔法是一种通过使用成功交易的未实现利润作为新交易的保证金来增加头寸规模的方法。该智能交易系统将在没有您干预的情况下对您的交易进行金字塔式处理。 [ 安装指南 | 更新指南 | 故障排除 | 常见问题 | 所有产品 ] 轻松地将您成功的交易金字塔 充分利用您的盈利交易 完全可配置的金字塔行为 金字塔与时间框架无关 适用于 ECN/非 ECN 经纪商和 2-3-4-5 数字 在回测中进行随机交易 支持双向交易 用法相当简单:
将 EA 加载到图表 选择交易数量、间隔和金字塔行为 在输入中输入止损和获利(作为余额的百分比) 手动进行初始交易 让 EA 处理剩下的事情
输入
将“EA 交易”加载到任何图表时,您将看到一组选项作为输入参数,按块分组。 金字塔行为
此参数指示 EA 如何处理金字塔交易的手数:手数可以与原始交易相同,每增加一笔交易减少一半或每增加一笔交易增加一倍。
金字塔行动
当您认为合适时,使用此参数关闭交易。
交易量
此参数控制 EA 可以堆积多少笔交易。
初始手数
第一笔交易的手数。 EA 仅在测试器中随机交易。在实时交易中,您必须随机进行第一笔交易。
止损和

时区转换器 自动将图表上的时间转换 为您的当地时间并 为您显示 。在您的鼠标光标或垂直线之间进行选择,将您的经纪人的时间和日期转换为您的当地时间。
自动加载预设文件的说明:
如果您不想让指标始终运行,此功能很有用,但您仍想自定义它并在添加指标时应用这些自定义。 加载指标,进入指标属性,然后单击“输入”选项卡 根据自己的喜好自定义设置 完成后,单击“保存”,在文件夹目录树中向上一次,然后导航到“文件 > 时区转换器”文件夹
输入预设文件的名称,然后单击“保存”。 从现在开始,每当您加载指标时,您的自定义设置都会自动应用。 如果您想更改预设设置,您必须: a) 通过单击“加载”,通过指标的“输入”选项卡再次加载它们,然后应用您想要的更改,并再次保存文件
b) 从 Timezone Converter 文件夹中删除文件并重复上述说明 手动设置本地代理偏移的说明: 如果自动检测本地代理偏移功能对您不起作用,您可以自己手动设置偏移。
计算从经纪人的时区转移到当地时区所需的小时数
打开图表上的时区转换器指标 在“Manual Broker-Local Offset (Hours)”设置中输入与步骤

The Moving Average Crossover Dashboard indicator is a technical tool that displays the crossovers of 2 selected moving averages on the price chart indicating whether it is a bullish or bearish crossover. In addition, as its name indicates, it shows a signal dashboard that indicates in which market and time frame a crossover of the two moving averages occurs. In the setting window the user can select the markets and time frames that can be displayed on the dashboard. You also have the option
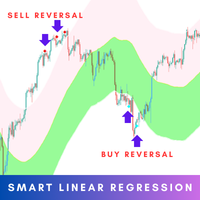
The Smart Linear Regression indicator is a powerful, non-repainting tool designed for traders looking for enhanced accuracy in market analysis. Unlike the typical linear regression channels that often repaint, this indicator provides reliable insights without changing past values, making it more trustworthy for forecasting future price movements. MT5 Version - https://www.mql5.com/en/market/product/124894/ Overview: The Smart Linear Regression Indicator goes beyond the basic linear regression c
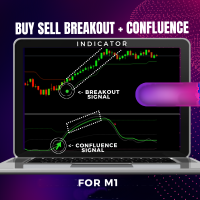
Please CONTACT ME after purchase to get my trading tips.
BUY SELL Breakout Indicator + Confluence
What is the breakout strategy?
In trading terms, a breakout means that the price of a financial asset, such as a share, moves outside of its determined trading range, which is often indicated by its support and resistance levels. The breakout strategy focuses on identifying market trends as soon as they break.
The idea behind trading breakouts is that when the price finally breaks out of the p

MT4多時限發散和超買/超賣檢測指標。
特徵
-在圖表控制面板上完全可自定義,提供完整的交互。
-隨時隨地隱藏和顯示控制面板。
-有關非大寫差異的實時信息。
-有關超買/超賣情況的實時信息。
-有關規則差異的實時信息。
-有關隱藏分歧的實時信息。
-可用於發散檢測的振盪器:AO,RSI,CCI,MACD,STOCH,RMI,TDI,RSIOMA。
-通知服務(屏幕警報|推送通知)。
概括
使用差異交易有助於發現趨勢減弱或勢頭逆轉。有時,您甚至可以將其用作趨勢持續的信號。我們的工具在一個非常舒適和直觀的控制面板中同時提供所有時間範圍的差異檢測,並具有顯示和隱藏的可能性,以使您的圖表盡可能保持清潔。
您會在選擇的歷史時期實時看到超買和超賣情況,定期背離,隱藏背離和無資本背離。
對於沒有大寫字母的差異,我們會在屏幕上顯示MT4通知,並將通知推送到您的手機!

The ' MTF MA Cross ' indicator comes from the time tested 'Moving Average Cross' strategy with several options available. The strategy in itself is one that was derived from rigorous testing on what was profitable in a moving average cross.
Key Features This indicator contains a fast and slow Moving Average cross with MTF & filtering settings. There are additional settings to filter signals out with how many bars and how many points. Indicator can be no-repaint when set with open prices & NewBa
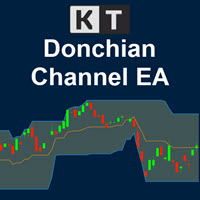
KT Donchian Channel Robot 采用一套强大的交易策略,结合 Donchian 通道的突破、EMA 的上升或下降趋势,以及 ATR 波动率指标来执行交易。 买入条件: 上轨突破 + EMA 上升 + 波动性增加。 卖出条件: 下轨突破 + EMA 下降 + 波动性减弱。
功能特点 不受经纪商限制,在各种账户条件下表现稳定。 每笔交易都设置了止损和止盈,确保风险控制。 不使用马丁策略、网格、加仓等高风险手法。 参数简洁明了,适合所有水平的交易者。 无需额外下载,所有依赖项已内嵌于 EA 中。
参数设置 EA 提供高度自定义功能,允许您根据个人偏好和市场状态微调策略。 其中一个重要设置是各指标的周期:Donchian 通道、EMA、ATR。 周期代表用于计算指标数值的K线数量。例如,Donchian 通道周期为 20,则上轨为过去 20 根K线的最高价,下轨为最低价。
交易策略
EA 采用数据驱动的完整交易系统,充分利用 Donchian 通道、EMA 与 ATR 的联动特性。
买入策略
价格需收盘于 Donchian 上轨之上,表明可能的多头突破。 EMA

Todo comerciante sabe que él o ella nunca deben arriesgar más del 5% (o 7%) por operación. Esta es una ley de administración de dinero y se debe calcular un tamaño de lote utilizable cada vez porque un comerciante debe usar un valor StopLoss diferente para diferentes niveles de negociación. Este indicador calculará un tamaño de lote apropiado para el momento en que lo colocará en el gráfico y cada vez arrastrará la "Línea de stop loss" en cualquier dirección.
OFERTA POR TIEMPO LIMITADO: Todos

Obie 1M Scalper Metatrader 4 Forex Robot 是一款利用 13 条移动平均线的自动外汇交易软件。
从本质上讲,它使用多个移动平均线来制定扫描市场以获取买卖交易信号的逻辑,可确保此类警报越来越准确。
顾名思义,这是一种剥头皮算法,在 1 分钟时间范围内对主要外汇货币对(如英镑/美元、欧元/美元、美元/瑞士法郎、美元/加元等)以及上市股票表现最佳 在纳斯达克。
交易此自动交易系统所涉及的风险是点差。
因此,1 分钟剥头皮专家顾问应仅部署在点差相对较小的外汇对上,例如 EUR/USD、USD/JPY 和 GBP/USD。
策略测试报告 在 1 分钟图表上的 GBP/USD 外汇对的 1 分钟黄牛外汇机器人策略测试报告下方找到。
整体表现 EA 从总共 13 笔交易中获得了 605.44 美元的总利润。 最大的盈利交易产生了 357.27 美元的利润,而最大的亏损交易产生了 0.00 美元的损失。
统计数据: 测试中的柱线:建模的 8519 个刻度
初始存款:10000.00 美元
净利润总额:605.44 美元
总交易数:13
最大
Binary Power Pinbar 2 用于 MT4 Binary Power Pinbar 2 是一款用于二元期权的指标,可与任何货币对配合使用,适用于所有时间框架。 工作原理 该指标在图表上识别“Pin Bar”模式。一旦出现: 买入信号: 如果价格突破 Pin Bar 的最高点,将生成买入信号。 卖出信号: 如果价格突破 Pin Bar 的最低点,将生成卖出信号。 主要特点 到期时间: 默认设置为 1 根蜡烛,但您可以在设置中选择最多 5 根蜡烛。建议使用 1 或 5 根蜡烛。 信号: 以缓冲箭头形式显示:
红色箭头 — 卖出信号。
蓝色箭头 — 买入信号。 信号出现在上一根蜡烛上,并对当前蜡烛有效。如果信号出现较晚,请根据时间框架进行评估: 对于 M1: 跳过在当前蜡烛打开后 10 秒后出现的信号。 对于 M5: 接受在 20 秒内出现的信号,以此类推。 优势 包括 Binary Power Pinbar 2 在内,我的所有指标均配备缓冲箭头。这使您可以连接基于指标缓冲区工作的专家顾问,从而实现完全自动化交易。 安装指南 为了确保正确运行,将“MQL5”文件夹复
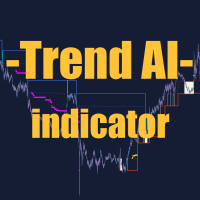
Trend AI Indicator 描述:
Trend AI Indicator 是一款强大的市场分析工具,利用人工智能识别趋势和关键水平。该指标自动适应不断变化的市场条件,提供准确的数据以支持决策。 主要功能: 趋势识别: 该指标使用机器学习算法准确判断趋势方向(上升、下降、横盘)。 关键水平: 基于历史数据自动构建支撑和阻力水平。 安全交易区: 定义最小可能止损的区域,降低风险。 适应性: 该指标适应市场波动,减少错误数据。 自定义设置: 可根据不同交易策略和时间框架进行调整。 优势: 由于使用AI,具有高精度。 适用于所有市场类型(外汇、股票、加密货币)。 安全交易区通过最小止损降低风险。 易于使用,适合初学者和专业人士。 设置: Indicator Color Theme: 设置与截图中显示的颜色主题。 Sensitivity Factor: 调整指标的敏感度。 Safety Factor: 调整安全止损功能的触发条件。 Trading Area Coefficient: 安全交易区的大小。 注意:
为确保指标正常运行,至少需要1500

The Expert Advisor is a risk manager helping users to control their trading. In the settings, it is possible to specify the parameters at which the risk manager force closes the opened trades and closes the terminal as well, if it is needed to prevent opening trades on emotions, which do not correspond to the trading strategy. Risk Manager settings Check limit to close - check the equity limit Limit to close (account currency) - equity limit that is checked when Check limit to close is act

The Key level wedge indicator automatically draws rising wedge pattern and falling wedge pattern for you on the chart. This pattern is really good when used as a confirmation entry at key support & resistance, supply & demand and reversal zones.
Advantages
The Key level wedge block DOES NOT RE-PAINT, giving you confidence when a signal appears and also helps when looking back. The Key level wedge includes an on/off button on the chart to easily keep the charts clean after analysis by just o

这是我著名的剥头皮机Goldfinch EA的最新版本,它是十年前首次发布。它以短期内突然出现的波动性扩张为市场提供了头条:它假设并试图在突然的价格加速后利用价格变动的惯性。这个新版本已经过简化,使交易者可以轻松使用测试仪的优化功能来找到最佳交易参数。 [ 安装指南 | 更新指南 | 故障排除 | 常见问题 | 所有产品 ] 简单的输入参数可简化优化 可定制的贸易管理设置 交易时段选择
工作日选择 金钱管理
谨防... ick牛黄牛是危险的,因为许多因素都会破坏收益。可变的点差和滑点降低了交易的数学期望,经纪人的低报价密度可能导致幻像交易,止损位破坏了您获取利润的能力,并且网络滞后意味着重新报价。建议注意。
回溯测试 EA交易仅使用报价数据。请以“每笔交易”模式回测。 它根本不使用HLOC(高-低-开-关)数据 交易时间无关紧要 为了获得更好的性能,请为您希望在每个刻度线模式下交易的每个交易品种运行云优化。稍后分享!
输入参数
触发点:触发点差所需的价格变动。 (预设= 10)
最小时间窗口:价格波动发生的最短时间。 (默认= 3)
最长时间窗口:价格波动发生的最长时间。

Visit our all-new Stein Investments Welcome Page to get the latest information, updates and trading strategies. Do you want to become a constantly profitable 5-star forex trader? Then get our Stein Investments trading tools and send us a screenshot to get your personal invitation to our exclusive trading chat with 500+ members.
Crosshair is a fantastic tool that simplifies our chart analysis by bringing the price candles perfectly in line with the indicator values in the subwindows. You

The Pure Price Action ICT Tools indicator is designed for pure price action analysis, automatically identifying real-time market structures, liquidity levels, order & breaker blocks, and liquidity voids. Its unique feature lies in its exclusive reliance on price patterns, without being constrained by any user-defined inputs, ensuring a robust and objective analysis of market dynamics. Key Features Market Structures A Market Structure Shift, also known as a Change of Character (CHoCH), is a pivot

The Simple ICT Concepts Indicator is a powerful tool designed to help traders apply the principles of the Inner Circle Trader (ICT) methodology. This indicator focuses on identifying key zones such as liquidity levels, support and resistance, and market structure, making it an invaluable asset for price action and smart money concept traders. Key Features Market Structure : Market structure labels are constructed from price breaking a prior swing point. This allows a user to determine t

MT4 版本: https://www.mql5.com/en/market/product/114590
MT5 版本: https://www.mql5.com/en/market/product/120764
“Marti Lovers”专家顾问 (EA) 是一种复杂而激进的交易系统,专为能够处理高风险策略的经验丰富的交易者而设计。此 EA 将多种交易逻辑组合成一个强大的工具,为外汇交易提供独特而动态的方法。鉴于其激进的性质,“Marti Lovers”需要大量余额来管理潜在的亏损并最大化该策略的盈利能力。
主要特点:
多逻辑集成:
马丁格尔策略:“Marti Lovers”的核心利用了马丁格尔原则,即在亏损后将交易规模加倍以收回之前的亏损并实现盈利。这种方法可以带来可观的收益,但也伴随着巨大的风险。 网格交易:利用网格交易逻辑,在基准价格上下以设定的间隔下达多个买入和卖出订单,利用市场波动和价格波动获利。 趋势跟踪:结合趋势跟踪指标,使马丁格尔和网格策略与现行市场趋势保持一致,旨在提高交易成功率。 均值回归:实施均值回归技术来识别超买或超卖情况,允许 EA 以潜在的

或 M oving 一个 verage 小号 upport [R esistance 带 。
MASR Bands 指标是一条移动平均线,由两条带共同作为支撑位和阻力位。据统计,MASR 波段 93% 的时间都包含价格蜡烛。以下是分步计算的方法: 1. 第一步是计算 X 时间段内的最高价 (HHV) 和最低价 (LLV)。
2. 第二步是用HHV除以LLV,得到它们之间的距离有多宽的百分比。我称这一步的结果为 MASR Filter。
3. MASR 过滤器 = 总和 ((HHV / LLV)-1) / 柱数
4. 我将上带称为 MAR,这是移动平均阻力的捷径。我将下频带 MAS 称为移动平均线支持的捷径。波段之间的移动平均线称为中心线。
5. MAR = MASR 中心 + (75% x MASR 过滤器 x MASR 中心)
6. MASR 中心是移动平均线。
7. MAS = MASR 中心 - (75% x MASR 过滤器 x MASR 中心)
重要链接
MASR 工具手册: https://www.mql5.com/en/blogs/post/721889
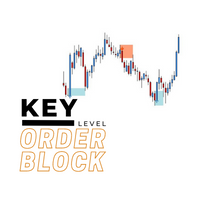
The key level order block indicator automatically draws order-blocks for you on the chart. The indicator compliments any strategy and can also be used as an independent tool. It can work with smart money concepts, harmonic patterns, supply and demand, flag patterns, Quasimodo strategy and many more.
Advantages
The key level order block DOES NOT RE-PAINT, giving you confidence when a signal appears and also helps when looking back. The key level order block includes an on/off button on the c

Elevate your trading experience with BOLD AI, a state-of-the-art trading expert advisor (EA) engineered to deliver precision and speed in the forex market. The robot utilizes Bollinger Bands, Relative Strength Index (RSI), and momentum analysis to pinpoint high-probability trade setups. It then employs an advanced trailing stop mechanism to maximize profits while minimizing risks, ensuring efficient and adaptive trade execution. With its strategic design, BOLD AI is built to cut losses short a

AI Scalper是一个使用算法和人工智能技术来优化外汇市场交易的指标。该指标提供 两个TakeProfit级别 ,使交易者能够根据当前市场条件调整其策略并最大化利润。 AI Scalper的关键功能: Two levels of TakeProfit: 设置不同的盈利目标,根据市场情况灵活进行交易。 Automatic StopLoss calculation: 指标根据当前波动性自动确定StopLoss级别,帮助最小化风险并保护您的投资。 Emergency StopLoss function: 当趋势发生变化时,该功能会激活,提供额外的保护级别,帮助避免潜在损失。 Intelligent exit: 指标实时分析市场数据,包括价格波动和交易量,以确定关闭头寸的最佳时机。 Settings: Indicator Color Theme: 设置颜色主题,如截图所示。 Step: 用于计算分析算法的步骤。 Percent 1: 用于计算分析算法的参数。 AI Scalper为交易者提供了一个强大的工具,使其能够进行更安全、更有利可图的交易,有效管理投资并适
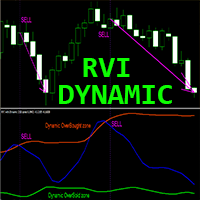
Crypto_Forex 指标“带动态超卖/超买区域的 RVI”适用于 MT4,无需重绘。
- Relative_Vigor_Index (RVI) 本身是一个技术动量指标,在趋势市场上非常有用。 - 它非常适合从动态超买区域卖出和从动态超卖区域买入。 - 指标可以在任何时间范围内使用,但它在大时间范围内尤其适用:D1、H4、H1、M30。 - 动态超买区域 - 红线上方。 - 动态超卖区域 - 绿线下方。 - 带有 PC 和移动警报。 .................................................................................................................... // 出色的交易机器人和指标可在此处获得: https://www.mql5.com/en/users/def1380/seller 这是仅在此 MQL5 网站上提供的原创产品。

适用于 MT4 的 Crypto_Forex 指标“带有趋势之字形的 MACD”。
- MACD 指标本身是趋势交易最受欢迎的工具之一。 - “MACD 趋势之字形”非常适合与价格行动入场或与其他指标结合使用。 - 使用此指标选择最准确的入场信号: _ 如果 MACD 高于 0(绿色)且之字形线向上 - 仅搜索买入价格行动模式。 _ 如果 MACD 低于 0(粉红色)且之字形线向下 - 仅搜索卖出价格行动模式。 - 指标具有内置移动和 PC 警报。 ................................................................................................................... // 出色的交易机器人和指标可在此处获取: https://www.mql5.com/en/users/def1380/seller 它是仅在此 MQL5 网站上提供的原创产品。
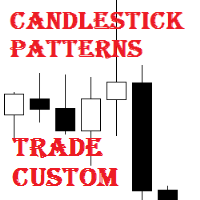
Candlestick Patterns Trade Custom is an Expert Advisor for trading candlestick patterns.
The considerable advantages of the EA It allows the user to configure the signal of each pattern, it is recommended to configure the EA in accordance with the analysis results of the Candlestick Patterns Analytics indicator; It does not use Martingale; Contains the integrated Candlestick Patterns Custom indicator.
Description of Input Parameters Each candlestick pattern has a drop-down menu with the option

Golden Scalper XAU/USD – 专为黄金市场(XAU/USD)设计的高效剥头皮交易指标 如果您是黄金市场(XAU/USD)的交易员,正在寻找一个强大的工具来最大化您的利润,进行高效的剥头皮交易,那么 Golden Scalper XAU/USD 将是您的完美选择。此指标使用先进的模式识别技术,提供 高精度的交易信号 ,让每一笔交易都充满信心。 主要特点: 剥头皮交易中的无与伦比的精确度: Golden Scalper XAU/USD 专为黄金市场优化,提供 优质的交易信号 ,帮助您进行 快速且有利可图的交易 。 先进的模式识别技术: 通过使用复杂的模式识别技术,指标能够识别最佳的入场机会,过滤掉虚假信号,大大提高交易成功率。 高精度: 依托智能算法,指标能够在波动性大、快速变化的黄金市场中提供 可靠的交易信号 ,确保您的每一次交易都有更高的成功概率。 专为剥头皮交易优化: 该指标的优势在于其 在剥头皮交易中的高效性 ,能够帮助您在短时间框架内发现最佳的入场和退出点 简易的用户界面: Golden Scalper XAU/USD 拥有直观的用户界面,信号显示在图表上,简
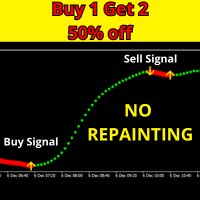
主要特点: 先进且经过测试的算法:
Scalper Trend Signals No Repaint 配备了市场上最优化的算法之一,确保准确可靠的趋势分析。全球进行的超过 15,000 次测试表明,它对各级别的交易员非常有效。 独特的假信号过滤器:
新的指标配备了独特的算法过滤器,能够最大限度地减少假信号。尤其适合使用 剥头皮策略 的交易者,因为它帮助精确理解每日价格方向。 实时信号——通过电子邮件和推送发送:
与旧版本不同,新的指标可以直接通过电子邮件或推送通知将信号发送到您的设备,帮助您快速做出决策,并随时随地实时监控市场。 灵活的设置: period_trader :调整快速价格适应周期。 period_low_trader :设置慢速价格适应周期。 mode_ma :选择移动平均模式。 mode_price :设置价格模式。 EmailPush :启用通过电子邮件或推送设备发送信号。 促销活动 :购买 Scalper Trend Signals 指标 ,并获得独家赠品!
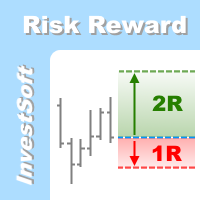
This is the forex visual orders tool & forex position size (lot) calculator with intuitive panel. Risk Reward Ratio Indicator works on all kind of symbols: currency pairs, indices, metals, commodities, cryptocurrencies, etc.
If you want to make sure that Risk Reward Ratio Indicator works on your favorite symbols contact us ( visit our profile ) and ask for 7-day free trial to test this tool without limits. If you want to place orders easier, faster and more intuitive? If you like to mark trad
警告: 由于MetaQuotes最近的变更,现在限制复制和倍增信号订阅的交易。因此, Signal Multiplier EA MT4/5 不再能够倍增您信号订阅的交易 !!!
信号乘数 EA MT4 不仅仅是另一个手数乘数。 除了通过专家顾问或手动输入乘以您账户交易的手数之外,它还会主动监控您的交易。 EA 可以向您发送关于每笔新的原始交易和倍增交易的电子邮件和推送通知,并且如果需要,还可以在预定义的时间提供每日通知。 这些每日通知包括您账户的基本详细信息,例如余额、净值和保证金水平。 最重要的是, 信号乘数 EA MT4 将自动关闭所有未平仓交易(包括原始交易和乘数交易),并在达到您的紧急净值水平时启动新交易的对冲。 此功能可以保护您的交易账户免受进一步损失,并为您提供时间来删除您的专家顾问并关闭任何剩余交易。 需要注意的是,紧急对冲需要对冲账户,这意味着您的经纪商应该允许对冲。 此外, 信号倍增器 EA MT4 可通过多种方式有效管理倍增交易。 它可以复制原始交易的止盈和止损水平,应用您的自定义止盈、止损、盈亏平衡和追踪止损水平,或在篮子级别对所有乘法交易使用篮子

70% OFF for 2 DAYS
Join the telegram Group.
Copy Paste the following address: https://t.me/+nW-jTNrIjwM3YjJk or contact me. Or follow the link under my profile
Genius Z uses a personalized algorithm to get values from ZIG ZAG indicator.After that, a custom made system filters the point where the position will open and a smart system closes the positions.
Recommendations: The default set is made to trade EURJPY,EURUSD and GBPUSD but of course can be used to any FX pair and optimiz
A formidable ally for historical testing with Fixed Perspective through ZigZag and Dow Theory, while also supporting ReviewCandleChart. A recommended tool for those troubled by 'lost perspectives.
Overview The 'RCCZigZagDow' indicator is a tool that assists in making judgments based on Dow Theory in relation to ZigZag waves. By using ZigZag waves as a basis to derive continuation points according to Dow Theory, it offers the advantage of ensuring that anyone can interpret trends in the same wa

趋势迅捷 它旨在供任何人使用,即使是交易的绝对初学者也可以使用它。 切勿重新粉刷。 指示是从接近到接近给出的。 设计为单独使用,不需要其他指标。
它是如何工作的 TrensSwift 使用内部趋势指标结合价格行为和斐波那契系统。 该策略被严格应用,没有任何后期重新计算、平滑或插值。 通过评论部分的统计数据可以立即检查该策略的“成功” 从蜡烛收盘到蜡烛收盘,趋势指标实时等待信号条件有效,然后用箭头显示(绿色表示买入,橙色表示卖出) 该指标在交易机会开始时显示止损和止盈,并在整个交易过程中保持它们。 没有惊喜。
TrendSwift 表明 在哪里开启您的交易。 何时关闭它们。 止盈和止损
TrendSwift 有效 使用任何仪器,不受限制。 在任何时间范围内 与任何经纪人。
TrendSwift 功能 没有优化。 非常简单的输入。 非常强大和准确的策略
如何使用TrendSwift 只需将其放在您的图表上即可。 只需遵循箭头和趋势线指示即可。
输入 交易机会时播放声音:当交易机会临近时播放声音(以警告交易者)

该 EA 使用 平均方向指数 (ADX) 指标进行交易。它提供了许多入场策略和灵活的头寸管理设置,以及许多有用的功能,例如可定制的交易时段和鞅模式。 [ 安装指南 | 更新指南 | 故障排除 | 常见问题 | 所有产品 ] 易于使用和监督 它实现了 4 种不同的进入策略 可定制的盈亏平衡、止损、止盈和追踪止损 适用于 ECN/非 ECN 经纪人 适用于 2-3-4-5 位符号 交易可以符合 NFA/FIFO 标准 实现鞅特征 按外汇交易时段过滤交易 内置资金管理 可用的四种进入策略如下,可以单独启用或禁用。 ADX 超过 25 时交易(+DI/-DI 决定方向) ADX 确认的交易分形突破(+DI/-DI 决定方向) 使用 ADX 水平交易 +DI/-DI 交叉 交易+DI/-DI交叉 此外,它还实现了四种不同的资金管理模式: 手动交易手数:EA 将在每笔交易中交易固定手数 自动计算手数:EA 将在每笔交易中承担账户的 % 风险 Martingale:交易失败后,EA 将手数翻倍 逆鞅:交易获胜后,EA 将手数翻倍
输入参数 ADX 设置 - 此参数组包含 ADX 设置。 交易设置

EA Regular Winner is a trading expert who trades according to the strategy of the same name uses the capabilities of A rtificial I ntelligence, trying to close each trade with profit. Each trade can be protected by stop loss and take profit levels.
Uses two independent take profit levels.
If the trade goes into the negative, then when a signal arrives in the same direction, the adviser will open the next trade and set the take profit level specified in the settings for both positions. The mini

欢迎使用我的货币计量器指标
简单介绍:
该指标可以帮助您分别查看每种货币的力量。
如您所知,GBPUSD上涨时,这意味着GBP会发挥更大的作用,或者USD会变得更加疲软,但是您无法理解此走势的原因是什么,大约是GBP?还是大约美元?
为了确定GBP力量,该指标将检查所有对是否包含GBP并确定其走势,最后计算出GBP的平均走势,并通过百分比和直方图向我们显示,
通过这种方式,您可以通过一些绿色和红色的条形查看直方图,还可以看到百分比,它们可以显示您想要的是GBP或USD或EUR或JPY和。
指示器如何根据不同的时间范围确定运动的力量?
该指标在图表上绘制了一些框,每个框与一个时间范围相关,并且包含7行,每一行显示一种货币以及它的功率百分比和直方图。
当我们处于H1时间范围内时,这意味着货币对力量是根据货币对最近1小时的移动来计算的,因此通过访问不同的框,您可以短期和长期地正确了解货币能力 如何通过货币表和移动平均指标建立自己的交易策略?
观看此视频,我向您展示了如何使用货币计量器和移动平均线来构建您的手动交易系统。
https://www.youtube.com/watch?v=9
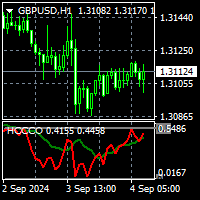
For MT5 version please click here . - This is the exact conversion from TradingView source: "Hurst Cycle Channel Clone Oscillator" By "LazyBear". - The screenshot shows similar results from tradingview and Metatrader when tested on ICMarkets on both platforms. - This is a non-repaint and light processing load indicator. - All input options are available. - Buffers are available for use in EAs and optimization purposes. - You can message in private chat for further changes you need.
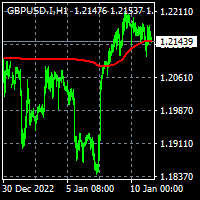
To get access to MT5 version please click here . - This is the exact conversion from TradingView: "Trend Regularity Adaptive Moving Average","TRAMA" By " LuxAlgo ". - This is a light-load processing and non-repaint indicator. - Buffer is available for the main line on chart. - You can message in private chat for further changes you need. Thanks for downloading

To get access to MT5 version please click here . - This is a conversion from TradingView: "Hull Suite" By "Insilico". - This is a light-load processing and non-repaint indicator. - You can message in private chat for further changes you need. note: Color filled areas and colored candles are not supported in MT4 version. Here is the source code of a simple Expert Advisor operating based on signals from Hull Suite . #property strict input string EA_Setting= "" ; input int magic_number= 1234 ; inp
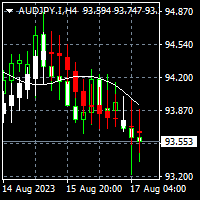
To download MT5 version please click here . - This is the exact conversion from TradingView: "Linear Regression Candles" By "ugurvu". - This is a non-repaint and light processing load indicator - You can message in private chat for further changes you need. This is a sample EA code that operates based on bullish and bearish linear regression candles . #property strict input string EA_Setting= "" ; input int magic_number= 1234 ; input string Risk_Management= "" ; input double fixed_lot_size=
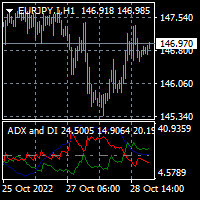
To download MT5 version please click here . This is the exact conversion from TradingView indicator: "ADX and DI" By " BeikabuOyaji". This is probably the most popular implementation of Average Directional Index available. This indicator lets you read the buffers as below: index 0: DIPlusBuffer ==> Green Line by default index 1: DIMinusBuffer ==> Red Line by default index 2: ADXBuffer ==> Navy Line by default - You can message in private chat for further changes you need. Note: This is a non-rep

Super Trend Filter Indicator Super trend Arrow Consider as a Master Candle , If super trend in Buy signal , then signal candle calculate as master candle and master candle close above the open candle then calculate filter Buy Arrow. If super trend in Sell signal , then signal candle calculate master candle and master candle close below the open candle calculate filter Sell Arrow. 3 Target with Trailing Stop Loss

This script searches for all positions for the current currency pair and calculates the sum of all lots for those positions with negative profit and offers to open a hedge (opposite) position with a lot size equal to the calculated sum of lots multiplied by LotCoeff. You just need to drop this script on the chart with a desired currency pair. Before placing opposite orders, the input window is opened allowing you to modify all the input parameters: LotCoeff = 1.5; BuySearch = true; SellSearch =

Multipair Analyzer - An expert advisor which analyze market structure across multiple currency pairs.
Its a tool which uses purely price action structure based trading strategy. Based on the market structure, the EA finds the optimal place to enter and can either take trade or can alert the user to take a better look. Just by placing the EA one one chart, all the other currency pairs are automatically analyzed. Based on its analysis it provide multiple messages . These messages can be easil

Multi Exposition Meter makes your multi instrument exposure clear and readable, no matter how complicated and hedged it is. It does the following: It measures which instruments are traded against which ones in any moment. Measures the exposure share (weight) of each instrument, regarding its volume. Measures total volume, volume at risk and hedged volume. It measures the factor of diversification of the exposure. It calculates the amount of hedging per each instrument, in percent. Shows spread c
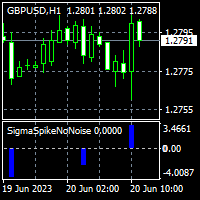
To get access to MT5 version please click here . - This is the exact conversion from TradingView: "Sigma Spikes No Noise" by "irdoj75" - This is a light-load processing and non-repaint indicator. - All input options are available. - Buffers are available for processing in EAs. - You can message in private chat for further changes you need. Thanks for downloading
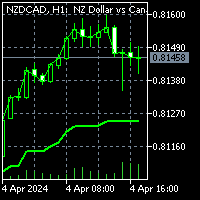
To get access to MT5 version please click here . This is the exact conversion from TradingView: "G-Channel Trend Detection" by "jaggedsoft". This is a light-load processing and non-repaint indicator. You can message in private chat for further changes you need. All input options are available. Buffers are available for processing within EAs. Highlight option is omitted as does not show good in Metatrader.

To get access to MT5 version please click here . This is the exact conversion from TradingView: "[SHK] Schaff Trend Cycle (STC)" by "shayankm". This is a light-load processing indicator. This is a non-repaint indicator. Buffers are available for processing in EAs. All input fields are available. You can message in private chat for further changes you need. Thanks for downloading
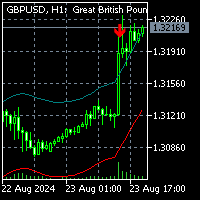
To get access to MT5 version click here . This is the exact conversion from "Nadaraya-Watson Envelope" by " LuxAlgo ". (with non-repaint input option) This is not a light-load processing indicator if repaint input is set to true . All input options are available. Buffers are available for processing in EAs. I changed default input setup to non-repaint mode for better performance required for mql market validation procedure . Here is the source code of a simple Expert Advisor operating
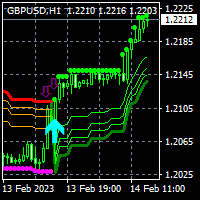
To get access to MT5 version please click here . This is the exact conversion from TradingView: "SwingArm ATR Trend Indicator" by " vsnfnd ". The screenshot shows similar results from tradingview and Metatrader when tested on ICMarkets on both platforms. Also known as : "Blackflag FTS" by "Jose Azcarate" This is a light-load processing and non-repaint indicator. All input options are available except multi time frame Buffers are available for processing in EAs. Extra option to show buy and sell
SuperTrend Strategy EA MT4
an advanced tool designed exclusively for MetaTrader 4. This expert advisor streamlines trading activities by harnessing the power of the Supertrend indicator, automating trade entries buy or sell signal. The EA also facilitates reverse trading setups within these zones, offering a versatile approach to managing trades. For detailed documentation Overall Settings/Input Guide | Indicator Settings/Input Guide | Backtest and Set files You can find MT5 version

This indicator is designed to make reviews of many charts on different timescales quicker, and easier to do. Track Time and Price across multiple charts Change Symbol on one chart and all other charts of the same symbol will be changed too. Easy to use, quick to master The indicator allows you to identify the price and time where the mouse pointer is on the current chart, across all other charts open on the same Symbol. This allows you to quickly see information on multiple charts whereas normal

Introducing our cutting-edge product, an innovative MACD Oscillator with a dynamic level enhanced by a decimal point Moving Average (MA) also with the versatility of multiple moving average modes. This advanced trading tool brings precision and flexibility to your technical analysis, offering a seamless experience for traders seeking a competitive edge in the financial markets.
Key Features: Dynamic Level Precision Our MACD Oscillator is equipped with a dynamic level feature, providing traders
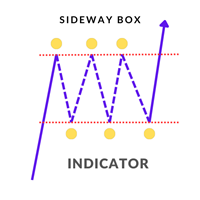
Sideway Box Indicator The Sideway Box Indicator is an advanced trading tool designed to help traders identify and capitalize on sideways market conditions. This powerful indicator detects periods when the market is in a sideways (ranging) phase, providing traders with clear visual cues. Key Features: Sideways Market Detection : The Sideway Box Indicator accurately identifies sideways market conditions, allowing traders to recognize when the price is consolidating within a specific range. Buy/Sel
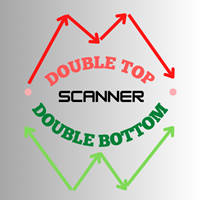
Welcome to enhanced pattern detection with the Double Top and Bottom Pattern Scanner ! Transform your trading approach with this powerful MT4 indicator designed for efficient pattern scanning and actionable alerts. Key Features: Advanced Zig Zag Pattern Detection : The Double Top and Bottom Pattern Scanner uses the zig zag pattern to detect tops and bottoms. It identifies points where the price bounces back twice from the same level after a long trend, signaling potential market reversals. Real

EZZ Elite Zig Zag is an indicator for the MetaTrader 4 terminal. This indicator traces the peak of the trend based on the market reversal, thus showing various opportunities in the financial market. EZZ Elite Zig Zag is a visual tool, intuitive, and easy to understand and use.
Test it Yourself by Downloading it for Free.
Author Paulo Rocha all rights reserved

The dashboard should help to get a quick overview of the correlations of different assets to each other. For this, the value series are compared according to the Pearson method. The result is the value of the correlation (in percent). With the new single asset mode, you can immediately see which symbols have the highest positive or negative correlation. This prevents you from accidentally taking a risk on your trades with highly correlated symbols. Usage
There are different methods for the corr
The EA trading Rsi Divergence strategy. EA uses Grid method. Minimum trading account for 1 pair : 100 $. Designated for trading all major forex pairs. Recommended timeframe : 4H / 1H / 30m / 15m
developed, tested and optimized on " VantageMarkets ", TGLColmex & IFCMarkets platforms. user can run this EA on multiple charts simultaneously. user can use this EA as indicator only.
notice: in the comment section there are settings sets for various charts and brokers. in any case, optimize

The EA opens orders using the Wolfe waves indicator, also uses the Martingale and smart Trailing Stop, Stop Loss and Take Profit. Trades are always protected with STOPLOSS, Smart Trailing and Breakeven. This EA is easy to use. The EA has proven results on EURUSD M5, however you can change the settings for better results on other currencies.
Settings Setting EA - Settings of the Advisor. Invest More - at the value 'true' the lot size increases as the account balance grows.( Risk Management ). In
MetaTrader市场是您可以下载免费模拟自动交易,用历史数据进行测试和优化的唯一商店。
阅读应用程序的概述和其他客户的评论,直接下载程序到您的程序端并且在购买之前测试一个自动交易。只有在MetaTrader市场可以完全免费测试应用程序。
您错过了交易机会:
- 免费交易应用程序
- 8,000+信号可供复制
- 探索金融市场的经济新闻
注册
登录